Fig. 3.
Download original image
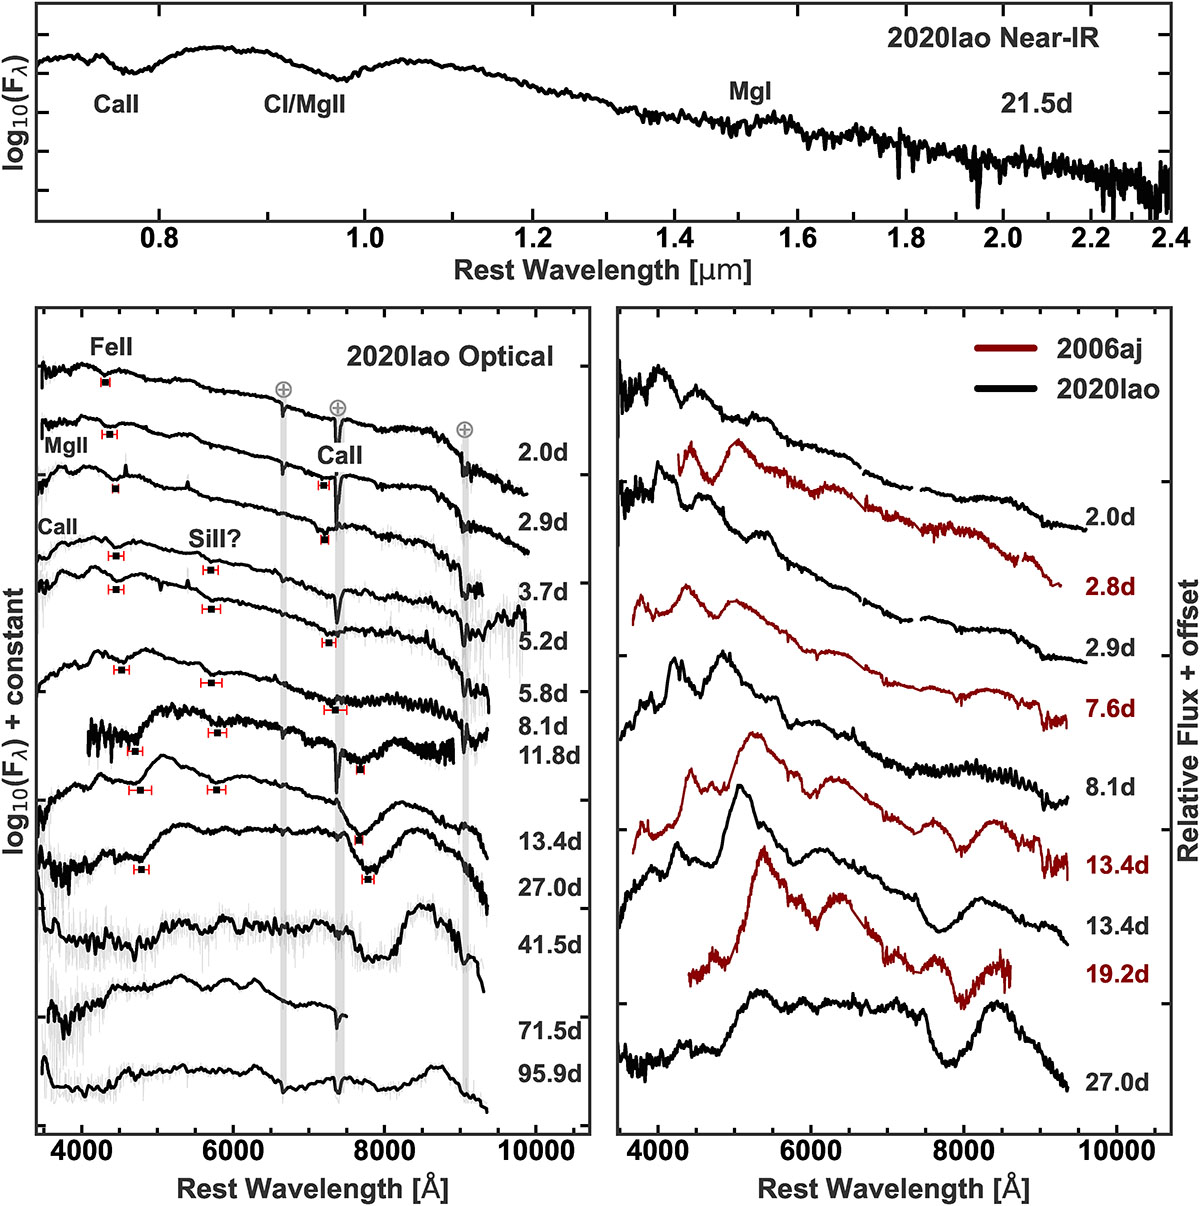
Spectroscopic observations of SN 2020lao. Top: NIR +21.5 days spectrum of SN 2020lao. Left: selected optical spectra of SN 2020lao, corrected for MW reddening and overplotted with a smoothed version. Regions affected by three prevalent telluric features are indicated with vertical gray bands and labeled with Earth symbols. The locations of the absorption minima used to infer the expansion velocities plotted in Fig. 6 are marked with black dots, with red error bars indicating the wavelength ranges that define the associated uncertainties in the positions of maximum absorption. Right: comparison between similar epoch spectra of SN 2020lao and SN 2006aj (Pian et al. 2006; Sonbas et al. 2008).
Current usage metrics show cumulative count of Article Views (full-text article views including HTML views, PDF and ePub downloads, according to the available data) and Abstracts Views on Vision4Press platform.
Data correspond to usage on the plateform after 2015. The current usage metrics is available 48-96 hours after online publication and is updated daily on week days.
Initial download of the metrics may take a while.