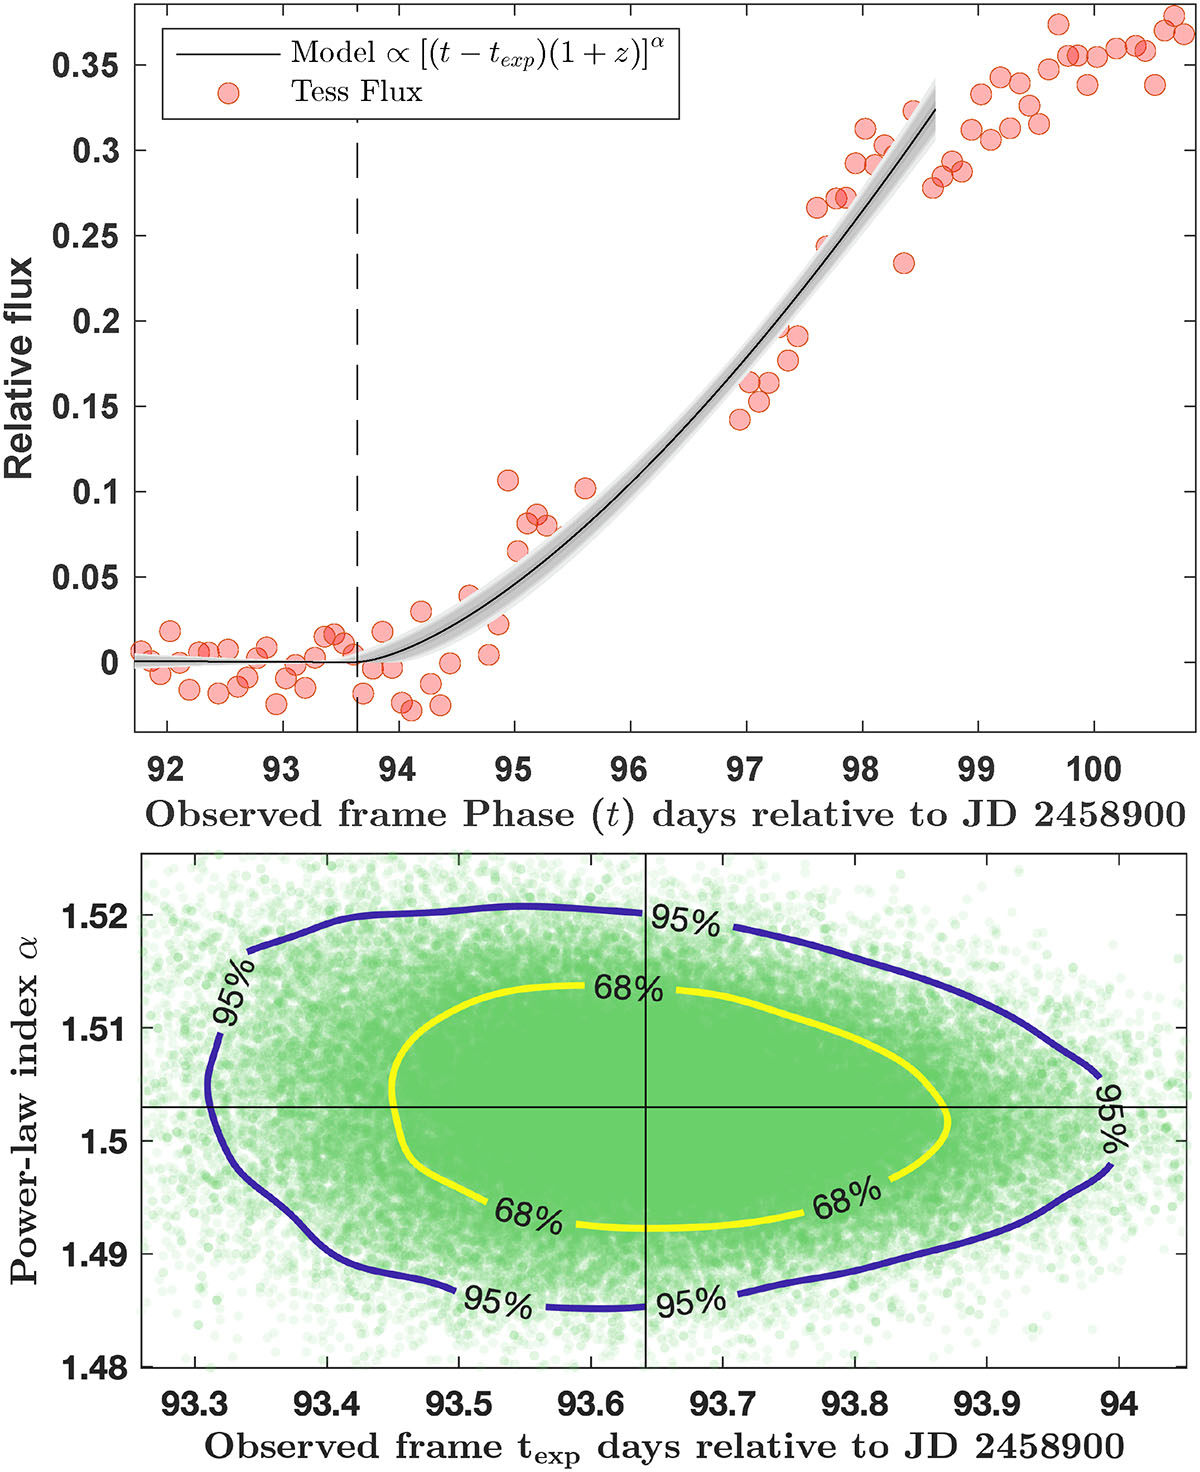
Fig. 4.
Download original image
Top panel: binned TESS light curve adopting a bin size of two hours and plotted vs. phase relative to JD 2458900. Over-plotted is our best-fit power law. Bottom panel: 2D probability density of the MCMC sample between the fit parameters – time of explosion, texp, and power-law index, α. The contours correspond to 68% and 95% confidence intervals. The solid intersecting black lines indicate the mean of the MCMC sample for parameters ![]() (vertical) and
(vertical) and ![]() (horizontal).
(horizontal).
Current usage metrics show cumulative count of Article Views (full-text article views including HTML views, PDF and ePub downloads, according to the available data) and Abstracts Views on Vision4Press platform.
Data correspond to usage on the plateform after 2015. The current usage metrics is available 48-96 hours after online publication and is updated daily on week days.
Initial download of the metrics may take a while.