| Issue |
A&A
Volume 709, May 2026
|
|
|---|---|---|
| Article Number | A104 | |
| Number of page(s) | 13 | |
| Section | Interstellar and circumstellar matter | |
| DOI | https://doi.org/10.1051/0004-6361/202553682 | |
| Published online | 08 May 2026 | |
The abundance of interstellar C60 molecules toward BD+31°643 and other stars
1
Laboratory Astrophysics Group of the Max Planck Institute for Astronomy at the Friedrich Schiller University Jena, Institute of Solid State Physics,
Helmholtzweg 3,
07743
Jena,
Germany
2
Max-Planck-Institut für Astronomie,
Königstuhl 17,
69117
Heidelberg,
Germany
★ Corresponding author: This email address is being protected from spambots. You need JavaScript enabled to view it.
Received:
6
January
2025
Accepted:
18
February
2026
Abstract
Context. The diffuse interstellar bands (DIBs) at 9577 and 9632 Å are attributed to electronic transitions of the C60+ fullerene ion; thus, its column density in molecular clouds may be inferred. A comparison with the column density of the neutral C60 fullerene makes it possible to determine local physical conditions in the clouds.
Aims. We aim to detect absorption lines of neutral C60 in the visible spectra of stars toward interstellar clouds.
Methods. We searched for the γ0, A0, and A1 absorption bands of C60 near 6070 Å, 4024 Å, and 3980 Å using the Potsdam Echelle Polarimetric and Spectroscopic Instrument at the Large Binocular Telescope. We measured spectra toward eight background stars including BD+31°643.
Results. None of the γ0, A0, and A1 absorption bands of C60 were detected in our spectra. Toward BD+31°643, we determine an upper limit of (14 ± 11) × 1012 cm−2 for the column density of C60, and values in the range of 1012−1014 cm−2 toward other stars. Using literature data for C60+, we derive upper limits of 0.8–3.8 for the C60:C60+ column density ratios.
Conclusions. The non-detection of the γ0 absorption band toward BD+31°643 is in conflict with a measurement employing infrared (IR) emission bands of C60. The discrepancy may indicate that free C60 molecules are not the source of the observed IR emission bands toward the star and that the IR emission arises from C60 molecules in dust grains instead. Alternatively, the oscillator strength of the γ0 band may not be well constrained from the laboratory measurements.
Key words: astrochemistry / ISM: abundances / ISM: lines and bands / ISM: molecules
© The Authors 2026
 Open Access article, published by EDP Sciences, under the terms of the Creative Commons Attribution License (https://creativecommons.org/licenses/by/4.0), which permits unrestricted use, distribution, and reproduction in any medium, provided the original work is properly cited.
This article is published in open access under the Subscribe to Open model.
Open Access funding provided by Max Planck Society.
1 Introduction
The column density of the ![Mathematical equation: $\[\mathrm{C}_{60}^{+}\]$](/articles/aa/full_html/2026/05/aa53682-25/aa53682-25-eq4.png) fullerene ion in the gas phase of the interstellar medium (ISM) may be derived from the strength of several diffuse interstellar bands (DIBs) in the visible spectra of reddened, early-type stars (Foing & Ehrenfreund 1994, 1997; Campbell et al. 2015, 2016a,b; Walker et al. 2015, 2016, 2017; Cordiner et al. 2019; Schlarmann et al. 2021; Nie et al. 2022), specifically the strongest bands at 9577 Å and 9632 Å. Absorption bands from neutral C60 have not been reported yet, in spite of the presence of promising absorption bands that are located in the visible part of the spectrum, such as the A0 and A1 bands at 4024 and 3980 Å, respectively, and the weaker γ0 band at 6070 Å (Rouillé et al. 2021, thereafter Paper 1, and references therein). The detection of interstellar C60 is desired as the knowledge of the
fullerene ion in the gas phase of the interstellar medium (ISM) may be derived from the strength of several diffuse interstellar bands (DIBs) in the visible spectra of reddened, early-type stars (Foing & Ehrenfreund 1994, 1997; Campbell et al. 2015, 2016a,b; Walker et al. 2015, 2016, 2017; Cordiner et al. 2019; Schlarmann et al. 2021; Nie et al. 2022), specifically the strongest bands at 9577 Å and 9632 Å. Absorption bands from neutral C60 have not been reported yet, in spite of the presence of promising absorption bands that are located in the visible part of the spectrum, such as the A0 and A1 bands at 4024 and 3980 Å, respectively, and the weaker γ0 band at 6070 Å (Rouillé et al. 2021, thereafter Paper 1, and references therein). The detection of interstellar C60 is desired as the knowledge of the ![Mathematical equation: $\[\mathrm{C}_{60}\text{:} \mathrm{C}_{60}^{+}\]$](/articles/aa/full_html/2026/05/aa53682-25/aa53682-25-eq5.png) abundance ratio in a given region is an indicator of local conditions, such as the strength of the interstellar radiation field (ISRF) and the electron density (Bakes & Tielens 1995; Sidhu et al. 2023), or the abundance of hydrogen atoms (Abbink et al. 2024). To date, however, models linking interstellar C60 ion fractions to local conditions yield somewhat diverging results. While Abbink et al. (2024) calculated a maximum relative abundance of 15% for neutral C60 under the most favorable conditions in the ISM, Sidhu et al. (2023) found that neutral molecules account for at least 50% of the C60 fullerene population over a range of conditions, including some relevant to photodissociation regions.
abundance ratio in a given region is an indicator of local conditions, such as the strength of the interstellar radiation field (ISRF) and the electron density (Bakes & Tielens 1995; Sidhu et al. 2023), or the abundance of hydrogen atoms (Abbink et al. 2024). To date, however, models linking interstellar C60 ion fractions to local conditions yield somewhat diverging results. While Abbink et al. (2024) calculated a maximum relative abundance of 15% for neutral C60 under the most favorable conditions in the ISM, Sidhu et al. (2023) found that neutral molecules account for at least 50% of the C60 fullerene population over a range of conditions, including some relevant to photodissociation regions.
We presented upper limits of the ![Mathematical equation: $\[\mathrm{C}_{60}\text{:} \mathrm{C}_{60}^{+}\]$](/articles/aa/full_html/2026/05/aa53682-25/aa53682-25-eq6.png) column density ratio in diffuse and translucent interstellar clouds in seven lines of sight (LOSs) (Paper 1). While large error margins characterize the inferred ratios, mainly because of uncertainties on the absorption cross sections and oscillator strengths of the respective bands, we concluded that average ratios are as high as 1.3, a plausible limit in view of the recent study by Sidhu et al. (2023). We also argued that the γ0 band of C60 is the most promising absorption feature to look for. The expected width of ~1.5 Å combined with a central wavelength of 6070 Å makes γ0 a better target for a search of interstellar C60, compared to the A0 and A1 bands at 4024 Å and 3980 Å. Although the latter two bands are stronger than the γ0 band, they are significantly broader, with full widths at half maximum (FWHMs) of 4.05 ± 0.81 Å and 5.54 ± 0.80 Å, respectively, and their position is located in regions of relatively strong stellar absorption lines.
column density ratio in diffuse and translucent interstellar clouds in seven lines of sight (LOSs) (Paper 1). While large error margins characterize the inferred ratios, mainly because of uncertainties on the absorption cross sections and oscillator strengths of the respective bands, we concluded that average ratios are as high as 1.3, a plausible limit in view of the recent study by Sidhu et al. (2023). We also argued that the γ0 band of C60 is the most promising absorption feature to look for. The expected width of ~1.5 Å combined with a central wavelength of 6070 Å makes γ0 a better target for a search of interstellar C60, compared to the A0 and A1 bands at 4024 Å and 3980 Å. Although the latter two bands are stronger than the γ0 band, they are significantly broader, with full widths at half maximum (FWHMs) of 4.05 ± 0.81 Å and 5.54 ± 0.80 Å, respectively, and their position is located in regions of relatively strong stellar absorption lines.
Evaluating infrared (IR) emission spectra taken with the Spitzer Space Telescope, Iglesias-Groth (2019) postulated the presence of C60 emission toward BD+31°643 (as LRLL 1) and other members of the open cluster IC 348. They attributed the emission to free molecules in the gas phase in the foreground of the star within the volume of the cluster and obtained a column density of 2 × 1014 cm−2 toward the star. Such a large column density should lead to an equivalent width of 26 mÅ for the γ0 band of C60 (see Sect. 3). The absorption feature is thus expected to be readily detectable in a high signal-to-noise ratio (S/N) spectrum of the star.
The detection of C60 in absorption allows a direct comparison of its inferred column density with that of ![Mathematical equation: $\[\mathrm{C}_{60}^{+}\]$](/articles/aa/full_html/2026/05/aa53682-25/aa53682-25-eq7.png) as inferred from the corresponding DIBs, as both molecules were sampled in exactly the same parcels of gas. Here, we present a search for neutral C60 absorption lines in the spectrum of BD+31°643 and toward a number of additional stars behind diffuse and translucent molecular clouds. Observations and results are summarized in Sects. 2 and 3, respectively, including upper limits in the C60 column densities and
as inferred from the corresponding DIBs, as both molecules were sampled in exactly the same parcels of gas. Here, we present a search for neutral C60 absorption lines in the spectrum of BD+31°643 and toward a number of additional stars behind diffuse and translucent molecular clouds. Observations and results are summarized in Sects. 2 and 3, respectively, including upper limits in the C60 column densities and ![Mathematical equation: $\[\mathrm{C}_{60}\text{:} \mathrm{C}_{60}^{+}\]$](/articles/aa/full_html/2026/05/aa53682-25/aa53682-25-eq8.png) ratios. A detailed discussion with a focus on the LOS toward BD+31°643 is presented in Sect. 4.
ratios. A detailed discussion with a focus on the LOS toward BD+31°643 is presented in Sect. 4.
Program stars and properties of LOSs.
2 Observations
We carried out observations at the Large Binocular Telescope (LBT) with the Potsdam Echelle Polarimetric and Spectroscopic Instrument (PEPSI; Strassmeier et al. 2015). The instrument enabled us to obtain stellar spectra covering the wavelength ranges of 3830–4260 and 5370–6310 Å with a resolving power of 43 000. A hollow-cathode Th–Ar lamp and a Fabry–Pérot interferometer were used to perform the wavelength calibration. Measurements covering both wavelength ranges were obtained simultaneously and were reduced using the data-reduction package SDS4PEPSI (Strassmeier et al. 2018). Table 1 summarizes the photometric properties of the stars in our sample.
The main aspect of this study was to search for the γ0 band of C60 near 6070 Å and to confirm the presence of interstellar C60 toward BD+31°643. Apart from that LOS, we also observed four stars that show strong absorptions from the ![Mathematical equation: $\[\mathrm{C}_{60}^{+}\]$](/articles/aa/full_html/2026/05/aa53682-25/aa53682-25-eq9.png) DIBs (see Sect. 3), namely, Cyg OB2 5, HD 23180, HD 37022, and HD 183143. We included the stars Cyg OB2 3 and HD 41690 in our selection because their spectra show DIBs (Hamano et al. 2016; Isobe et al. 1986, respectively). A strong extinction in the UV domain characterizes the remaining target, HD 24432 (Massa et al. 1983; Zdanavičius et al. 2002).
DIBs (see Sect. 3), namely, Cyg OB2 5, HD 23180, HD 37022, and HD 183143. We included the stars Cyg OB2 3 and HD 41690 in our selection because their spectra show DIBs (Hamano et al. 2016; Isobe et al. 1986, respectively). A strong extinction in the UV domain characterizes the remaining target, HD 24432 (Massa et al. 1983; Zdanavičius et al. 2002).
The spectra were reduced to barycentric standard of rest (BSR) wavelengths. Velocities inferred for detected atomic and molecular species are presented in Appendix A. For each LOS, we derived a mean radial velocity for the detected molecular features, except for HD 37022 where molecular features were not detected. For that LOS, we derived a mean radial velocity of the Na I D1 and D2, and Ca II K lines. For the main part of the discussion presented below, we shifted the stellar spectra such that the atomic or molecular absorption lines appear near their rest laboratory wavelengths, using the mean velocities. This method introduces a minor scatter of a few km s−1, which is irrelevant to the discussion presented below. We also note a small shift that affects the position of the DIBs in our spectra compared to the positions given by Hobbs et al. (2009), which results from their choice of interstellar potassium when shifting to laboratory wavelengths (see details in Appendix A).
3 Results
Figure 1 presents extracted parts of the stellar spectra near the position of the γ0 band of C60, Fig. 2 displays the measurements obtained in the 4000 Å wavelength region covering the A0 and A1 bands, and Fig. B.1 shows the spectra in full. The positions of the C60 bands are indicated by vertical dotted lines. Most of the absorption features in the spectra displayed in Fig. 1 agree with known DIBs. Those near 6074.3 Å in the spectra of HD 24432 and HD 183143 are stellar Ne I 6074.338 Å lines (Kramida et al. 2021). None of the spectra of Fig. 1 show absorption features of the γ0 band. As the γ0 band is located between the 6068.4 and 6071.1 Å DIBs and an uncertainty of 1.0 Å affects its position, we must remark that there are no grounds for identifying either of these well-documented DIBs as γ0. In particular, we did not find any corresponding candidates in DIB studies or in our spectra, including those in Paper 1, for either the A0 or A1 bands.
We note the presence of an absorption line near the position of the A0 band toward HD 24432 and HD 183143. The features, located just blueward of a stellar He I 4026.19 Å line, have a FWHM of ~0.8 Å, compared to an expected width of 4.05 Å for the A0 band. We attribute them to the He I 4023.973 Å stellar line (Kramida et al. 2021). Figure 3 compares the spectrum measured toward HD 183143 with a spectrum of β Ori, which is not reddened and has been used as a reference for DIB identification (e.g., Hobbs et al. 2009). The comparison favors this assignment.
Table 2 gives the S/N values around 6070 Å for the present spectra. As they range from 1084 for Cyg OB2 3 to 2043 for HD 183143, they enable us to detect the γ0 band when the column density of C60 is greater than 1013 cm−2, as the following explains. We infer column densities, N, from measured equivalent widths, W, using
![Mathematical equation: $\[N=\frac{4 \epsilon_0 m c^2}{e^2 \lambda^2} \frac{W}{f},\]$](/articles/aa/full_html/2026/05/aa53682-25/aa53682-25-eq10.png) (1)
(1)
where m and e are the mass and charge of an electron, respectively; c is the speed of light in vacuum; and ϵ0 is the permittivity of vacuum (e.g., Paper 1). Applying this relation to the γ0 band, using a central wavelength λ(γ0) of 6070 ± 1.0 Å and an oscillator strength f(γ0) of 0.00040 ± 0.00016 (Paper 1), we expect W(γ0) = 1.3 mÅ for N(γ0) = 1013 cm−2. In the case of non-detections, we can simply infer 3-σ upper limits for W, uW, using
![Mathematical equation: $\[{ }^{\mathrm{u}} W=3 \sqrt{M} \frac{\Delta \lambda}{\rho},\]$](/articles/aa/full_html/2026/05/aa53682-25/aa53682-25-eq11.png) (2)
(2)
where M is the number of resolution elements that correspond to the spread of the line, Δλ is the spectral width of a resolution element, and ρ is the S/N (Jenkins et al. 1973). Application to γ0 gives
![Mathematical equation: $\[{ }^{\mathrm{u}} W(\gamma_0)=3 \sqrt{\frac{w(\gamma_0) \lambda(\gamma_0)}{R}} \frac{1}{\rho},\]$](/articles/aa/full_html/2026/05/aa53682-25/aa53682-25-eq12.png) (3)
(3)
where w(γ0) is the FWHM of γ0, which is expected to be 1.5 ± 0.5 Å (Paper 1), and R is the resolving power. Using Eq. (3), we find that a S/N of 1060 corresponds to 1.3 m Å being an upper limit to W(γ0) for a column density of C60, N(0), of 1013 cm−2.
We estimated the equivalent width detection threshold, σEW(γ0), of the γ0 band in the spectra of our program stars following Lawton et al. (2008), taking into account the normalized flux values in the 6000–6140 Å interval and the profile descriptors for γ0, along with their errors. Figure 4 shows the σEW curves for the γ0 band of C60 in the 6070 Å region of the spectra of the program stars. We then derived the 3-σ upper limits uW(γ0) = 3σEW (γ0) and obtained upper limits uN(0) following Eq. (1). Table 2 summarizes the values inferred for uN(0) toward each target star as determined from the corresponding σEW(γ0) value. Despite the higher S/N of the new observations, the resulting uN(0) values given in Table 2 are on the same order as those obtained previously (Paper 1). The improvement expected from the higher S/N obtained in the present study is not present, mainly because the pixel dispersion here is larger than those in the previous study.
The spectra of five of our program stars show at least one of the two strongest DIBs attributed to ![Mathematical equation: $\[\mathrm{C}_{60}^{+}\]$](/articles/aa/full_html/2026/05/aa53682-25/aa53682-25-eq13.png) ions: DIBs 9577Å and 9632Å. To derive values for the column density of
ions: DIBs 9577Å and 9632Å. To derive values for the column density of ![Mathematical equation: $\[\mathrm{C}_{60}^{+}\]$](/articles/aa/full_html/2026/05/aa53682-25/aa53682-25-eq14.png) , which we denote by N(+), we used the observed equivalent widths of the DIBs, completed with the absorption cross section and FWHM of the corresponding bands in the spectrum of
, which we denote by N(+), we used the observed equivalent widths of the DIBs, completed with the absorption cross section and FWHM of the corresponding bands in the spectrum of ![Mathematical equation: $\[\mathrm{C}_{60}^{+}\]$](/articles/aa/full_html/2026/05/aa53682-25/aa53682-25-eq15.png) (Campbell et al. 2016b). We presented this procedure in detail in Paper 1. Table 3 presents all N(+) values with estimated errors. The latter took into account errors affecting the absorption cross sections and FWHMs of the bands, and the calculation of N(+) included a correction for large errors following Seiler (1987). We note that the column densities lie within a narrow interval as they range approximately from (1–4) × 1013 cm−2. The values that we determined for other LOSs in our previous study, (1–3) × 1013 cm−2, coincide with this interval.
(Campbell et al. 2016b). We presented this procedure in detail in Paper 1. Table 3 presents all N(+) values with estimated errors. The latter took into account errors affecting the absorption cross sections and FWHMs of the bands, and the calculation of N(+) included a correction for large errors following Seiler (1987). We note that the column densities lie within a narrow interval as they range approximately from (1–4) × 1013 cm−2. The values that we determined for other LOSs in our previous study, (1–3) × 1013 cm−2, coincide with this interval.
Table 4 presents the upper limits for the ![Mathematical equation: $\[\mathrm{C}_{60}\text{:} \mathrm{C}_{60}^{+}\]$](/articles/aa/full_html/2026/05/aa53682-25/aa53682-25-eq16.png) column density ratio toward the program stars taking into account the new observations. Concerning the DIBs attributed to
column density ratio toward the program stars taking into account the new observations. Concerning the DIBs attributed to ![Mathematical equation: $\[\mathrm{C}_{60}^{+}\]$](/articles/aa/full_html/2026/05/aa53682-25/aa53682-25-eq17.png) , we only considered W values reported with an error (Table 3). Only Galazutdinov et al. (2017) indicated the errors on the FWHMs of the DIBs. Nevertheless, when evaluating the error on the
, we only considered W values reported with an error (Table 3). Only Galazutdinov et al. (2017) indicated the errors on the FWHMs of the DIBs. Nevertheless, when evaluating the error on the ![Mathematical equation: $\[\mathrm{C}_{60}\text{:} \mathrm{C}_{60}^{+}\]$](/articles/aa/full_html/2026/05/aa53682-25/aa53682-25-eq18.png) ratio, we took into account, in all cases, the laboratory values obtained by Campbell et al. (2016b) that are w(
ratio, we took into account, in all cases, the laboratory values obtained by Campbell et al. (2016b) that are w(![Mathematical equation: $\[\mathrm{C}_{60}^{+}\]$](/articles/aa/full_html/2026/05/aa53682-25/aa53682-25-eq19.png) , 9577.5 Å) = 2.5 ± 0.2 mÅ for w(DIB, 9577 Å) and w(
, 9577.5 Å) = 2.5 ± 0.2 mÅ for w(DIB, 9577 Å) and w(![Mathematical equation: $\[\mathrm{C}_{60}^{+}\]$](/articles/aa/full_html/2026/05/aa53682-25/aa53682-25-eq20.png) , 9632.7 Å) = 2.2 ± 0.2 mÅ for w(DIB, 9632 Å). Upper limits for the
, 9632.7 Å) = 2.2 ± 0.2 mÅ for w(DIB, 9632 Å). Upper limits for the ![Mathematical equation: $\[\mathrm{C}_{60}\text{:} \mathrm{C}_{60}^{+}\]$](/articles/aa/full_html/2026/05/aa53682-25/aa53682-25-eq21.png) ratio are in the 0.8–3.8 range.
ratio are in the 0.8–3.8 range.
Table 5 presents the equivalent widths W(DIB, 5797 Å) and W(DIB, 5780 Å) that were measured toward our program stars, and their ratio. The spectra are displayed in Fig. 5. We evaluated each equivalent width by integrating the area of the band to which we attributed a straight line as a local baseline following Galazutdinov et al. (2004). We opted for simplicity given that the shape of the actual continuum is uncertain, as are the contributions of other absorptions (for options, see Fan et al. 2017 and references therein).
The ![Mathematical equation: $\[\mathrm{C}_{60}\text{:} \mathrm{C}_{60}^{+}\]$](/articles/aa/full_html/2026/05/aa53682-25/aa53682-25-eq22.png) ratio in a given cloud is an indicator of the local strength of the ISRF, thus complementing values obtained from the ratios of equivalent widths of the DIBs at 5797 Å and 5780 Å. Given a single cloud, the ratio of these equivalent widths depends on the extinction curve of the cloud as first noted by Krełowski & Westerlund (1988). Whether this ratio is linked to the strength of the ISRF is still debated (Fan et al. 2017 and references therein). The carrier of DIB 5797 Å, unlike that of DIB 5780 Å, was found to be sensitive to the strength of the ISRF, as indicated by a lower abundance in regions of stronger ISRF. Consequently, W(DIB, 5797 Å)/W(DIB, 5780 Å) serves as an indicator for the strength of the ISRF (see Fig. 21 in Vos et al. 2011).
ratio in a given cloud is an indicator of the local strength of the ISRF, thus complementing values obtained from the ratios of equivalent widths of the DIBs at 5797 Å and 5780 Å. Given a single cloud, the ratio of these equivalent widths depends on the extinction curve of the cloud as first noted by Krełowski & Westerlund (1988). Whether this ratio is linked to the strength of the ISRF is still debated (Fan et al. 2017 and references therein). The carrier of DIB 5797 Å, unlike that of DIB 5780 Å, was found to be sensitive to the strength of the ISRF, as indicated by a lower abundance in regions of stronger ISRF. Consequently, W(DIB, 5797 Å)/W(DIB, 5780 Å) serves as an indicator for the strength of the ISRF (see Fig. 21 in Vos et al. 2011).
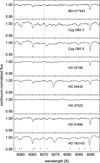 |
Fig. 1 Continuum-normalized flux spectra of the eight LOSs in the program. Each panel and the spectrum it presents are labeled with the identifier of the target star. The position of the γ0 band of C60 is indicated through all panels (vertical dotted line). Positions of DIBs given by Hobbs et al. (2009) are indicated in the bottom panel by short vertical lines. |
 |
Fig. 2 Continuum-normalized flux spectra of the eight LOSs. Each panel and the spectrum it presents are labeled with the identifier of the target star. The positions of the A0 and A1 bands of C60 – respectively 4024 and 3980 Å – are indicated through all panels (vertical dotted lines). See Paper 1 for the detailed assignment. |
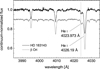 |
Fig. 3 Continuum-normalized flux spectra toward HD 183143 (black line) and β Ori (gray line). The spectrum toward β Ori (European Southern Observatory) is vertically offset and its wavelength scale is corrected for convenient comparison. The vertical dotted line indicates the position of the A0 band of C60 at 4024 Å. Straight lines point to He I lines identified by their laboratory rest wavelengths (Kramida et al. 2021). |
Upper limits for column densities of C60.
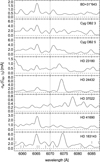 |
Fig. 4 Equivalent-width detection threshold of C60 in the 6070 Å region for the eight LOSs in the program. Each panel and the spectrum it presents are labeled with the identifier of the target star. The position of the γ0 band of C60 is indicated through all panels (vertical dotted line). In all panels, a zero threshold is drawn to serve as a guide to the eye (horizontal dashed line). Positions of DIBs according to Hobbs et al. (2009) are indicated in the bottom panel (short vertical lines). |
4 Discussion
The upper limits in the C60 column density derived toward BD+31°643 are not consistent with a value of N(0) as high as the 2 × 1014 cm−2 reported previously (Iglesias–Groth 2019). As an illustration of the discrepancy, the expected strength of the γ0 band for a C60 column density of 2 × 1014 cm−2 is shown in Fig. 6, and that of the A0 and A1 bands in Fig. 7. Both figures clearly illustrate the advantage the γ0 band offers, over the A0 and A1 band, when searching for interstellar C60 absorption bands in the visible. We note that, keeping the relative error, f(γ0) must be at most 0.00005 ± 0.00002 to give uN(0) a value of (1.1 ± 0.9) × 1014 cm−2 that comes close to the result of Iglesias-Groth (2019). This value is not compatible with the adopted 0.00040 ± 0.00016.
The non-detection of the γ0 band implies that either the column density determined by Iglesias-Groth (2019) or the oscillator strength attributed to γ0 in Paper 1 were overestimated. We may also speculate that the C60 emission does not arise from gas-phase molecules but from molecules bound in grains, or that foreground C60 emission arises from regions that are not sampled by the pencil beam tested in the present absorption line study. We note that the oscillator strength of γ0 was not very accurately determined and needs to be confirmed. A better characterization of the band profile, that is, peak wavelength and FWHM, is also desirable. New measurements are, however, beyond the scope of this study. As for the column density that Iglesias-Groth (2019) derived, we discuss its validity below and present an alternative interpretation of the observed IR emission bands.
Column densities of ![Mathematical equation: $\[\mathrm{C}_{60}^{+}\]$](/articles/aa/full_html/2026/05/aa53682-25/aa53682-25-eq23.png) .
.
Upper limits for ![Mathematical equation: $\[\mathrm{C}_{60}\text{:} \mathrm{C}_{60}^{+}\]$](/articles/aa/full_html/2026/05/aa53682-25/aa53682-25-eq24.png) as uN(0)/N(+) from the comparison of the γ0 band of C60 with DIB 9577Å and DIB 9632Å.
as uN(0)/N(+) from the comparison of the γ0 band of C60 with DIB 9577Å and DIB 9632Å.
4.1 BD+31°643 and its environment
The binary star BD+31°643 is a member of the open cluster IC 348, which is embedded in the Per OB2 association (Scholz et al. 1999). The cluster has an actual radius of 10′−15′ (Scholz et al. 1999), which is equivalent to 0.9–1.4 pc when taking a distance of 316 pc (Herbig 1998) into account. Its optical radius, however, is ~4.0′ or 0.37 pc (Herbig 1998). The cluster is located in the Perseus molecular cloud complex, at its northeastern extremity, where BD+31°643 generates a reflection nebula (e.g., Racine 1968) and a photodissociation region (PDR) (Snow et al. 1994; Sun et al. 2008; Velusamy et al. 2017). The star is close to the center of a dust cloud as large as IC 348 (Snow et al. 1994; Siebenmorgen et al. 2020). Although the dust emissivity over the cluster region is similar to that of an H II region, measurements of H II at 4.85 GHz reveal a low value of 200 mJy (Tibbs et al. 2010), and Olofsson et al. (2012) did not find signs of an H II region around BD+31°643. Nevertheless, the ISRF is strong enough to excite the anomalous microwave emission that is observed in IC 348 (Tibbs et al. 2011) and to heat grains stochastically. Stellar winds blow shells and bubbles that expand through the cluster (Arce et al. 2011) and BD+31°643 is driving the expansion of a bubble, now about 5.2′ in diameter (radius of 2.6′ in Arce et al. 2011). This bubble is not complete, for BD+31°643 is at the front of the Perseus molecular cloud and hence blows a hemisphere into its material. The cluster IC 348 is located inside a supernova remnant, which is source of cosmic rays (Knauth et al. 2017).
The star BD+31°643 generates a reflection nebula that features IR emission bands attributed to photoexcited polycyclic aromatic hydrocarbon (PAH) molecules (Olofsson et al. 2012). We examined these IR emission bands (see Fig. 18 in Olofsson et al. 2012) and, taking into account the widths and relative intensities described by Rapacioli et al. (2005), we conclude that the emitting gas consists of a mixture of neutral and ionized PAH molecules. The PAH emission constitutes a background signal, and its subtraction from measurements toward BD+31°643 shows that the PAH species are actually absent from the proximity of the binary star, unlike an unidentified matter that radiates at 16 μm wavelength, which probably consists of PAH clusters (Olofsson et al. 2012). In fact, PAH molecules spread beyond the nebula and IC 348, populating the Perseus cloud according to maps that Tibbs et al. (2011) established from the analysis of emission measurements at 8 μm. The maps also indicate a lower abundance of the PAH ions and molecules in the open cluster compared to its surroundings, except in the southwestern direction.
Ratios W(DIB, 5797 Å)/W(DIB, 5780 Å).
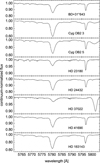 |
Fig. 5 Diffuse interstellar bands 5780Å and 5797Å. Each panel and the spectrum it presents are labeled with the identifier of the target star. |
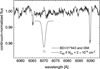 |
Fig. 6 Continuum-normalized flux spectrum of BD+31°643 (black curve). A synthetic γ0 band of free, cold C60 molecules with a column density of 2 × 1014 cm−2 (Iglesias-Groth 2019) is displayed for comparison (thick gray curve, vertically offset for clarity). |
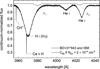 |
Fig. 7 Continuum-normalized flux spectrum of BD+31°643 (black curve). Synthetic A0 and A1 bands of free, cold C60 molecules with a column density of 2 × 1014 cm−2 (Iglesias-Groth 2019) are displayed for comparison (thick gray curve, vertically offset for clarity). |
4.2 State of the IR photon-emitting C60 fullerenes
The IR emission spectrum of solid-state C60 on a Pt substrate (Fig. 1 of Vassallo et al. 1991) suggests a FWHM somewhat less than 10 cm−1 at 100 °C (373 K) for the band at 18.9 μm. Recent emission measurements on a C60 film on KBr show that this band has a FWHM of about 5 cm−1 at 91 °C (362 K; Wakabayashi et al. 2024). For comparison, the FWHM reported by Iglesias-Groth (2019) for the superimposed bands of C60 and C70 at the same wavelength is 0.33 μm in a low-resolution spectrum of BD+31°643 and 0.3 μm in a high-resolution spectrum of its neighbor LRLL 2, also referenced as IC 348 12. These values are equivalent to 9 and 8 cm−1, respectively. We are careful to remark that C60 is the main contributor to this composite feature, with 90% and 70% of the flux detected toward BD+31°643 and LRLL 2, respectively, taking into account values derived by Iglesias-Groth (2019). Thus, the FWHMs of the IR emission bands observed toward BD+31°643 allow us to attribute these bands to C60 molecules in grains.
As for the γ0 absorption band of C60 in a solid phase, its FWHM is already as large as 14 Å when the molecule is isolated in a droplet of very weakly interacting He atoms at ~0.4 K (half width of 19 cm−1 according to Close et al. 1997) and on the order of 10 Å when the molecule is in Ne ice at 4–7.5 K (see spectra in Hung et al. 1996; Sassara et al. 1996, 1997; Rouillé et al. 2021). In the case of a C60 thin film, γ0 is even about an order of magnitude broader in absorption spectra measured at 20 K (band assigned as a + ℏωg in Fig. 1 of Reber et al. 1991) and at 80 K (band labeled F2′ in Fig. 3 of Wang et al. 1995), with the surrounding minor absorptions likely contributing to the effect. A reflection spectrum measured at 46 K shows a similarly broad band (Hora et al. 1996). To be noted, the γ0 band in a C60 thin film is not only broadened, it is also strongly shifted to ~6360 Å (15 723 cm−1 at 80 K according to Wang et al. 1995), which is outside the range of our measurements. Coherently, γ2 and γ3 (Paper 1) in the spectrum of the film at 80 K are severely broadened, they overlap, and they are shifted to ~6130 and ~6050 Å, respectively (bands labeled F4′ and F5′ in Fig. 3 of Wang et al. 1995), where we looked for the γ0 absorption band of free C60 molecules. At 300 K, only a bump in the absorption spectrum reveals the presence of the γ0,2,3 bands (see Fig. 3 of Wang et al. 1995). Accordingly, the fact that our spectra, displayed in their entirety in Fig. B.1, do not show the γ0,2,3 bands of C60-containing grains can be the simple consequence of their very large FWHMs.
Furthermore, Iglesias-Groth (2019) attributed a temperature not higher than 250 K to the emitting C60 molecules on the LOS to BD+31°643. Such a low value is not consistent with the relaxation of free C60 molecules after photoexcitation with FUV photons of the ISRF (Sellgren et al. 2010), which is the model that Iglesias-Groth (2019) used to derive the column density of the molecules. In fact, the absorption of a 3 eV photon heats a C60 molecule to 400 K (Brieva et al. 2016). This inconsistency strengthens the identity of the emitters as components of grains. Nevertheless, the winds of BD+31°643 may free C60 molecules by destroying fullerenic dust grains with shock waves, as proposed for the case of the planetary nebula Tc 1 (Cami et al. 2018). Ionization front conditions can also destroy such grains (Cami et al. 2018). We also remark that Sellgren et al. (2010) determined that the C60 molecules revealed with IR emission spectra of reflection nebulae NGC 7023 and NGC 2023 were in the gaseous state.
4.3 Location of the IR photon-emitting C60 fullerenes
The location of the IR band emitters is a critical parameter in the evaluation of their column density. First, one must question if the measured emission actually includes a major contribution from emitters that are farther than the target star. In that respect, Iglesias-Groth (2019) argued that the emission bands they observed originated in front of BD+31°643 following the implementation of a background-subtraction procedure designed to retain the photon flux measured at the position of the star. Second, if the observed emission is a consequence of the absorption of interstellar FUV photons by the emitters, underestimating the strength of the radiation field at their position leads to the over-estimation of their column density. In the case of BD+31°643, Iglesias-Groth (2019) postulated that the ISRF was 45 G01 on average at the location of the emitting C60 molecules. The strength of the ISRF varies greatly along the LOS, however, and the average FUV irradiance or radiant flux energizing the C60 molecules may be larger than previously estimated. As described in Sect. 4.5, the ISRF strength must be on the order of 170 G0 at the front border of the cluster with the surrounding diffuse material. Further out, in the cloud that contains DIB carriers, it is likely less than 34 G0 considering the equivalent widths of DIBs 5797Å and 5780Å (Sect. 3), and less than 11 G0 according to the column densities of Ca and Ca+(Sect. 4.5). We remark that the decrease in the ISRF strength is not simply a function of the distance to BD+31°643 since the star only generates a part of the field, that is, about 40 χ0 or 68 G0 out of the aforementioned 170 G0 (Sect. 4.5).
According to an earlier assessment (Snow 1993; Snow et al. 1994), the LOS toward BD+31°643 crosses two different regions. As the cluster IC 348 is situated between the Perseus cloud at its back and an expanding cloud of diffuse matter at its front, the first region consists of a layer of this diffuse matter, and the second is the medium within the cluster. The diffuse matter causes a steep FUV extinction that corresponds to dust grains of small sizes, while the medium inside the cluster is characterized by dust that gives a low FUV extinction as a consequence of grain coagulation (Snow et al. 1994). In their study of the anomalous microwave emission in the Perseus cloud, Tibbs et al. (2011) also reported a decrease of the mass abundance of very small grains with respect to that of big grains within IC 348, this decrease being correlated with an increase of the ISRF strength.
Consequently, the IR photon emitters may be components of large grains in IC 348 or components of small grains in the diffuse material outside. Inside the cluster, an ISRF with a minimum strength on the order of 170 G0 can energize the emitters. Therefore, assuming the observed IR flux is proportional to the ISRF strength, if the emitters were only present outside the cluster their abundance should be higher than if they were also present inside.
4.4 Fullerenic IR emission bands and ![Mathematical equation: $\[C_{60}^{+}\]$](/articles/aa/full_html/2026/05/aa53682-25/aa53682-25-eq25.png) DIBs
DIBs
While the IR photon-emitting C60 fullerenes may be components of dust grains (Sect. 4.2), the ![Mathematical equation: $\[\mathrm{C}_{60}^{+}\]$](/articles/aa/full_html/2026/05/aa53682-25/aa53682-25-eq26.png) ions that give DIBs (Table 3) are gas-phase species. The destruction of fullerenic grains may generate C60 molecules (Cami et al. 2018), and the molecules would undergo ionization if they appeared in a region where the FUV ISRF strength is great. In that respect, the stellar winds that blow bubbles in the region of IC 348 (Arce et al. 2011) may form shock waves able to free molecules from dust grains, and the local ISRF would ionize these molecules. The regions most compatible with this scenario are within IC 348, where grains are large and the ISRF strength is the largest (Snow et al. 1994; Tibbs et al. 2011).
ions that give DIBs (Table 3) are gas-phase species. The destruction of fullerenic grains may generate C60 molecules (Cami et al. 2018), and the molecules would undergo ionization if they appeared in a region where the FUV ISRF strength is great. In that respect, the stellar winds that blow bubbles in the region of IC 348 (Arce et al. 2011) may form shock waves able to free molecules from dust grains, and the local ISRF would ionize these molecules. The regions most compatible with this scenario are within IC 348, where grains are large and the ISRF strength is the largest (Snow et al. 1994; Tibbs et al. 2011).
It is therefore not surprising that Snow et al. (1994) placed the DIB carriers inside IC 348. The W(DIB, 5797 Å)/W(DIB, 5780 Å) ratio, however, shows DIB carriers in an ISRF of typical strength (1–20 χ02 or 1.7–34 G0, possibly 1.65–6.1 χ0 or 2.8–10.4 G0, see Sect. 4.5), from which we conclude that they are in the foreground of IC 348. We then had to determine whether the ![Mathematical equation: $\[\mathrm{C}_{60}^{+}\]$](/articles/aa/full_html/2026/05/aa53682-25/aa53682-25-eq27.png) ions, which are DIB carriers, are in the same region. The observation and measurement of the
ions, which are DIB carriers, are in the same region. The observation and measurement of the ![Mathematical equation: $\[\mathrm{C}_{60}^{+}\]$](/articles/aa/full_html/2026/05/aa53682-25/aa53682-25-eq28.png) DIBs toward the neighbor star HD 23180 and BD+31°643, provides us with an answer. They indicate that the column density N(+) toward this star is similar to that toward BD+31°643 (Table 3). Compounding this observation with the similarity between the extinction values determined for the entire length of the LOSs toward HD 23180 and BD+31°643, 0.93 ± 0.16 and 2.45 ± 0.15 mag (Table 1), respectively, we infer that the
DIBs toward the neighbor star HD 23180 and BD+31°643, provides us with an answer. They indicate that the column density N(+) toward this star is similar to that toward BD+31°643 (Table 3). Compounding this observation with the similarity between the extinction values determined for the entire length of the LOSs toward HD 23180 and BD+31°643, 0.93 ± 0.16 and 2.45 ± 0.15 mag (Table 1), respectively, we infer that the ![Mathematical equation: $\[\mathrm{C}_{60}^{+}\]$](/articles/aa/full_html/2026/05/aa53682-25/aa53682-25-eq29.png) ions are in the foreground of the Perseus molecular cloud.
ions are in the foreground of the Perseus molecular cloud.
Berné et al. (2013) detected ![Mathematical equation: $\[\mathrm{C}_{60}^{+}\]$](/articles/aa/full_html/2026/05/aa53682-25/aa53682-25-eq30.png) emission in the reflection nebula NGC 7023, particularly in the bands near 6.4 and 7.1 μm. Concerning BD+31°643, low-resolution spectroscopy (Fig. 1 of Iglesias-Groth 2019) does not show these features, indicating a low amount of
emission in the reflection nebula NGC 7023, particularly in the bands near 6.4 and 7.1 μm. Concerning BD+31°643, low-resolution spectroscopy (Fig. 1 of Iglesias-Groth 2019) does not show these features, indicating a low amount of ![Mathematical equation: $\[\mathrm{C}_{60}^{+}\]$](/articles/aa/full_html/2026/05/aa53682-25/aa53682-25-eq31.png) in the strong ISRF inside IC 348. Moreover, we know that the column density of the ion on the LOS is (22 ± 16) × 1012 cm−2 (Table 3). Assuming the ions are inside the cluster where the strength of the ISRF is greater than 170 G0, which is its value at the front border, and considering that the UV absorption cross section of
in the strong ISRF inside IC 348. Moreover, we know that the column density of the ion on the LOS is (22 ± 16) × 1012 cm−2 (Table 3). Assuming the ions are inside the cluster where the strength of the ISRF is greater than 170 G0, which is its value at the front border, and considering that the UV absorption cross section of ![Mathematical equation: $\[\mathrm{C}_{60}^{+}\]$](/articles/aa/full_html/2026/05/aa53682-25/aa53682-25-eq32.png) is similar to that of C60 at 4.2 × 10⁻¹⁶ cm2 (Berné et al. 2017 and references therein), the IR intensity of the emission by the ions is ≳2 × 10⁻⁷ W m−2 sr−1 since it is proportional to the ISRF (Eq. (B.1) in Berné et al. 2017). For comparison, Iglesias-Groth (2019) estimated the intensity of the IR emission they attributed to neutral C60 molecules in front of BD+31°643 to be 4 × 10⁻⁷ W m−2 sr−1. Because the two intensities are on the same order, the emission bands of the
is similar to that of C60 at 4.2 × 10⁻¹⁶ cm2 (Berné et al. 2017 and references therein), the IR intensity of the emission by the ions is ≳2 × 10⁻⁷ W m−2 sr−1 since it is proportional to the ISRF (Eq. (B.1) in Berné et al. 2017). For comparison, Iglesias-Groth (2019) estimated the intensity of the IR emission they attributed to neutral C60 molecules in front of BD+31°643 to be 4 × 10⁻⁷ W m−2 sr−1. Because the two intensities are on the same order, the emission bands of the ![Mathematical equation: $\[\mathrm{C}_{60}^{+}\]$](/articles/aa/full_html/2026/05/aa53682-25/aa53682-25-eq33.png) ions should be visible toward the star. Since they are not (although Iglesias-Groth (2019) claimed the detection of IR emission bands of
ions should be visible toward the star. Since they are not (although Iglesias-Groth (2019) claimed the detection of IR emission bands of ![Mathematical equation: $\[\mathrm{C}_{60}^{+}\]$](/articles/aa/full_html/2026/05/aa53682-25/aa53682-25-eq34.png) toward the neighbor star LRLL 2, as well as toward other stars and interstellar positions inside IC 348), the assumption that the ions are inside IC 348 is not correct; hence, they are in the foreground. As a consequence, we can infer that the fullerenic grains in the cluster do not release C60 molecules at a rate high enough to give rise, upon exposure to the strong ISRF, to a detectable population of cations.
toward the neighbor star LRLL 2, as well as toward other stars and interstellar positions inside IC 348), the assumption that the ions are inside IC 348 is not correct; hence, they are in the foreground. As a consequence, we can infer that the fullerenic grains in the cluster do not release C60 molecules at a rate high enough to give rise, upon exposure to the strong ISRF, to a detectable population of cations.
We remark that Sidhu et al. (2023) evaluated the fractions of free C60 molecules and ions – namely ![Mathematical equation: $\[\mathrm{C}_{60}^{-}, \mathrm{C}_{60}^{+}\]$](/articles/aa/full_html/2026/05/aa53682-25/aa53682-25-eq35.png) , and
, and ![Mathematical equation: $\[\mathrm{C}_{60}^{2+}\]$](/articles/aa/full_html/2026/05/aa53682-25/aa53682-25-eq36.png) – as functions of a ionization parameter, γ, defined as
– as functions of a ionization parameter, γ, defined as
![Mathematical equation: $\[\gamma=\frac{G_0}{n_{\mathrm{e}}} \sqrt{T},\]$](/articles/aa/full_html/2026/05/aa53682-25/aa53682-25-eq37.png) (4)
(4)
where G0 is the strength of the ISRF in units of G0, ne is the electron density, and T is the gas temperature. According to the study (Fig. 2 in Sidhu et al. 2023), the ![Mathematical equation: $\[\mathrm{C}_{60}\text{:} \mathrm{C}_{60}^{+}\]$](/articles/aa/full_html/2026/05/aa53682-25/aa53682-25-eq38.png) ratio is lower than 3.8 for γ greater than 1.6 × 10⁴ G0 K1/2 s−1. This range of γ values does not include the conditions of a typical diffuse cloud, where G0 = 1 G0, ne = 0.0075 cm−3, and T = 100 K (Bakes & Tielens 1995). The corresponding γ value is 1.3 × 10³ G0 K1/2 s−1, an order of magnitude lower than the lower limit determined above. This does not imply that our conclusion, whereby the observed
ratio is lower than 3.8 for γ greater than 1.6 × 10⁴ G0 K1/2 s−1. This range of γ values does not include the conditions of a typical diffuse cloud, where G0 = 1 G0, ne = 0.0075 cm−3, and T = 100 K (Bakes & Tielens 1995). The corresponding γ value is 1.3 × 10³ G0 K1/2 s−1, an order of magnitude lower than the lower limit determined above. This does not imply that our conclusion, whereby the observed ![Mathematical equation: $\[\mathrm{C}_{60}^{+}\]$](/articles/aa/full_html/2026/05/aa53682-25/aa53682-25-eq39.png) ions are located in the diffuse ISM, is erroneous, as the uncertainties on the ion fractions may be substantial. In particular, the
ions are located in the diffuse ISM, is erroneous, as the uncertainties on the ion fractions may be substantial. In particular, the ![Mathematical equation: $\[\mathrm{C}_{60}^{-}\text{:} \mathrm{C}_{60}\]$](/articles/aa/full_html/2026/05/aa53682-25/aa53682-25-eq40.png) ratio is proportional to the electron attachment coefficient for C60 and the experimental value that Sidhu et al. (2023) applied in their study has “a maximum uncertainty of a factor of 3” (Viggiano et al. 2010). This uncertainty applies to the modeled
ratio is proportional to the electron attachment coefficient for C60 and the experimental value that Sidhu et al. (2023) applied in their study has “a maximum uncertainty of a factor of 3” (Viggiano et al. 2010). This uncertainty applies to the modeled ![Mathematical equation: $\[\mathrm{C}_{60}^{-}\text{:} \mathrm{C}_{60}\]$](/articles/aa/full_html/2026/05/aa53682-25/aa53682-25-eq41.png) ratio and affects the complete distribution of charge states. Finally, conditions in diffuse clouds are not restricted to those proposed by Bakes & Tielens (1995). For instance, in Sect. 4.5, we determined G0 = 2.8–10.4 G0, ne = 0.528 ± 0.009 cm−3, and T = 73 ± 48 K in the diffuse medium in front of BD+31°643, where the error on G0 comes largely from the error on T.
ratio and affects the complete distribution of charge states. Finally, conditions in diffuse clouds are not restricted to those proposed by Bakes & Tielens (1995). For instance, in Sect. 4.5, we determined G0 = 2.8–10.4 G0, ne = 0.528 ± 0.009 cm−3, and T = 73 ± 48 K in the diffuse medium in front of BD+31°643, where the error on G0 comes largely from the error on T.
4.5 The interstellar radiation affecting the LOS toward BD+31°643
Iglesias-Groth (2019) were using an ISRF of 45 G0. They estimated this strength to be representative for the Perseus cloud following a study by Sun et al. (2008). We remark that Iglesias-Groth (2019) took into account a field strength expressed in units of the Draine field while using a formula that Berné et al. (2017) wrote for values in units of the Habing field. In doing so, Iglesias-Groth (2019) underestimated the ISRF strength by a factor of 1.7, and hence they overestimated the column density of the ISRF-excited species by the same factor. Though minor, the consequence of this confusion is not negligible.
The star BD+31°643 generates a FUV field intensity of 40 χ0 at a distance of 0.37 pc (Sun et al. 2008), which is the optical radius of IC 348 (Herbig 1998). Sun et al. (2008), however, argued that the analysis of FIR emission measurements gave a more reliable estimate. They found the FUV intensity near the position of BD+31°643 in the IC 348 cluster to be 84 χ0, which is equivalent to 143 G0 (see Fig. 6 and Table 3 in Sun et al. 2008). In the same study, the fitting of a PDR model to intensity ratios of atomic and molecular lines observed in IC 348 resulted in 98 χ0, which is in agreement with the previous estimate. Moreover, exploiting more extended FIR emission measurements, Luo et al. (2023) determined an FUV intensity of 100 ± 14 χ0 (or 170 ± 24 G0) over a 0.6° × 0.6° (36′ × 36′) area that encompasses IC 348. Taking spatial dimensions into account, Luo et al. (2023) found the FUV intensity to be about twice as large as that derived by Sun et al. (2008). Thus, the FUV intensity near BD+31°643 is on the order of 100 χ0 or 170 G0. This intensity is larger than expected from the characteristics of BD+31°643 alone because other stars contribute to the ISRF in the region.
We estimated the ISRF in the molecular cloud material populated by DIB carriers on the LOS toward BD+31°643 using our measurements of DIBs 5797Å and 5780Å in Sect. 3 and by taking into account the trend that the ratio of their equivalent widths follows as a function of the ISRF intensity. Vos et al. (2011) observed this dependence for Upper Scorpius, a subgroup of the Sco OB2 association, and Lai et al. (2020) discussed its nature and the conditions for its validity, which they argued would be limited to regions of relatively low densities, n(H2) = (5 ± 2) × 104 cm−3 being considered high. As n(H2) = (12 ± 0.2) × 102 cm−3 in front of IC 348 (Velusamy et al. 2017), we assumed that the DIB carriers on the LOS were in a region of relatively low density. We found W(DIB, 5797 Å)/W(DIB, 5780 Å) equal to 0.31, in agreement with three other studies out of four (see Table 5 and its notes). Consequently, the ISRF intensity would be in the range of 1–20 χ0 (Fig. 21 in Vos et al. 2011), which is equivalent to 1.7–34 G0, in the DIB carrier-containing cloud in front of BD+31°643, more than four times attenuated from 100 ± 14 χ0 (170 ± 24 G0) at the (front) optical border of IC 348.
Another approach gave us an intensity of the ISRF at the location of the DIB carriers in front of BD+31°643 that is consistent with the 1.7–34 G0 range proposed above. We used
![Mathematical equation: $\[n_{\mathrm{e}}=\frac{\Gamma}{\alpha} \frac{N(\mathrm{Ca})}{N\left(\mathrm{Ca}^{+}\right)},\]$](/articles/aa/full_html/2026/05/aa53682-25/aa53682-25-eq42.png) (5)
(5)
where ne is the electron density; N(Ca) and N(Ca+) are the column densities of the Ca atoms and Ca+ ions, respectively; Γ represents the photoionization rate for Ca atoms; and α denotes the electron recombination rate constant for Ca+ ions (Federman & Hobbs 1983). The intensity of the ISRF may thus be inferred by determining Γ from Eq. (5).
The density of C+ ions is a proxy for ne. Velusamy et al. (2017) evaluated the fractional abundance of C+ with respect to H2 to be generally 4.4 × 10⁻⁴ in interstellar diffuse and translucent clouds, and the density of molecular hydrogen n(H2) to be (12 ± 0.2) × 102 cm−3 in the molecular gas toward BD+31°643. This leads to a density of C+ ions, and consequently of electrons, of 0.528 ± 0.009 cm−3 in this cloud. The value is an order of magnitude higher than the electron density in typical diffuse cloud conditions, and Velusamy et al. (2017) attributed the remarkably high density of C+ ions to the proximity of the target star.
We estimated N(Ca)/N(Ca+) using the Ca I and Ca II K lines measured toward BD+31°643. Figure 8 shows Gaussian profiles fitted to the lines. The fitted Gaussian profiles gave equivalent widths of 4.3 ± 0.5 mÅ for the Ca I line and 93 ± 2 mÅ for the Ca II K line. We used oscillator strengths of 1.75 for the Ca I line and 0.68 for the Ca II K line (Smith & Liszt 1971) and obtained a value of 0.016 ± 0.002 for N(Ca)/N(Ca+).
The electron recombination rate, α, is a function of T following
![Mathematical equation: $\[\alpha(T)=\alpha_{100}\left(\frac{T}{100}\right)^{-\eta},\]$](/articles/aa/full_html/2026/05/aa53682-25/aa53682-25-eq43.png) (6)
(6)
with α100 = 27.9 × 10⁻¹² cm3 s−1 and η = 0.647 (Péquignot & Aldrovandi 1986). Adopting the temperature of the molecular gas in front of BD+31°643 of 73 ± 48 K (Rachford et al. 2002), α is within the (24.66–68.41) × 10−12 cm3 s−1 range.
We conclude Γ to be (7.1–26.2) × 10−10 s−1. As Γ is 4.3 × 10⁻¹⁰ s−1 for an ISRF intensity of 1 χ0 (with an uncertainty factor less than 1.3; Péquignot & Aldrovandi 1986), the ISRF intensity in the diffuse cloud in front of BD+31°643 is 1.65–6.1 χ0 or 2.8–10.4 G0. This range is consistent with the 1.7–34 G0 interval inferred above from the value of W(DIB, 5797 Å)/W(DIB, 5780 Å).
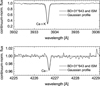 |
Fig. 8 Interstellar atomic lines in the continuum-normalized flux spectrum toward BD+31°643 (black curve). The top and bottom panels show the Ca II K and Ca I lines, respectively. Gaussian profiles fitted to the lines provide us with a measurement of their equivalent widths (thick gray curves). |
5 Conclusions
We present new spectra of eight reddened LOSs obtained with the PEPSI spectrometer at the LBT. We infer upper limits uN(0) for the column density of C60 fullerene of a few 1013 cm−2. The upper limits derived here are similar to those obtained in our previous study (Paper 1) in spite of the significantly higher S/N in our new spectra, mainly because of the larger pixel dispersion that characterizes them. Toward BD+31°643, we determine uN(0) to be (14 ± 11) × 1012 cm−2, a value that is not compatible with a column density of N(0) = 2 × 1014 cm−2 for C60 inferred by Iglesias-Groth (2019) from their analysis of IR emission data. The discrepancy suggests that either the adopted value of oscillator strength of the γ0 band is too large, that the molecular material that gives rise to the C60 emission is not fully sampled in absorption along the LOS toward the star, or that the IR emission assigned to C60 arises from molecules bound in dust grains. Two populations may comprise these grains: one that consists of large grains inside IC 348, and one of small grains outside the cluster, albeit close to its border where the ISRF is still strong. The processing of the grains by the ISRF and possibly shock waves may not release a visible quantity of C60 molecules in the gas phase of the cluster, nor may it produce any detectable amount of ![Mathematical equation: $\[\mathrm{C}_{60}^{+}\]$](/articles/aa/full_html/2026/05/aa53682-25/aa53682-25-eq44.png) . The present study underscores once more the need for a more accurate description of the vibronic bands of neutral C60 in the gas phase at low temperatures.
. The present study underscores once more the need for a more accurate description of the vibronic bands of neutral C60 in the gas phase at low temperatures.
Data availability
The normalized spectra reduced to the BSR are available at the CDS via https://cdsarc.cds.unistra.fr/viz-bin/cat/J/A+A/709/A104
Acknowledgements
The authors are grateful to the Max Planck Institute for Astronomy for granting them observation time at the Large Binocular Telescope (LBT) in Arizona under program MPIA-2021B-011. We acknowledge the use of the SIMBAD database and the VizieR service of the CDS (Centre de Données astronomiques de Strasbourg), Strasbourg, France. This work exploit data acquired with the Potsdam Echelle Polarimetric and Spectroscopic Instrument (PEPSI) at the LBT. The LBT is an international collaboration among institutions in the United States, Italy and Germany. LBT Corporation partners are: LBT Beteiligungsgesellschaft, Germany, representing the Max-Planck Society, The Leibniz Institute for Astrophysics Potsdam, and Heidelberg University; The University of Arizona on behalf of the Arizona Board of Regents; Istituto Nazionale di Astrofisica, Italy; The Ohio State University, representing OSU, University of Notre Dame, University of Minnesota and University of Virginia. The use of data collected at the European Southern Observatory under ESO program 266.D-5655 (data set ADP.2021-08-29T17_10_15.141.fits) is acknowledged. The authors thank the anonymous referee whose comments helped them to greatly improve this manuscript.
References
- Abbink, D., Foing, B., & Ehrenfreund, P. 2024, A&A, 684, A165 [NASA ADS] [CrossRef] [EDP Sciences] [Google Scholar]
- Arce, H. G., Borkin, M. A., Goodman, A. A., Pineda, J. E., & Beaumont, C. N. 2011, ApJ, 742, 105 [NASA ADS] [CrossRef] [Google Scholar]
- Bakes, E. L. O., & Tielens, A. G. G. M. 1995, in Astrophysics and Space Science Library, 202, The Diffuse Interstellar Bands, eds. A. G. G. M. Tielens, & T. P. Snow (Dordrecht: Springer), 315 [Google Scholar]
- Berné, O., Mulas, G., & Joblin, C. 2013, A&A, 550, L4 [NASA ADS] [CrossRef] [EDP Sciences] [Google Scholar]
- Berné, O., Cox, N. L. J., Mulas, G., & Joblin, C. 2017, A&A, 605, L1 [NASA ADS] [CrossRef] [EDP Sciences] [Google Scholar]
- Brieva, A. C., Gredel, R., Jäger, C., Huisken, F., & Henning, T. 2016, ApJ, 826, 122 [NASA ADS] [CrossRef] [Google Scholar]
- Cami, J., Peeters, E., Bernard-Salas, J., Doppmann, G., & De Buizer, J. 2018, Galax, 6, 101 [Google Scholar]
- Campbell, E. K., Holz, M., Gerlich, D., & Maier, J. P. 2015, Natur, 523, 322 [Google Scholar]
- Campbell, E. K., Holz, M., & Maier, J. P. 2016a, ApJ, 826, L4 [Google Scholar]
- Campbell, E. K., Holz, M., Maier, J. P., et al. 2016b, ApJ, 822, 17 [Google Scholar]
- Cardelli, J. A., Clayton, G. C., & Mathis, J. S. 1989, ApJ, 345, 245 [Google Scholar]
- Close, J. D., Federmann, F., Hoffmann, K., & Quaas, N. 1997, CPL, 276, 393 [Google Scholar]
- Cordiner, M. A., Linnartz, H., , et al. 2019, ApJ, 875, L28 [NASA ADS] [CrossRef] [Google Scholar]
- Cox, N. L. J., Cami, J., Kaper, L., et al. 2014, A&A, 569, A117 [NASA ADS] [CrossRef] [EDP Sciences] [Google Scholar]
- Désert, F.-X., Jenniskens, P., & Dennefeld, M. 1995, A&A, 303, 223 [Google Scholar]
- Draine, B. T., Dale, D. A., Bendo, G., et al. 2007, ApJ, 663, 866 [NASA ADS] [CrossRef] [Google Scholar]
- Fan, H., Welty, D. E., York, D. G., et al. 2017, ApJ, 850, 194 [NASA ADS] [CrossRef] [Google Scholar]
- Fan, H., Hobbs, L. M., Dahlstrom, J. A., et al. 2019, ApJ, 878, 151 [NASA ADS] [CrossRef] [Google Scholar]
- Federman, S. R., & Hobbs, L. M. 1983, ApJ, 265, 813 [Google Scholar]
- Foing, B. H., & Ehrenfreund, P. 1994, Natur, 369, 296 [Google Scholar]
- Foing, B. H., & Ehrenfreund, P. 1997, A&A, 319, L59 [Google Scholar]
- Friedman, S. D., York, D. G., McCall, B. J., et al. 2011, ApJ, 727, 33 [NASA ADS] [CrossRef] [Google Scholar]
- Galazutdinov, G., Lee, B.-C., Song, I.-O., Kazmierczak, M., & Krełowski, J. 2011, MNRAS, 412, 1259 [Google Scholar]
- Galazutdinov, G. A., & Krełowski, J. 2017, AcA, 67, 159 [Google Scholar]
- Galazutdinov, G. A., Krełowski, J., Musaev, F. A., Ehrenfreund, P., & Foing, B. H. 2000, MNRAS, 317, 750 [NASA ADS] [CrossRef] [Google Scholar]
- Galazutdinov, G. A., Manicò, G., Pirronello, V., & Krełowski, J. 2004, MNRAS, 355, 169 [NASA ADS] [CrossRef] [Google Scholar]
- Galazutdinov, G. A., Shimansky, V. V., Bondar, A., Valyavin, G., & Krełowski, J. 2017, MNRAS, 465, 3956 [Google Scholar]
- Galazutdinov, G. A., Valyavin, G., Ikhsanov, N. R., & Krełowski, J. 2021, AJ, 161, 127 [NASA ADS] [CrossRef] [Google Scholar]
- Habing, H. J. 1968, BAN, 19, 421 [NASA ADS] [Google Scholar]
- Hamano, S., Kobayashi, N., Kondo, S., et al. 2016, ApJ, 821, 42 [Google Scholar]
- Herbig, G. H. 1998, ApJ, 497, 736 [NASA ADS] [CrossRef] [Google Scholar]
- Hobbs, L. M., York, D. G., Thorburn, J. A., et al. 2009, ApJ, 705, 32 [Google Scholar]
- Hollenbach, D. J., & Tielens, A. G. G. M. 1999, RvMP, 71, 173 [NASA ADS] [Google Scholar]
- Hora, J., Pánek, P., Navrátil, K., et al. 1996, PhRvB, 54, 1478 [Google Scholar]
- Hung, W.-C., Ho, C.-D., Liu, C.-P., & Lee, Y.-P. 1996, JPhCh, 100, 3927 [Google Scholar]
- Iglesias-Groth, S. 2019, MNRAS, 489, 1509 [NASA ADS] [Google Scholar]
- Isobe, S., Sasaki, G., Norimoto, Y., & Takahashi, J. 1986, PASJ, 38, 511 [NASA ADS] [Google Scholar]
- Jenkins, E. B., Drake, J. F., Morton, D. C., et al. 1973, ApJ, 181, L122 [Google Scholar]
- Knauth, D. C., Taylor, C. J., Ritchey, A. M., Federman, S. R., & Lambert, D. L. 2017, ApJ, 835, L16 [Google Scholar]
- Kramida, A., Ralchenko, Y., Reader, J., & NIST ASD Team. 2021, NIST Atomic Spectra Database [Google Scholar]
- Krełowski, J., & Westerlund, B. E. 1988, A&A, 190, 339 [NASA ADS] [Google Scholar]
- Krełowski, J., Galazutdinov, G. A., Mulas, G., Maszewska, M., & Cecchi-Pestellini, C. 2015, MNRAS, 451, 3210 [Google Scholar]
- Lai, T. S.-Y., Witt, A. N., Alvarez, C., & Cami, J. 2020, MNRAS, 492, 5853 [Google Scholar]
- Lawton, B., Churchill, C. W., York, B. A., et al. 2008, AJ, 136, 994 [NASA ADS] [CrossRef] [Google Scholar]
- Leitherer, C., Hefele, H., Stahl, O., & Wolf, B. 1982, A&A, 108, 102 [NASA ADS] [Google Scholar]
- Luo, G., Zhang, Z.-Y., Bisbas, T. G., et al. 2023, ApJ, 942, 101 [NASA ADS] [CrossRef] [Google Scholar]
- Massa, D., Savage, B. D., & Fitzpatrick, E. L. 1983, ApJ, 266, 662 [NASA ADS] [CrossRef] [Google Scholar]
- Misawa, T., Gandhi, P., Hida, A., Tamagawa, T., & Yamaguchi, T. 2009, ApJ, 700, 1988 [Google Scholar]
- Nie, T. P., Xiang, F. Y., & Li, A. 2022, MNRAS, 509, 4908 [Google Scholar]
- Olofsson, G., Nilsson, R., Florén, H.-G., Djupvik, A., & Aberasturi, M. 2012, A&A, 544, A43 [NASA ADS] [CrossRef] [EDP Sciences] [Google Scholar]
- Péquignot, D., & Aldrovandi, S. M. V. 1986, A&A, 161, 169 [NASA ADS] [Google Scholar]
- Rachford, B. L., Snow, T. P., Tumlinson, J., et al. 2002, ApJ, 577, 221 [Google Scholar]
- Racine, R. 1968, AJ, 73, 233 [CrossRef] [Google Scholar]
- Rapacioli, M., Joblin, C., & Boissel, P. 2005, A&A, 429, 193 [NASA ADS] [CrossRef] [EDP Sciences] [Google Scholar]
- Reber, C., Yee, L., McKiernan, J., et al. 1991, JPhCh, 95, 2127 [Google Scholar]
- Rouillé, G., Krasnokutski, S. A., & Carpentier, Y. 2021, A&A, 656, A100 [NASA ADS] [CrossRef] [EDP Sciences] [Google Scholar]
- Sassara, A., Zerza, G., & Chergui, M. 1996, JPhB, 29, 4997 [Google Scholar]
- Sassara, A., Zerza, G., Chergui, M., Negri, F., & Orlandi, G. 1997, JChPh, 107, 8731 [Google Scholar]
- Schlarmann, L., Foing, B., Cami, J., & Fan, H. 2021, A&A, 656, L17 [NASA ADS] [CrossRef] [EDP Sciences] [Google Scholar]
- Scholz, R.-D., Brunzendorf, J., Ivanov, G., et al. 1999, A&AS, 137, 305 [NASA ADS] [CrossRef] [EDP Sciences] [Google Scholar]
- Seiler, F. A. 1987, Risk Anal., 7, 509 [Google Scholar]
- Sellgren, K., Werner, M. W., Ingalls, J. G., et al. 2010, ApJ, 722, L54 [NASA ADS] [CrossRef] [Google Scholar]
- Sidhu, A., Tielens, A. G. G. M., Peeters, E., & Cami, J. 2023, MNRAS, 522, 3227 [Google Scholar]
- Siebenmorgen, R., Krełowski, J., Smoker, J., Galazutdinov, G., & Bagnulo, S. 2020, A&A, 641, A35 [NASA ADS] [CrossRef] [EDP Sciences] [Google Scholar]
- Siebenmorgen, R., Smoker, J., Krełowski, J., Gordon, K., & Chini, R. 2023, A&A, 676, A132 [NASA ADS] [CrossRef] [EDP Sciences] [Google Scholar]
- Smith, W. H., & Liszt, H. S. 1971, JOSA, 61, 938 [Google Scholar]
- Smoker, J. V., Müller, A., Monreal Ibero, A., et al. 2023, A&A, 672, A181 [NASA ADS] [CrossRef] [EDP Sciences] [Google Scholar]
- Snow, T. P. 1993, ApJ, 402, L73 [Google Scholar]
- Snow, T. P., Hanson, M. M., Seab, C. G., & Saken, J. M. 1994, ApJ, 420, 632 [Google Scholar]
- Sonnentrucker, P., Cami, J., Ehrenfreund, P., & Foing, B. H. 1997, A&A, 327, 1215 [NASA ADS] [Google Scholar]
- Sonnentrucker, P., York, B., Hobbs, L. M., et al. 2018, ApJS, 237, 40 [NASA ADS] [CrossRef] [Google Scholar]
- Stoehr, F., White, R., Smith, M., et al. 2008, ASP Conf. Ser., 394, 505 [NASA ADS] [Google Scholar]
- Strassmeier, K. G., Ilyin, I., Järvinen, A., et al. 2015, Astron. Nachr., 336, 324 [NASA ADS] [CrossRef] [Google Scholar]
- Strassmeier, K. G., Ilyin, I., & Steffen, M. 2018, A&A, 612, A44 [NASA ADS] [CrossRef] [EDP Sciences] [Google Scholar]
- Sun, K., Ossenkopf, V., Kramer, C., et al. 2008, A&A, 489, 207 [NASA ADS] [CrossRef] [EDP Sciences] [Google Scholar]
- Thorburn, J. A., Hobbs, L. M., McCall, B. J., et al. 2003, ApJ, 584, 339 [Google Scholar]
- Tibbs, C. T., Watson, R. A., Dickinson, C., et al. 2010, MNRAS, 402, 1969 [NASA ADS] [CrossRef] [Google Scholar]
- Tibbs, C. T., Flagey, N., Paladini, R., et al. 2011, MNRAS, 418, 1889 [NASA ADS] [CrossRef] [Google Scholar]
- Valencic, L. A., Clayton, G. C., & Gordon, K. D. 2004, ApJ, 616, 912 [NASA ADS] [CrossRef] [Google Scholar]
- Vassallo, A. M., Pang, L. S. K., Cole-Clarke, P. A., & Wilson, M. A. 1991, JAChS, 113, 7820 [Google Scholar]
- Velusamy, T., Langer, W. D., Goldsmith, P. F., & Pineda, J. L. 2017, ApJ, 838, 165 [Google Scholar]
- Viggiano, A. A., Friedman, J. F., Shuman, N. S., et al. 2010, JChPh, 132, 194307 [Google Scholar]
- Vos, D. A. I., Cox, N. L. J., Kaper, L., Spaans, M., & Ehrenfreund, P. 2011, A&A, 533, A129 [NASA ADS] [CrossRef] [EDP Sciences] [Google Scholar]
- Wakabayashi, T., Suzuki, H., Hatanaka, M., Wakabayashi, H., & Kodama, T. 2024, PhRvB, 109, 035409 [Google Scholar]
- Walker, G. A. H., Bohlender, D. A., Maier, J. P., & Campbell, E. K. 2015, ApJ, 812, L8 [NASA ADS] [CrossRef] [Google Scholar]
- Walker, G. A. H., Campbell, E. K., Maier, J. P., Bohlender, D., & Malo, L. 2016, ApJ, 831, 130 [CrossRef] [Google Scholar]
- Walker, G. A. H., Campbell, E. K., Maier, J. P., & Bohlender, D. 2017, ApJ, 843, 56 [NASA ADS] [CrossRef] [Google Scholar]
- Wang, Y., Holden, J. M., Rao, A. M., et al. 1995, PhRvB, 51, 4547 [Google Scholar]
- Zdanavičius, J., Straižys, V., & Corbally, C. J. 2002, A&A, 392, 295 [NASA ADS] [CrossRef] [EDP Sciences] [Google Scholar]
Appendix A Wavelengths and standards of rest
We initially reduced the stellar spectra to the barycentric standard of rest (BSR). Then, in order to search for the γ0 absorption band of C60, we looked for a pertinent standard of rest. While the abundance of several DIB carriers correlates with the atomic fraction of hydrogen (for instance, Fan et al. 2017), the abundance of ![Mathematical equation: $\[\mathrm{C}_{60}^{+}\]$](/articles/aa/full_html/2026/05/aa53682-25/aa53682-25-eq45.png) does not follow this trend. Schlarmann et al. (2021) concluded that, unlike other DIB carriers,
does not follow this trend. Schlarmann et al. (2021) concluded that, unlike other DIB carriers, ![Mathematical equation: $\[\mathrm{C}_{60}^{+}\]$](/articles/aa/full_html/2026/05/aa53682-25/aa53682-25-eq46.png) ions exist inside the outer edges of clouds, where the molecular fraction dominates. Deeper in the clouds, their abundance decreases, perhaps partly because of their conversion to C60 by electron recombination. We thus used velocities of interstellar diatomic species CN, CH, and CH+, assembled in Table A.1, as references for rest, except in the case of HD 37022 as explained below. When molecular lines appeared with multiple velocity components, we chose one of them for each line of every species, consistently corresponding to the same velocity, to serve for calculating its average value.
ions exist inside the outer edges of clouds, where the molecular fraction dominates. Deeper in the clouds, their abundance decreases, perhaps partly because of their conversion to C60 by electron recombination. We thus used velocities of interstellar diatomic species CN, CH, and CH+, assembled in Table A.1, as references for rest, except in the case of HD 37022 as explained below. When molecular lines appeared with multiple velocity components, we chose one of them for each line of every species, consistently corresponding to the same velocity, to serve for calculating its average value.
Figure A.1 shows the molecular and atomic lines detected toward BD+31°643. Concerning CH, only the 3886.41 Å line is visible, albeit not conclusively owing to the low S/N. The lines of the diatomic species as well as those of atomic species, namely, the Ca I 4226.73 Å, Ca II K, and Ca II H lines, show a single velocity component. We note that the atomic lines are 20%−50% broader than the molecular lines, the FWHMs of these corresponding to the resolution.
We applied a similar procedure for the other LOSs that featured molecular absorption lines. The exception is HD 37022 where only atomic absorption lines appeared. For that star we used atomic lines, specifically Na I D1 and D2, and also Ca II K. Figure A.2 shows that the lines exhibit three to four velocity components whereas Krełowski et al. (2015) identified five in Na I D2 and Ca II K by using a resolving power of 115 000. In order to calibrate the wavelength scale, we arbitrarily chose as references the strongest velocity component of Na I D1 and D2 and the corresponding component of Ca II K. Table A.2 gives the radial velocities of all components of the atomic lines in the BSR frame and the mean velocity of the selected reference is in Table A.1.
As in Paper 1, our choice of molecular lines as references for rest causes a shift of 0.3 Å between the positions of the DIBs in our spectra and the positions determined by Hobbs et al. (2009) with their observation of HD 183143 (see Fig. 1). The explanation is that Hobbs et al. found that the K I lines toward the star showed two velocity components separated by 14.9 km s−1, equivalent to 0.3 Å at 6000 Å, and they chose the strongest component of the 7698 Å K I line to serve as reference for rest. Our choice of molecular lines, some exhibiting a single velocity component, is equivalent to opting for the weakest velocity components of the 7698 Å K I line, hence the shift of 0.3 Å.
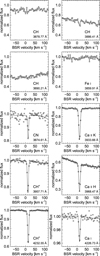 |
Fig. A.1 Atomic and molecular lines on the LOS toward BD+31°643. Each panel shows the measured normalized flux (open square symbols) and the fitted flux that consists of a continuum and the line (solid black curve), or a visual rendering of the spectrum (straight gray segments between symbols). Each panel is labeled with the identifier of the line and the rest wavelength. |
Radial velocities from molecular lines.
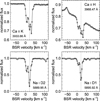 |
Fig. A.2 Atomic lines on the LOS toward HD 37022. Each panel shows the measured normalized flux (open square symbols) and the fitted flux (solid curve) that consists of a continuum and the atomic lines. A vertical dotted line indicates the velocity component serving as reference for rest. Each panel is labeled with the identifier of the atomic line and the rest wavelength. |
Radial velocities from atomic lines toward HD 37022.
Appendix B Measured spectra
The full spectra obtained here are shown in Figure B.1.
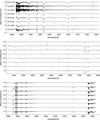 |
Fig. B.1 Normalized flux spectra measured toward eight background stars with PEPSI (Strassmeier et al. 2015) at the LBT. The spectra are labeled with star identifiers in the top panel and the vertical order of the spectra is the same in the three panels. For clarity, the spectra are vertically offset with increments of 1 in the top panel and 0.5 in the other two. |
We used G0 as a symbol for the strength of the Habing ISRF (Habing 1968), not to be confused with the unattenuated field strength variable G0, where 1 G0 represents an energy flux of 1.6 × 10⁻³ erg cm−2 s−1 (Hollenbach & Tielens 1999) or an energy density of 5.288 × 10⁻¹⁴ erg cm−3 (Draine et al. 2007).
We used χ0 to designate 1 unit of the Draine field that is equivalent to 1.7 G0 (Hollenbach & Tielens 1999).
All Tables
Upper limits for as uN(0)/N(+) from the comparison of the γ0 band of C60 with DIB 9577Å and DIB 9632Å.
All Figures
|
Fig. 1 Continuum-normalized flux spectra of the eight LOSs in the program. Each panel and the spectrum it presents are labeled with the identifier of the target star. The position of the γ0 band of C60 is indicated through all panels (vertical dotted line). Positions of DIBs given by Hobbs et al. (2009) are indicated in the bottom panel by short vertical lines. |
| In the text | |
|
Fig. 2 Continuum-normalized flux spectra of the eight LOSs. Each panel and the spectrum it presents are labeled with the identifier of the target star. The positions of the A0 and A1 bands of C60 – respectively 4024 and 3980 Å – are indicated through all panels (vertical dotted lines). See Paper 1 for the detailed assignment. |
| In the text | |
|
Fig. 3 Continuum-normalized flux spectra toward HD 183143 (black line) and β Ori (gray line). The spectrum toward β Ori (European Southern Observatory) is vertically offset and its wavelength scale is corrected for convenient comparison. The vertical dotted line indicates the position of the A0 band of C60 at 4024 Å. Straight lines point to He I lines identified by their laboratory rest wavelengths (Kramida et al. 2021). |
| In the text | |
|
Fig. 4 Equivalent-width detection threshold of C60 in the 6070 Å region for the eight LOSs in the program. Each panel and the spectrum it presents are labeled with the identifier of the target star. The position of the γ0 band of C60 is indicated through all panels (vertical dotted line). In all panels, a zero threshold is drawn to serve as a guide to the eye (horizontal dashed line). Positions of DIBs according to Hobbs et al. (2009) are indicated in the bottom panel (short vertical lines). |
| In the text | |
|
Fig. 5 Diffuse interstellar bands 5780Å and 5797Å. Each panel and the spectrum it presents are labeled with the identifier of the target star. |
| In the text | |
|
Fig. 6 Continuum-normalized flux spectrum of BD+31°643 (black curve). A synthetic γ0 band of free, cold C60 molecules with a column density of 2 × 1014 cm−2 (Iglesias-Groth 2019) is displayed for comparison (thick gray curve, vertically offset for clarity). |
| In the text | |
|
Fig. 7 Continuum-normalized flux spectrum of BD+31°643 (black curve). Synthetic A0 and A1 bands of free, cold C60 molecules with a column density of 2 × 1014 cm−2 (Iglesias-Groth 2019) are displayed for comparison (thick gray curve, vertically offset for clarity). |
| In the text | |
|
Fig. 8 Interstellar atomic lines in the continuum-normalized flux spectrum toward BD+31°643 (black curve). The top and bottom panels show the Ca II K and Ca I lines, respectively. Gaussian profiles fitted to the lines provide us with a measurement of their equivalent widths (thick gray curves). |
| In the text | |
|
Fig. A.1 Atomic and molecular lines on the LOS toward BD+31°643. Each panel shows the measured normalized flux (open square symbols) and the fitted flux that consists of a continuum and the line (solid black curve), or a visual rendering of the spectrum (straight gray segments between symbols). Each panel is labeled with the identifier of the line and the rest wavelength. |
| In the text | |
|
Fig. A.2 Atomic lines on the LOS toward HD 37022. Each panel shows the measured normalized flux (open square symbols) and the fitted flux (solid curve) that consists of a continuum and the atomic lines. A vertical dotted line indicates the velocity component serving as reference for rest. Each panel is labeled with the identifier of the atomic line and the rest wavelength. |
| In the text | |
|
Fig. B.1 Normalized flux spectra measured toward eight background stars with PEPSI (Strassmeier et al. 2015) at the LBT. The spectra are labeled with star identifiers in the top panel and the vertical order of the spectra is the same in the three panels. For clarity, the spectra are vertically offset with increments of 1 in the top panel and 0.5 in the other two. |
| In the text | |
Current usage metrics show cumulative count of Article Views (full-text article views including HTML views, PDF and ePub downloads, according to the available data) and Abstracts Views on Vision4Press platform.
Data correspond to usage on the plateform after 2015. The current usage metrics is available 48-96 hours after online publication and is updated daily on week days.
Initial download of the metrics may take a while.