Open Access
Fig. 2
Download original image
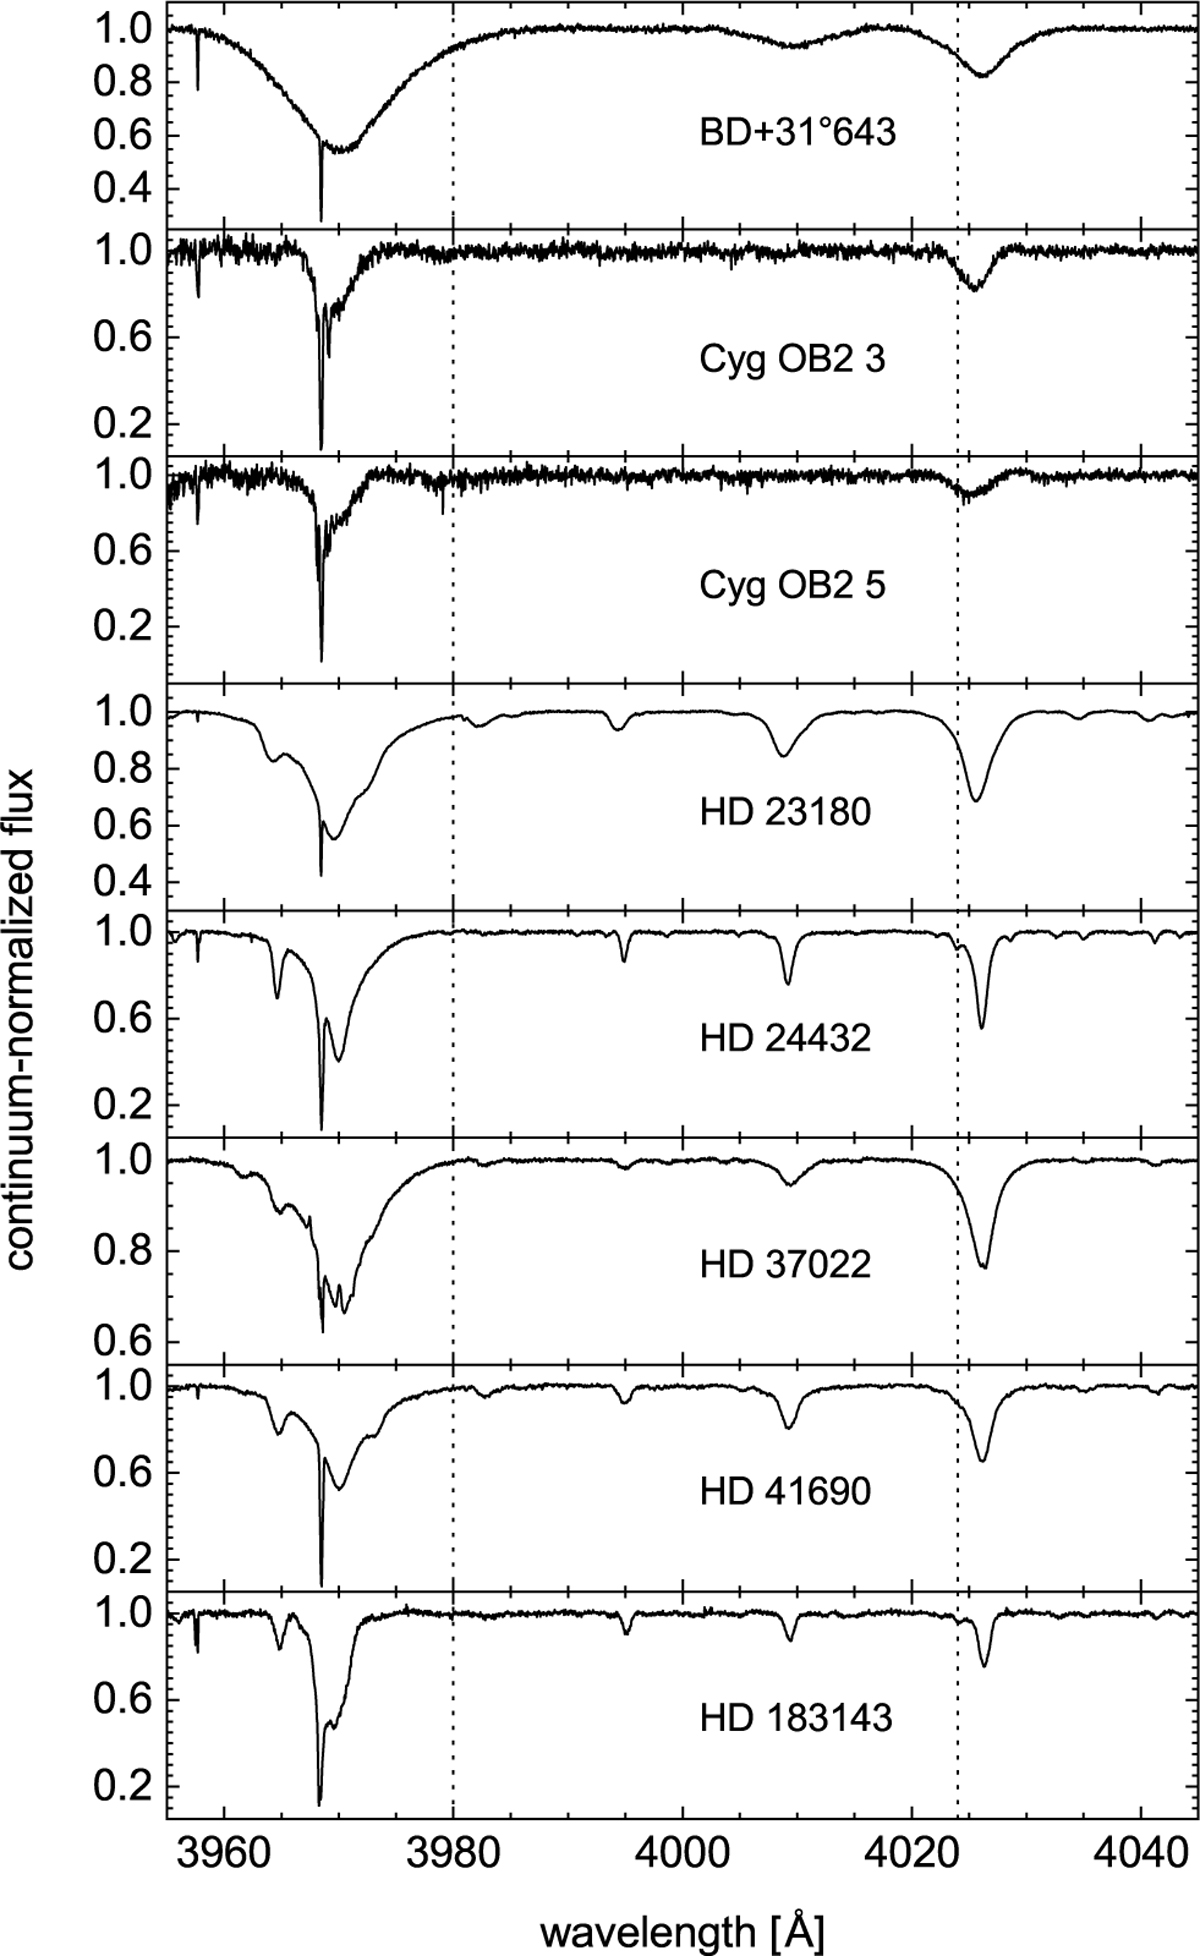
Continuum-normalized flux spectra of the eight LOSs. Each panel and the spectrum it presents are labeled with the identifier of the target star. The positions of the A0 and A1 bands of C60 – respectively 4024 and 3980 Å – are indicated through all panels (vertical dotted lines). See Paper 1 for the detailed assignment.
Current usage metrics show cumulative count of Article Views (full-text article views including HTML views, PDF and ePub downloads, according to the available data) and Abstracts Views on Vision4Press platform.
Data correspond to usage on the plateform after 2015. The current usage metrics is available 48-96 hours after online publication and is updated daily on week days.
Initial download of the metrics may take a while.