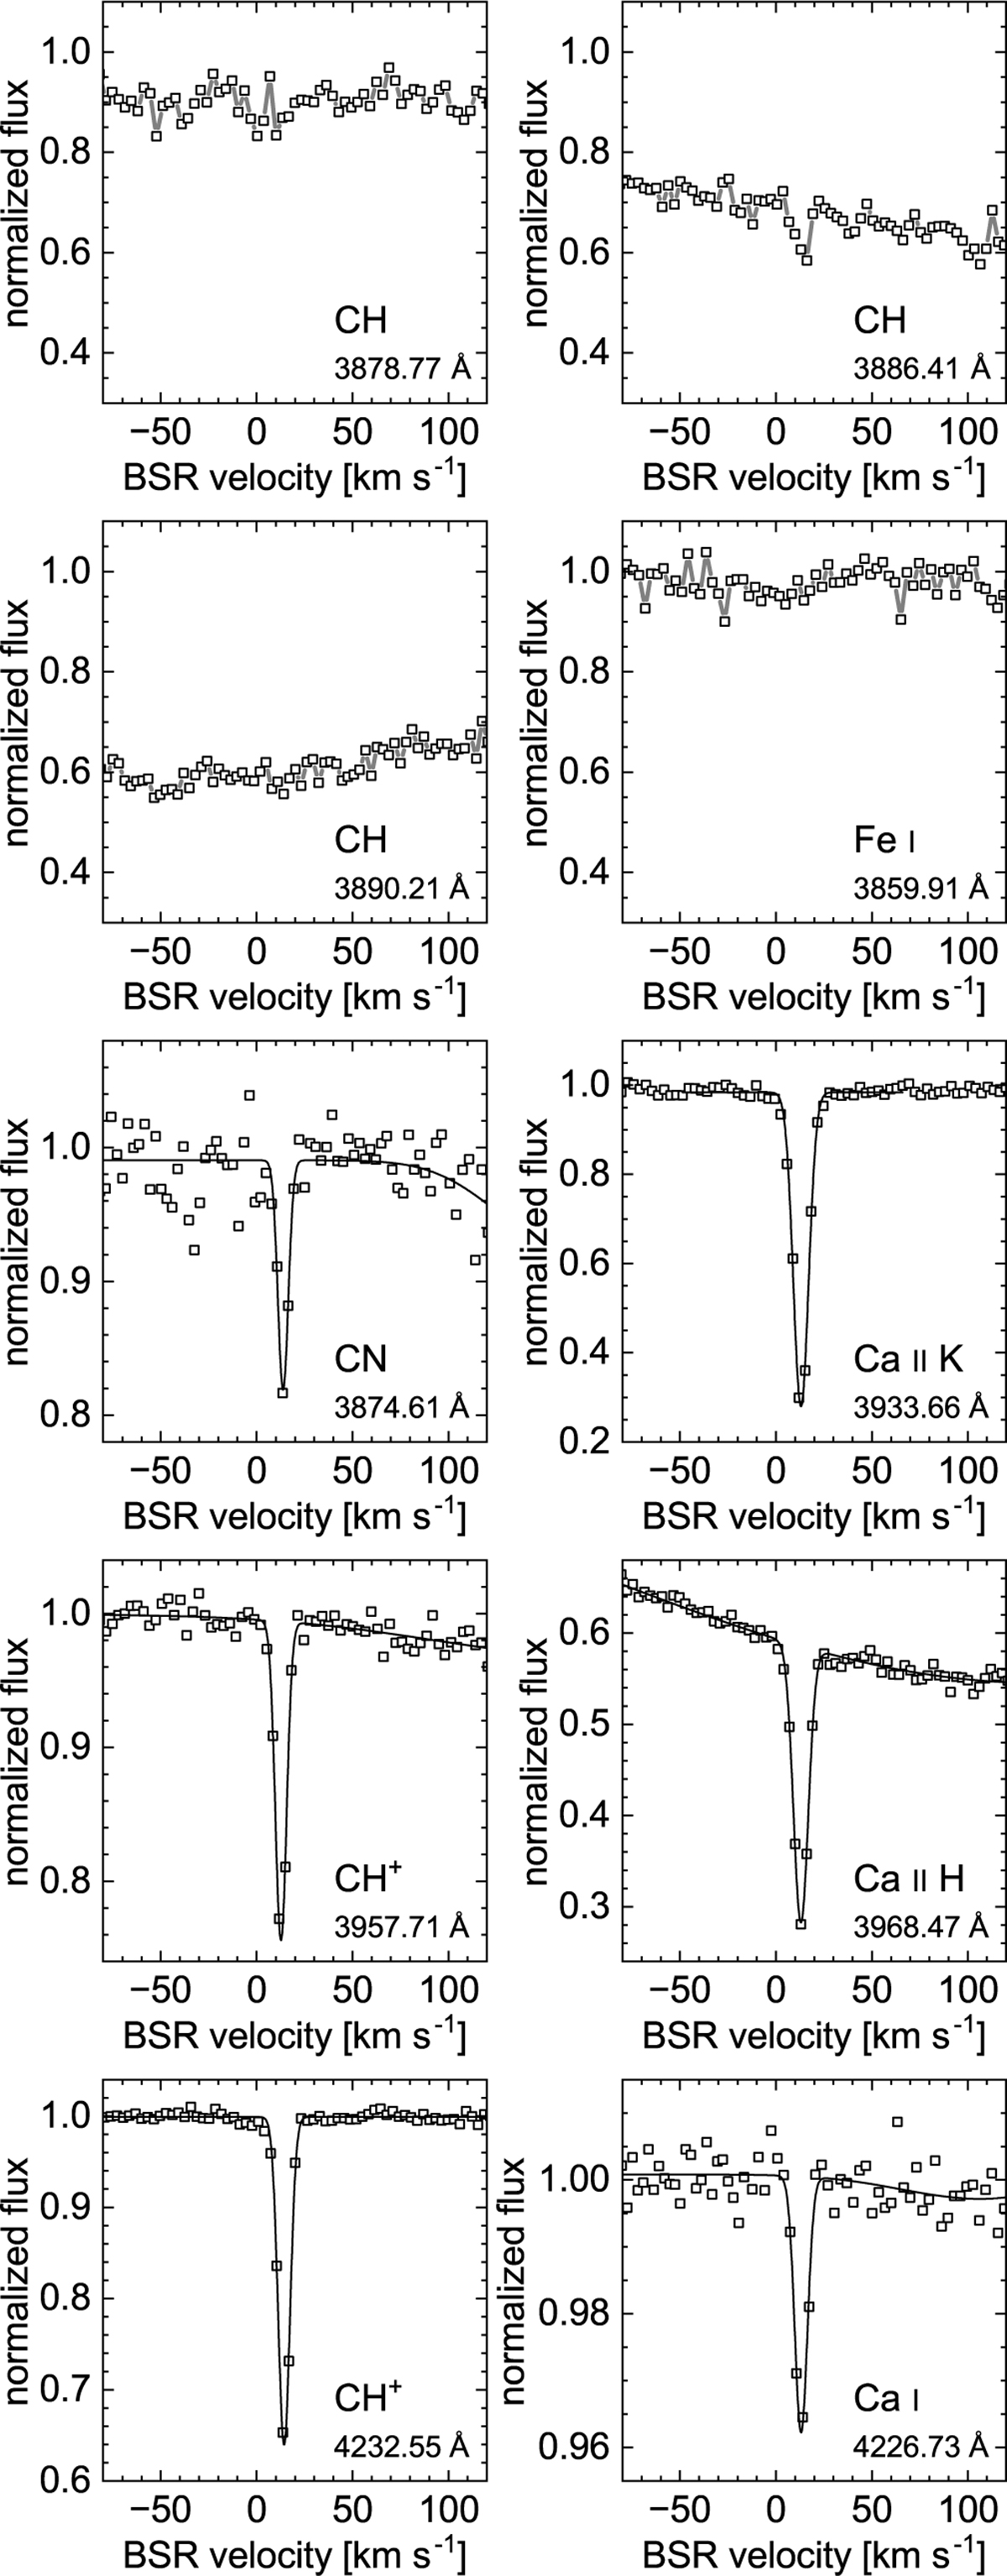
Fig. A.1
Download original image
Atomic and molecular lines on the LOS toward BD+31°643. Each panel shows the measured normalized flux (open square symbols) and the fitted flux that consists of a continuum and the line (solid black curve), or a visual rendering of the spectrum (straight gray segments between symbols). Each panel is labeled with the identifier of the line and the rest wavelength.
Current usage metrics show cumulative count of Article Views (full-text article views including HTML views, PDF and ePub downloads, according to the available data) and Abstracts Views on Vision4Press platform.
Data correspond to usage on the plateform after 2015. The current usage metrics is available 48-96 hours after online publication and is updated daily on week days.
Initial download of the metrics may take a while.