Open Access
Fig. 6
Download original image
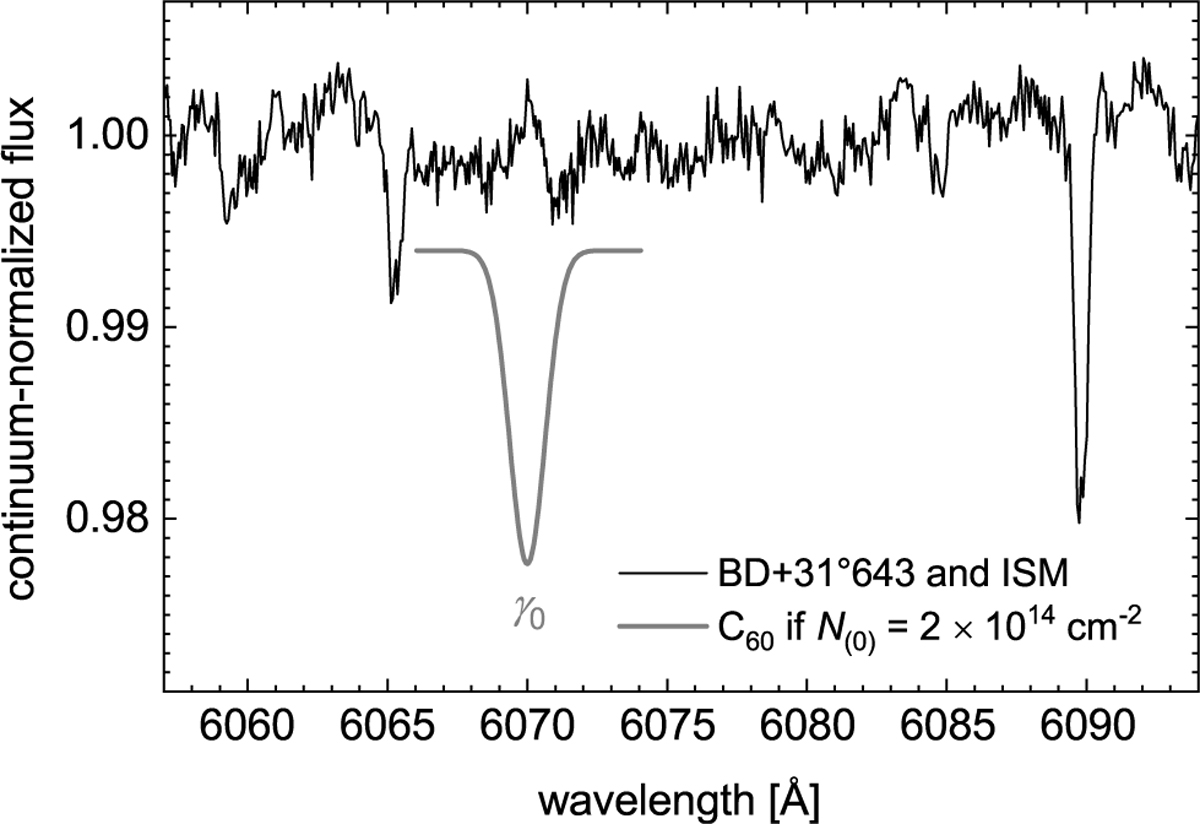
Continuum-normalized flux spectrum of BD+31°643 (black curve). A synthetic γ0 band of free, cold C60 molecules with a column density of 2 × 1014 cm−2 (Iglesias-Groth 2019) is displayed for comparison (thick gray curve, vertically offset for clarity).
Current usage metrics show cumulative count of Article Views (full-text article views including HTML views, PDF and ePub downloads, according to the available data) and Abstracts Views on Vision4Press platform.
Data correspond to usage on the plateform after 2015. The current usage metrics is available 48-96 hours after online publication and is updated daily on week days.
Initial download of the metrics may take a while.