Fig. 1
Download original image
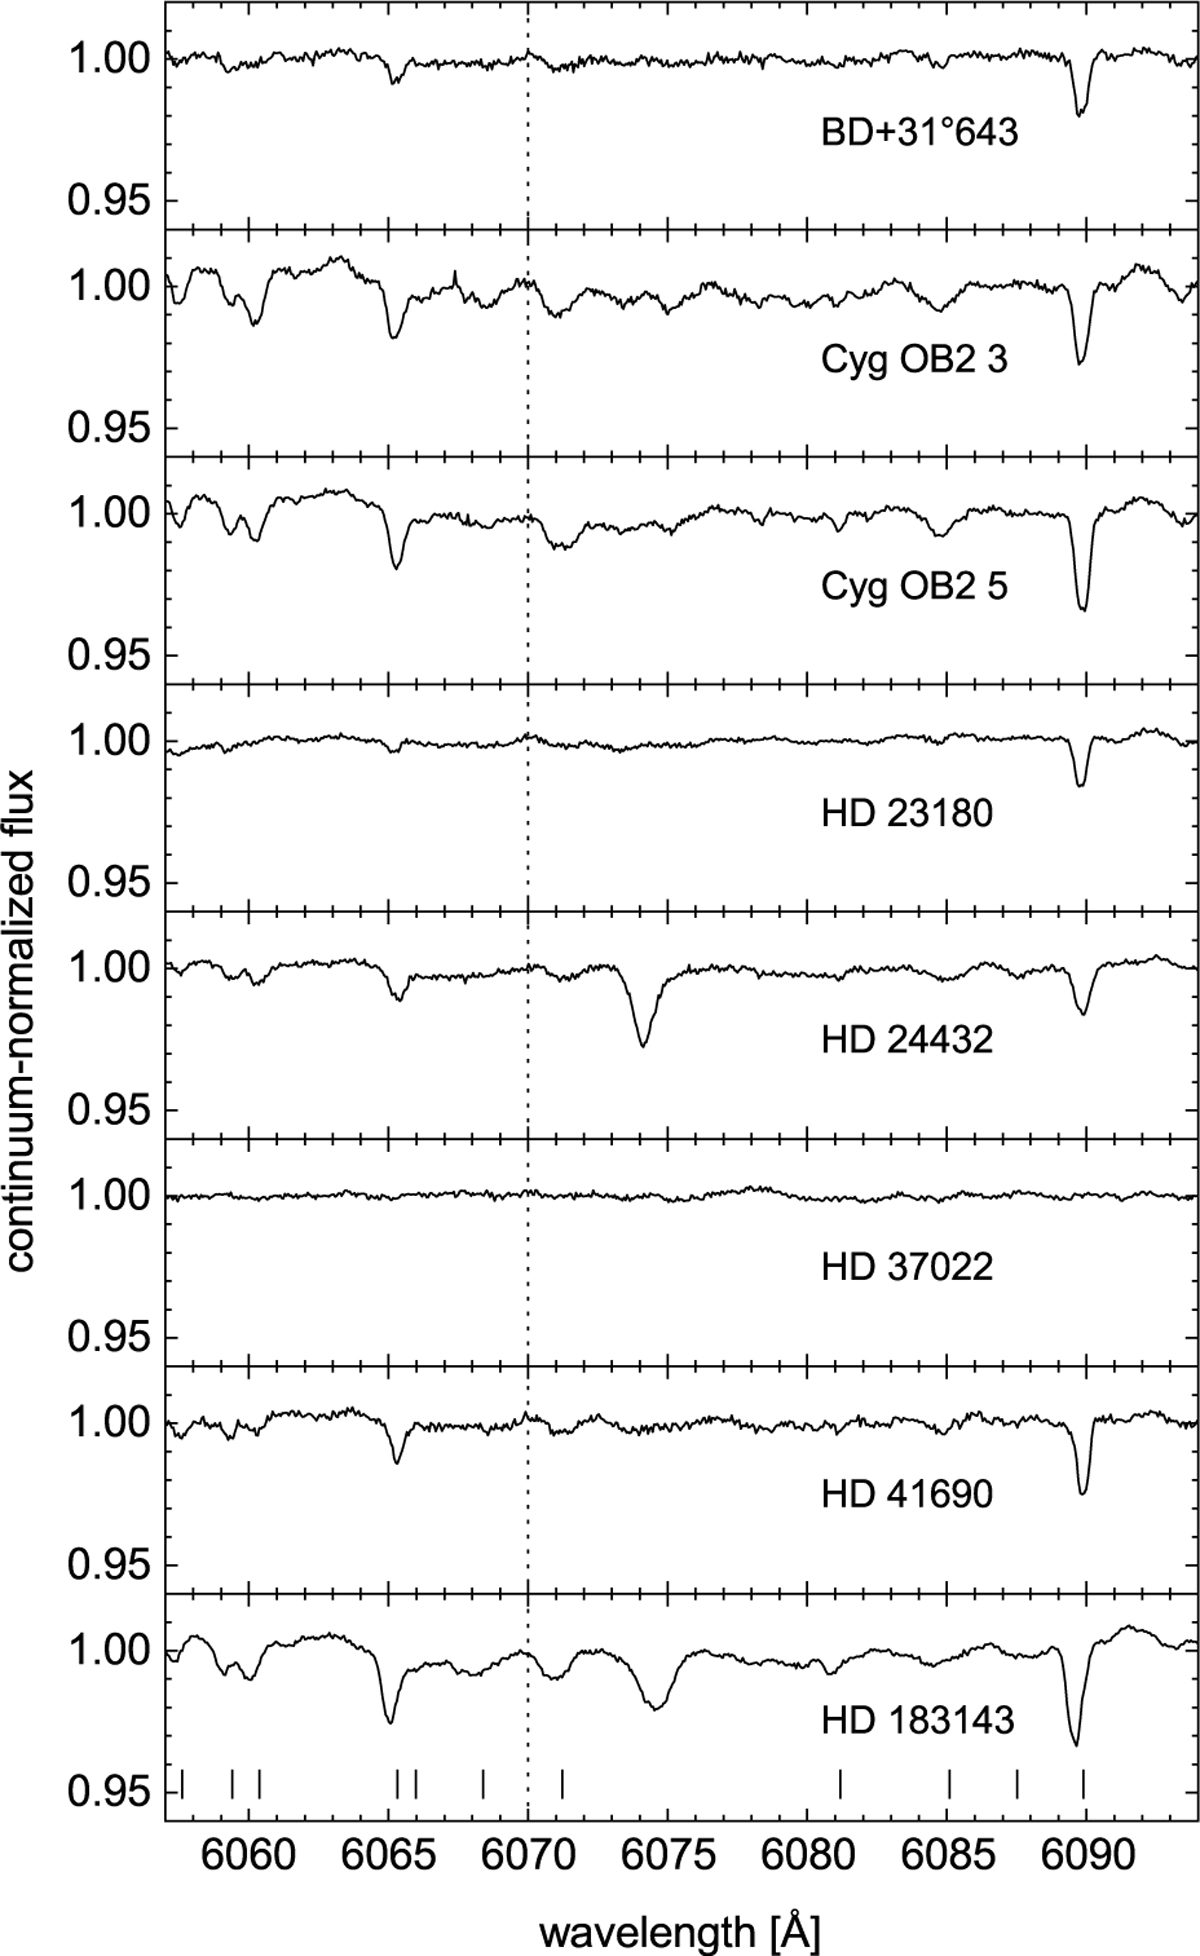
Continuum-normalized flux spectra of the eight LOSs in the program. Each panel and the spectrum it presents are labeled with the identifier of the target star. The position of the γ0 band of C60 is indicated through all panels (vertical dotted line). Positions of DIBs given by Hobbs et al. (2009) are indicated in the bottom panel by short vertical lines.
Current usage metrics show cumulative count of Article Views (full-text article views including HTML views, PDF and ePub downloads, according to the available data) and Abstracts Views on Vision4Press platform.
Data correspond to usage on the plateform after 2015. The current usage metrics is available 48-96 hours after online publication and is updated daily on week days.
Initial download of the metrics may take a while.