| Issue |
A&A
Volume 696, April 2025
|
|
|---|---|---|
| Article Number | A7 | |
| Number of page(s) | 27 | |
| Section | Interstellar and circumstellar matter | |
| DOI | https://doi.org/10.1051/0004-6361/202452810 | |
| Published online | 28 March 2025 | |
ALMA observations of CH3COCH3 and the related species CH3CHO, CH3OH, and C2H5CN in line-rich molecular cores
1
School of Physics and Astronomy, Yunnan University,
Kunming
650091,
PR China
2
Shanghai Astronomical Observatory, Chinese Academy of Sciences,
80 Nandan Road,
Shanghai
200030,
PR China
3
Xinjiang Astronomical Observatory, Chinese Academy of Sciences,
Urumqi
831399,
China
4
Kavli Institute for Astronomy and Astrophysics, Peking University,
Beijing
100871,
PR China
5
Department of Astronomy, School of Physics, Peking University,
Beijing
100871,
PR China
6
Center for Astrophysics, Guangzhou University,
Guangzhou
510006,
PR China
7
Institute of Astrophysics, School of Physics and Electronic Science, Chuxiong Normal University,
Chuxiong
675000,
PR China
8
I. Physikalisches Institut, Universität zu Köln,
Zülpicher Straße 77,
50937
Köln,
Germany
9
Research Center for Intelligent Computing Platforms, Zhejiang Laboratory,
Hangzhou
311100,
PR China
★ Corresponding authors; This email address is being protected from spambots. You need JavaScript enabled to view it.
; This email address is being protected from spambots. You need JavaScript enabled to view it.
; This email address is being protected from spambots. You need JavaScript enabled to view it.
Received:
30
October
2024
Accepted:
25
February
2025
Abstract
Context. Acetone (CH3COCH3) is a carbonyl-bearing complex organic molecule, yet interstellar observations of acetone remain limited. Studying the formation and distribution of CH3COCH3 in the interstellar medium can provide valuable insights into prebiotic chemistry and the evolution of interstellar molecules.
Aims. We explore the spatial distribution of CH3COCH3 and its correlation with the O-bearing molecules acetaldehyde (CH3CHO) and methanol (CH3OH), as well as the N-bearing molecule ethyl cyanide (C2H5CN), in massive protostellar clumps.
Methods. We observed 11 massive protostellar clumps using ALMA at 345 GHz, with an angular resolution of 0.7′′−1.0′′. Spectral line transitions were identified using the eXtended CASA Line Analysis Software Suite. We constructed integrated intensity maps of CH3COCH3, CH3CHO, CH3OH, and C2H5CN and derived their rotation temperatures, column densities, and abundances under the assumption of local thermodynamic equilibrium.
Results. CH3COCH3 is detected in 16 line-rich cores from 9 massive protostellar clumps: 12 high-mass cores (core mass >8 M⊙), 3 intermediate-mass cores (2–8 M⊙), and 1 low-mass core (<2 M⊙). CH3CHO and CH3OH are also detected in all 16 cores, while C2H5CN is detected in 15. The integrated intensity maps reveal similar spatial distributions for CH3COCH3, CH3CHO, CH3OH, and C2H5CN. The line emission peaks of all four molecules coincide with the continuum emission peaks in regions without ultra-compact HII regions. Significant correlations are observed in the abundances of these molecules, which also exhibit similar average temperatures.
Conclusions. Our observational results, supported by chemical models, suggest that CH3COCH3, CH3CHO, and CH3OH originate from the same gas. The observed temperatures and abundances of CH3COCH3 are consistent with model predictions involving grain surface chemistry.
Key words: astrochemistry / line: identification / stars: formation / ISM: abundances / ISM: molecules
© The Authors 2025
 Open Access article, published by EDP Sciences, under the terms of the Creative Commons Attribution License (https://creativecommons.org/licenses/by/4.0), which permits unrestricted use, distribution, and reproduction in any medium, provided the original work is properly cited.
This article is published in open access under the Subscribe to Open model. This email address is being protected from spambots. You need JavaScript enabled to view it. to support open access publication.
1 Introduction
Carbonyl-bearing complex organic molecules (COMs) are considered potential precursors of complex biomolecules (Bennett & Kaiser 2007; Jalbout 2008; Halfen et al. 2011; Frigge et al. 2018). The formation mechanisms of carbonyl-bearing COMs have garnered significant interest in astrochemistry and astrobiology (Bennett & Kaiser 2007; Bennett et al. 2007; Frigge et al. 2018). Acetone (CH3COCH3) is a representative carbonyl-bearing COM; it is characterized by its symmetric structure centered on the C=O group. It was the first COM containing ten atoms discovered in the interstellar medium (ISM; Combes et al. 1987; Snyder et al. 2002; Andrade et al. 2014). Recent advances in radio telescope technology have enabled the detection of CH3COCH3 in high- (Friedel et al. 2005; Isokoski et al. 2013; Peng et al. 2013; Feng et al. 2015; Rong et al. 2016; Zou & Widicus Weaver 2017; Palau et al. 2017; Suzuki et al. 2018; Csengeri et al. 2019; Peng et al. 2022; Mininni et al. 2023), intermediate- (Palau et al. 2011; Fuente et al. 2014), and low-mass star-forming regions (Jørgensen et al. 2011; Imai et al. 2016; Lykke et al. 2017; van Gelder et al. 2020; Martín-Doménech et al. 2021).
Interferometric observations of the Orion-KL region have shown that the spatial distribution of CH3COCH3 is primarily concentrated in the hot core, rather than in the compact ridge, resembling that of complex cyanides (Friedel & Snyder 2008; Peng et al. 2013). This seems to imply a potential chemical relationship between the formation of CH3COCH3 and N-bearing species. Although CH3COCH3 has been detected in various astronomical sources, its study has largely been confined to individual targets observed with interferometers or to small samples observed using single-dish telescopes. Hence, its physical and chemical properties remain poorly understood. Given that COMs are typically localized in compact regions within star-forming environments (Lykke et al. 2017; Qin et al. 2022), comprehensive interferometric studies targeting CH3COCH3 and chemically associated molecules across a larger sample with a similar angular resolution and spectral setup are essential.
We conducted observations of 11 massive protostellar clumps using Band 7 of the Atacama Large Millimeter/submillimeter Array (ALMA). These data serve as a pilot project for the ALMA Three-millimeter Observations of Massive Star-Forming Regions (ATOMS) survey and are a subsample of ATOMS (Liu et al. 2020; Xu et al. 2024). The 11 clumps have masses ranging from (1–22) × 103 M⊙ and fall between the early stages of massive star formation and the HII region phase, with L/M ratios ranging from 12 to 80 (Xu et al. 2024). Eight of the clumps enshroud ultra-compact (UC) HII regions, as indicated by the presence of associated H40α emission (Qin et al. 2022; Zhang et al. 2023). The primary goal of this study is to investigate the physical and chemical properties of the CH3COCH3 molecule by comparing it with the O-bearing molecules CH3CHO and CH3OH, as well as the N-bearing molecule C2H5CN.
The observations and data reduction are described in Sect. 2. Section 3 presents the observational results, including the line identification, spatial distribution, and parameter calculations for CH3COCH3, CH3CHO, CH3OH, and C2H5CN. The chemical implications of these findings are discussed in Sect. 4, and the conclusions are summarized in Sect. 5.
2 Observations
The sample selection for the ALMA observations is described in detail by Xu et al. (2024) and Chen et al. (2024). The ALMA Band-7 data for 11 massive protoclusters were obtained between May 18 and May 20, 2018 (Project ID: 2017.1.00545.S; PI: Tie Liu), using 43 12-meter antennas in the C43-1 configuration, with baselines ranging from 15.0 to 313.7 meters. The Band-7 observations included four spectral windows (SPWs): 342.36–344.24 GHz (SPW 31), 344.25–346.09 GHz (SPW 29), 356.60–357.07 GHz (SPW 27), and 354.27–354.74 GHz (SPW 25). SPWs 27 and 25 provided a bandwidth of 469 MHz with a spectral resolution of 0.24 km s−1, while SPWs 31 and 29 offered a bandwidth of 1875 MHz with a spectral resolution of 0.98 km s−1. In this paper we present spectral line data from the broader SPWs, SPW 31 and SPW 29. The calibrators used for flux and bandpass calibration were J1427-4206, J1517-2422, and J1924-2914, while phase calibration was performed using J1524-5903, J1650-5044, and J1733-3722. Data calibration was carried out using Common Astronomy Software Applications (CASA; McMullin et al. 2007) version 5.1.15. The deconvolution was performed using the “hogbom” algorithm with a weighting parameter of “briggs,” and the robust parameter was set to 0.5 to balance sensitivity and resolution. Continuum imaging and line cubes were generated with the TCLEAN task in CASA 5.3. The continuum images were constructed from line-free channels across four SPWs. Due to the rich spectral line features of the sample, fewer than 10% of the channels were available as line-free, resulting in relatively poor continuum sensitivity. Self-calibration was applied to improve the quality of the continuum images. The self-calibration solutions derived from the continuum images were applied to the line cubes. Primary beam correction was applied using pblimit = 0.2. The final synthesized beam sizes for both the continuum images and line cubes range from 0.7 to 1.0 arcsec. The average sensitivity of the continuum images is ∼ 1.2 mJy beam−1, and the mean sensitivity of the line cubes is ∼ 4.7 mJy beam−1 per channel.
3 Results
3.1 Line identifications
A total of 145 dense cores were identified across the 11 clumps, and 28 cores from 9 clumps were classified as line-rich (Chen et al. 2024). Spectra were extracted from a single pixel at the continuum peak position of the dense core and averaged over the beam. In this work, we used the eXtended CASA Line Analysis Software Suite (XCLASS1; Möller et al. 2017) to identify spectral lines in the 28 line-rich cores. XCLASS accesses two molecular databases, the Cologne Database for Molecular Spectroscopy (CDMS2; Müller et al. 2001, 2005) and the Jet Propulsion Laboratory (JPL3; Pickett et al. 1998) catalogs. Under the assumption of local thermodynamic equilibrium (LTE), XCLASS solves the radiative transfer equation and generates synthetic spectra for specific molecular transitions, accounting for factors such as source size, beam filling factor, line profile, opacity, and blending. The primary parameters for fitting each molecule include source size (θ), rotation temperature (T), column density (N), line width (ΔV), and velocity offset (Voff). In our study, the source size was taken as the deconvolved size of the continuum emission (see Table A.1), which was derived from 2D Gaussian fitting in CASA (Chen et al. 2024). As shown in Fig. 2, in some sources, the molecular line emissions appear more extended than the continuum emissions. This may lead to an underestimation of the source size, resulting in an overestimate of the fitted column densities. XCLASS also integrates with the model optimizer package, Modeling and Analysis Generic Interface for eXternal numerical codes (MAGIX; Möller et al. 2013). MAGIX optimizes the parameter solutions and provides error estimations using various algorithms. We obtained the final fitting parameters and error estimates for the molecules using the Markov chain Monte Carlo algorithm.
Transitions are considered to be detected if their line intensities exceed 3σ noise level and the observed line intensities at different frequencies are consistent with the XCLASS model predictions. Molecular lines of CH3COCH3 are identified in 16 of the 28 line-rich cores. Table A.1 lists the target source names, distances, core positions, deconvolved sizes, peak flux densities, integrated flux densities, core masses, and H2 column densities of the continuum cores, based on values reported by Chen et al. (2024). The source-averaged H2 column densities of the 16 cores are derived from the continuum flux using the following formula under the LTE assumption (Kauffmann et al. 2008):
 (1)
(1)
where Sν is the integrated flux density, η = 100 is the gas-to-dust mass ratio (Lis et al. 1991; Hasegawa et al. 1992), μ = 2.8 is the mean molecular weight of the gas (Kauffmann et al. 2008), mH is the mass of the hydrogen atom, κ870 μm = 1.89 cm2 g−1 is the dust mass absorption coefficient (Ossenkopf & Henning 1994), Ω is the solid angle subtended by the source, and Bv(T) is the Planck function at dust temperature T (T is taken from Chen et al. 2024, and it is assumed to be equal to the gas temperature of CH3OCHO). The 16 line-rich cores are classified into 12 high-mass line-rich cores (H, >8 M⊙), 4 intermediate-mass line-rich cores (I, 2–8 M⊙), and 1 low-mass line-rich core (L, <2 M⊙) according to core mass. Line transitions of CH3CHO and CH3OH are also detected in all 16 cores, while C2H5CN transitions are detected in 15 cores (excluding IRAS 16060 C2). Due to the optical thickness and blending of certain CH3OH lines (see Appendix C), we fit the isotopolog 13CH3OH as an alternative in the 16 cores. Figure 1 shows sample spectra toward IRAS 16272-4837 C3, with modeled molecular spectra for CH3COCH3, CH3CHO, CH3OH, 13CH3OH, and C2H5CN overlaid. Additional spectra are presented in Fig. B.1. CH3COCH3, 13CH3OH, and C2H5CN exhibit multiple transition lines, while CH3CHO displays two transition lines in each core. Table C.1 lists the parameters of the CH3COCH3, CH3CHO, CH3OH, 13CH3OH, and C2H5CN transitions. The upper level energy ranges of molecular transitions are 93–485 K for CH3COCH3, 227–459 K for CH3OH, 36–144 K for 13CH3OH, and 64–441 K for C2H5CN. CH3CHO exhibits only two line transitions, with the same upper level energy of 166 K. We assumed that the fitting temperature of CH3CHO is equal to the excitation temperature of CH3COCH3, as CH3CHO is considered a precursor to CH3COCH3 (Garrod et al. 2022). The vibrational contributions of CH3COCH3, CH3CHO, and 13CH3OH are already included in the partition function, while the partition function of C2H5CN only considers the contribution from the ground state in the XCLASS fitting. The vibrational correction factor (fvib) can be given as (Tsuji 1966)
 (2)
(2)
where h is Planck’s constant, k is Boltzmann’s constant, vi is the vibrational frequency of mode i (Heise et al. 1981), and T is the temperature. The column densities of C2H5CN have been corrected by the fvib.
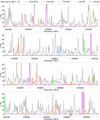 |
Fig. 1 Spectra of IRAS 16272-4837 C3 in the frequency range 342.4–346.1 GHz. The observed spectra are shown as gray curves, and the XCLASS-modeled spectra as colored curves. Spectra of other sources are presented in Fig. B.1. |
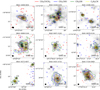 |
Fig. 2 Continuum emission in gray scale at 870 μm overlaid with the integrated intensities of CH3COCH3, CH3CHO, CH3OH, and C2H5CN in nine high-mass star-forming regions. Colored contours represent the integrated intensities of each molecule. Contour levels are stepped by 10% of the peak values, with the outermost levels as follows: 4% for I14498, 6% for I15520, 10% for I15596, 1.3% for I16060, 1.3% for I16071, 5% for I16076, 1% for I16272, 0.8% for I16351, and 1.8% for I17220. Line-rich cores are named according to Li et al. (2024). The cross symbols mark the peak positions of the continuum emissions. The synthesized beam sizes are shown in the lower left, and scale bars are in the lower right. |
3.2 Spatial distribution
We generated integrated intensity maps of CH3COCH3 at 342485 MHz, CH3CHO at 343779 MHz, CH3OH at 342730 MHz, and C2H5CN at 343195 MHz toward nine massive protostellar regions, as shown in Fig. 2. The spatial distributions of CH3COCH3 exhibit similarities with those of the O-bearing molecules CH3CHO and CH3OH, as well as the N-bearing molecule C2H5CN. The line emission peaks of these molecules coincide with the continuum peaks in most regions. The exceptions occur in I15520 C3, I16060 C1, C2 and C3, and I17220 C1 and C2, where the line emission peaks are offset from the continuum peaks. Intense UC HII regions traced by the H40α lines are found in I15520, I16060, and I17220 (Qin et al. 2022; Zhang et al. 2023), and the observed line offsets are likely influenced by UC HII regions. Peng et al. (2013) reported that the distribution of CH3COCH3 in Orion-KL is similar to those of N-bearing molecules, but significantly different from those of complex O-bearing molecules. However, in our larger sample, CH3COCH3 was found to be associated with the spatial distribution of both O- and N-bearing molecules. The resolved linear scale reported by Peng et al. (2013) is approximately 500 au, whereas the resolved linear scales of our samples exceed 2000 au. Future higher angular resolution observations may be able to resolve the differences in the spatial distribution of these molecules as in Orion KL. Previous studies have found that CH3COCH3 can only be detected in regions where C2H5CN is detected (Friedel & Snyder 2008; Peng et al. 2013). Nonetheless, I16060 C2 provides a counterexample, as C2H5CN is not detected in I16060 C2 (see Table A.2). The UC HII region of I16060 is significantly stronger compared to I15520 and I17220 (Zhang et al. 2023), which may be linked to the absence of C2H5CN.
3.3 Rotation temperatures, column densities, and abundances
The rotation temperatures of CH3COCH3 and C2H5CN, as well as the column densities of CH3COCH3, CH3CHO, and C2H5CN in 16 line-rich cores are summarized in Table A.2. Since two transitions of CH3CHO have the same upper energy level, the rotation temperature was fixed to that of CH3COCH3 and the column density was subsequently derived. The rotation temperature of CH3OH was assumed to be the same as that of 13CH3OH. The column densities of CH3OH in 15 cores were taken from Li et al. (2024), which were calculated from the 12C/13C ratios based on the column densities of 13CH3OH. The ratios of 12C/13C follow (Yan et al. 2019)
 (3)
(3)
where RGC (in kpc) represents the distance from the Galactic Center (Liu et al. 2020). I17220 C2 is a CH3COCH3 core that is not compiled in Li et al. (2024), and the column density of CH3OH was derived from a column density of 13CH3OH of (2.0±0.2)×1017 cm−2, using a 12C/13C ratio of 18, computed by Eq. (3). The rotation temperature and column density of CH3OH are presented in Table A.3. From Tables A.2 and A.3, the rotation temperatures range from 92 to 163 K for CH3COCH3, 95 to 250 K for C2H5CN, and 52 to 159 K for CH3OH. The column densities span from 1015 to 1017 cm−2 for CH3COCH3 and C2H5CN, 1014 to 1016 cm−2 for CH3CHO, and 1017 to 1019 cm−2 for CH3OH. In general, the column densities of the four molecules in the H cores are 1 to 2 orders of magnitude higher than those in the I and L cores. The fractional abundance of a given molecule relative to H2 is expressed as fH2 = N/N(H2), where N represents the column density of specific molecule and N(H2) denotes the column density of molecular hydrogen. Tables A.2 and A.3 also show the abundances of four molecules relative to H2. The molecules CH3COCH3 and C2H5CN exhibit comparable abundances, ranging from 10−9 to 10−7. The abundance of CH3CHO is found to be within the range 10−9 to 10−8, while CH3OH is approximately three orders of magnitude more abundant than the other molecules, with values ranging from 10−6 to 10−5. The average abundances of the four molecules are (6.2±1.3)×10−8 for CH3COCH3, (1.6±0.4)×10−8 for CH3CHO, (9.0±1.7)×10−6 for CH3OH, and (7.5±1.9)×10−8 for C2H5CN. In clump I16351, the H core (C2) and L core (C1) residing in the same gas environment exhibit the highest and lowest CH3COCH3 abundances.
A comparison of the abundances of CH3COCH3, CH3CHO, CH3OH, and C2H5CN relative to H2 in 16 line-rich cores is presented in Fig. 3. The correlation coefficients of CH3COCH3 with CH3CHO, CH3OH, and C2H5CN are 0.90, 0.61, and 0.91, respectively. CH3COCH3 exhibits a significant correlation (P<0.05) with CH3OH and highly significant correlations (P<0.001) with CH3CHO and C2H5CN. Abundance correlations between CH3COCH3 and C2H5CN, as well as between CH3COCH3 and CH3OH, were also reported by Suzuki et al. (2018) in six high-mass star-forming regions, with correlation coefficients of 0.54 and 0.60, respectively. Figure 4 further compares the rotation temperatures of CH3COCH3, CH3OH, and C2H5CN, showing no significant correlations in temperatures among these molecules. This indicates that the abundance correlations of these molecules are not affected by temperature. The average temperatures of the three molecules are 129±6 K for CH3COCH3, 119±9 K for CH3OH, and 141±11 K for C2H5CN. Considering the errors, the average temperatures of the three molecules are comparable.
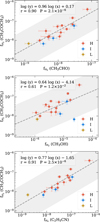 |
Fig. 3 Abundances of CH3COCH3, CH3CHO, CH3OH, and C2H5CN relative to H2. Colored circles denote different types of cores: H (high-mass line-rich cores), I (intermediate-mass line-rich cores), and L (low-mass line-rich cores). The bars represent the 1σ errors estimated by MAGIX. Dashed lines represent linear least-squares fits to the data. The shaded regions indicate an order of magnitude scatter. Fitting results, Pearson correlation coefficients (r), and significance levels (P) are displayed in the upper left. |
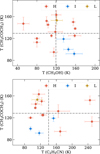 |
Fig. 4 Comparison of the rotation temperatures of CH3COCH3, CH3OH, and C2H5CN. Colored circles denote different core types: H (high-mass line-rich cores), I (intermediate-mass line-rich cores), and L (low-mass line-rich cores). The bars represent the 1σ errors estimated by MAGIX. Dashed lines indicate the mean temperatures for each molecule. |
4 Discussion
4.1 Comparison of the physical parameters of CH3COCH3 in different sources
The rotation temperatures, column densities, and abundances of CH3COCH3 derived from our observations have been compared with those reported in high-, intermediate-, and low-mass starforming regions. The mean rotation temperature of CH3COCH3 in the H cores from our study is 134 K, the average column density is 4.2 × 1016 cm−2, and the mean abundance is 7.5 × 10⁻⁸. These values align with those found in high-mass starforming regions (Friedel et al. 2005; Peng et al. 2013; Rong et al. 2016; Csengeri et al. 2019; Peng et al. 2022). In the I cores, the mean column density of CH3COCH3 is 7.9 × 1015 cm−2, which is comparable to that observed in intermediate-mass starforming regions (Jørgensen et al. 2011; Fuente et al. 2014). For the L cores, the CH3COCH3 column density of 1.6 × 1015 cm−2 lies between values reported for low-mass protostars, including IRAS 16293-2422 (∼1016 cm−2; Lykke et al. 2017) and IRAS 19347+0727 (∼1014 cm−2; Imai et al. 2016). These comparisons suggest that the CH3COCH3 emitting gas in the H, I, and L cores may have similar physical and chemical conditions as those of high-, intermediate-, and low-mass star formation regions, respectively.
4.2 Chemistry
CH3COCH3, CH3CHO, CH3OH, and C2H5CN are simultaneously detected in 16 line-rich cores from our observations (except for C2H5CN in I16060 C2). The four molecules have also been commonly reported in other hot cores (Feng et al. 2015; Mininni et al. 2023; Fuente et al. 2014) and hot corinos (van Gelder et al. 2020). Moreover, CH3COCH3, CH3CHO, and CH3OH have been demonstrated to be chemically linked. On the grain surface, CH3COCH3 and CH3OH share a common precursor, the methyl radical (CH3), through the following reactions (Garrod et al. 2008; Suzuki et al. 2018):
 (4)
(4)
 (5)
(5)
Additionally, CH3CHO acts as a precursor to CH3COCH3 via grain surface reactions (Garrod et al. 2022):
 (6)
(6)
where CH3CHO can be efficiently regenerated in the gas phase through the reaction of O with C2H5 (Garrod et al. 2022). In our observations, the morphological similarities, colocated line peaks at continuum sources, and abundance correlations among CH3COCH3, CH3CHO, and CH3OH provide further evidence that these molecules are chemically related and likely form on grain surfaces. Garrod et al. (2022) predicted the abundance of CH3COCH3 in the hot cores using reaction (6). The model employed three warm-up timescales: 5 × 10⁴ years (fast), 2 × 10⁵ years (medium), and 1 × 10⁶ years (slow). The predicted CH3COCH3 abundances for these timescales are 6.4 × 10⁻⁹, 7.0 × 10⁻⁹, and 1.4 × 10⁻⁸, respectively. The average abundance of CH3COCH3 is (6.2±1.3)×10−8, which is comparable to the slow timescale model prediction. However, no chemical models suggest a direct association between CH3COCH3 and C2H5CN. It is possible that these two molecules coexist within similar physical environments without being chemically related.
5 Conclusions
We have presented a study of CH3COCH3 toward 11 massive protocluster clumps using ALMA Band-7 observations and analyzed the correlations among CH3COCH3, CH3CHO, CH3OH, and C2H5CN. Our main findings are as follows:
CH3COCH3, CH3CHO, and CH3OH lines were detected in 16 line-rich cores, while C2H5CN lines were detected in 15 line-rich cores, across 9 of the 11 massive protocluster clumps considered;
Integrated intensity maps from the nine massive protocluster clumps reveal that the spatial distribution of CH3COCH3 is similar to that of the O-bearing molecules CH3CHO and CH3OH, as well as the N-bearing molecule C2H5CN;
The line peaks of the four molecules coincide with the continuum peaks in regions devoid of UC HII regions. In the presence of UC HII regions, the line peaks are offset from the continuum peaks;
CH3COCH3, CH3CHO, CH3OH, and C2H5CN exhibit significant abundance correlations, and CH3COCH3, CH3OH, and C2H5CN have similar average temperatures;
The apparent spatial similarities and abundance correlations of CH3COCH3, CH3CHO, and CH3OH, combined with chemical models, suggest that these molecules originate from the same gas. The observed temperatures and abundances of CH3COCH3 are consistent with model predictions involving grain surface production.
Acknowledgements
This paper makes use of the following ALMA data: ADS/JAO.ALMA#2017.1.00545.S. ALMA is a partnership of ESO (representing its member states), NSF (USA), and NINS (Japan), together with NRC (Canada), MOST and ASIAA (Taiwan), and KASI (Republic of Korea), in cooperation with the Republic of Chile. The Joint ALMA Observatory is operated by ESO, AUI/NRAO, and NAOJ. This work has been supported by National Key R&D Program of China (No. 2022YFA1603101), and by NSFC through the grants Nos. 12033005, 12073061, 12122307, and 12103045. S.-L. Qin thanks the Xinjiang Uygur Autonomous Region of China for their support through the Tianchi Program. H.-L. Liu is supported by Yunnan Fundamental Research Project (grant Nos. 202301AT070118, 202401AS070121). Tie Liu thanks the supports by the international partnership program of Chinese Academy of Sciences through grant No.114231KYSB20200009, and Shanghai Pujiang Program 20PJ1415500. XHL acknowledges the support by NSFC through grants no. 12473025. T. Zhang thanks the student’s exchange program of the Collaborative Research Center 956, funded by the Deutsche Forschungsgemeinschaft (DFG). We would like to thank the anonymous referee for the valuable comments and suggestions, which helped improve the quality of the manuscript.
Appendix A Parameters of line-rich cores
Physical parameters of the continuum sources.
Physical parameters of CH3COCH3, CH3CHO, and C2H5CN.
Physical parameters of CH3OH derived from 13CH3OH.
Appendix B Spectra of line-rich cores
The spectra of CH3COCH3, CH3CHO, CH3OH, 13CH3OH, and C2H5CN in the frequency range 342.4–346.1 GHz for the 16 line-rich cores are presented in Figs. 1 and B.1.
Appendix C Molecular transitions
The rotational transitions of the molecules detected in 16 line-rich cores are presented in Table C.1. Molecular parameters for CH3COCH3 and CH3CHO lines are taken from the JPL catalog, while parameters for CH3OH, 13CH3OH, and C2H5CN lines are sourced from the CDMS catalog.
Detected spectral transitions of CH3COCH3, CH3CHO, CH3OH, 13CH3OH, and C2H5CN.
References
- Andrade, D. P. P., de Barros, A. L. F., Ding, J., et al. 2014, MNRAS, 444, 3792 [CrossRef] [Google Scholar]
- Bennett, C. J., & Kaiser, R. I. 2007, ApJ, 661, 899 [Google Scholar]
- Bennett, C. J., Chen, S.-H., Sun, B.-J., Chang, A. H. H., & Kaiser, R. I. 2007, ApJ, 660, 1588 [NASA ADS] [CrossRef] [Google Scholar]
- Chen, L., Qin, S.-L., Liu, T., et al. 2024, ApJ, 962, 13 [NASA ADS] [CrossRef] [Google Scholar]
- Combes, F., Gerin, M., Wootten, A., et al. 1987, A&A, 180, L13 [Google Scholar]
- Csengeri, T., Belloche, A., Bontemps, S., et al. 2019, A&A, 632, A57 [NASA ADS] [CrossRef] [EDP Sciences] [Google Scholar]
- Feng, S., Beuther, H., Henning, T., et al. 2015, A&A, 581, A71 [NASA ADS] [CrossRef] [EDP Sciences] [Google Scholar]
- Friedel, D. N., & Snyder, L. E. 2008, ApJ, 672, 962 [NASA ADS] [CrossRef] [Google Scholar]
- Friedel, D. N., Snyder, L. E., Remijan, A. J., & Turner, B. E. 2005, ApJ, 632, L95 [NASA ADS] [CrossRef] [Google Scholar]
- Frigge, R., Zhu, C., Turner, A. M., et al. 2018, ApJ, 862, 84 [NASA ADS] [CrossRef] [Google Scholar]
- Fuente, A., Cernicharo, J., Caselli, P., et al. 2014, A&A, 568, A65 [NASA ADS] [CrossRef] [EDP Sciences] [Google Scholar]
- Garrod, R. T., Widicus Weaver, S. L., & Herbst, E. 2008, ApJ, 682, 283 [Google Scholar]
- Garrod, R. T., Jin, M., Matis, K. A., et al. 2022, ApJS, 259, 1 [NASA ADS] [CrossRef] [Google Scholar]
- Halfen, D. T., Ilyushin, V., & Ziurys, L. M. 2011, ApJ, 743, 60 [Google Scholar]
- Hasegawa, T. I., Herbst, E., & Leung, C. M. 1992, ApJS, 82, 167 [Google Scholar]
- Heise, H. M., Winther, F., & Lutz, H. 1981, J. Mol. Spectrosc., 90, 531 [NASA ADS] [CrossRef] [Google Scholar]
- Imai, M., Sakai, N., Oya, Y., et al. 2016, ApJ, 830, L37 [CrossRef] [Google Scholar]
- Isokoski, K., Bottinelli, S., & van Dishoeck, E. F. 2013, A&A, 554, A100 [NASA ADS] [CrossRef] [EDP Sciences] [Google Scholar]
- Jalbout, A. F. 2008, Origins Life Evol. Biosphere, 38, 489 [Google Scholar]
- Jørgensen, J. K., Bourke, T. L., Nguyen Luong, Q., & Takakuwa, S. 2011, A&A, 534, A100 [NASA ADS] [CrossRef] [EDP Sciences] [Google Scholar]
- Kauffmann, J., Bertoldi, F., Bourke, T. L., Evans, N. J., I., & Lee, C. W. 2008, A&A, 487, 993 [NASA ADS] [CrossRef] [EDP Sciences] [Google Scholar]
- Li, C., Qin, S.-L., Liu, T., et al. 2024, MNRAS, 533, 1583 [NASA ADS] [CrossRef] [Google Scholar]
- Lis, D. C., Carlstrom, J. E., & Keene, J. 1991, ApJ, 380, 429 [NASA ADS] [Google Scholar]
- Liu, T., Evans, N. J., Kim, K.-T., et al. 2020, MNRAS, 496, 2790 [Google Scholar]
- Lykke, J. M., Coutens, A., Jørgensen, J. K., et al. 2017, A&A, 597, A53 [NASA ADS] [CrossRef] [EDP Sciences] [Google Scholar]
- Martín-Doménech, R., Bergner, J. B., Öberg, K. I., et al. 2021, ApJ, 923, 155 [CrossRef] [Google Scholar]
- McMullin, J. P., Waters, B., Schiebel, D., Young, W., & Golap, K. 2007, in Astronomical Society of the Pacific Conference Series, 376, Astronomical Data Analysis Software and Systems XVI, eds. R. A. Shaw, F. Hill, & D. J. Bell, 127 [Google Scholar]
- Mininni, C., Beltrán, M. T., Colzi, L., et al. 2023, A&A, 677, A15 [NASA ADS] [CrossRef] [EDP Sciences] [Google Scholar]
- Möller, T., Bernst, I., Panoglou, D., et al. 2013, A&A, 549, A21 [NASA ADS] [CrossRef] [EDP Sciences] [Google Scholar]
- Möller, T., Endres, C., & Schilke, P. 2017, A&A, 598, A7 [NASA ADS] [CrossRef] [EDP Sciences] [Google Scholar]
- Müller, H. S. P., Thorwirth, S., Roth, D. A., & Winnewisser, G. 2001, A&A, 370, L49 [Google Scholar]
- Müller, H. S. P., Schlöder, F., Stutzki, J., & Winnewisser, G. 2005, J. Mol. Struct., 742, 215 [Google Scholar]
- Ossenkopf, V., & Henning, T. 1994, A&A, 291, 943 [NASA ADS] [Google Scholar]
- Palau, A., Fuente, A., Girart, J. M., et al. 2011, ApJ, 743, L32 [NASA ADS] [CrossRef] [Google Scholar]
- Palau, A., Walsh, C., Sánchez-Monge, Á., et al. 2017, MNRAS, 467, 2723 [NASA ADS] [Google Scholar]
- Peng, T. C., Despois, D., Brouillet, N., et al. 2013, A&A, 554, A78 [NASA ADS] [CrossRef] [EDP Sciences] [Google Scholar]
- Peng, Y., Liu, T., Qin, S.-L., et al. 2022, MNRAS, 512, 4419 [CrossRef] [Google Scholar]
- Pickett, H. M., Poynter, R. L., Cohen, E. A., et al. 1998, J. Quant. Spec. Radiat. Transf., 60, 883 [Google Scholar]
- Qin, S.-L., Liu, T., Liu, X., et al. 2022, MNRAS, 511, 3463 [CrossRef] [Google Scholar]
- Rong, J., Qin, S.-L., Zapata, L. A., et al. 2016, MNRAS, 455, 1428 [NASA ADS] [CrossRef] [Google Scholar]
- Snyder, L. E., Lovas, F. J., Mehringer, D. M., et al. 2002, ApJ, 578, 245 [NASA ADS] [CrossRef] [Google Scholar]
- Suzuki, T., Ohishi, M., Saito, M., et al. 2018, ApJS, 237, 3 [NASA ADS] [CrossRef] [Google Scholar]
- Tsuji, T. 1966, PASJ, 18, 127 [NASA ADS] [Google Scholar]
- van Gelder, M. L., Tabone, B., Tychoniec, Ł., et al. 2020, A&A, 639, A87 [NASA ADS] [CrossRef] [EDP Sciences] [Google Scholar]
- Xu, F., Wang, K., Liu, T., et al. 2024, ApJS, 270, 9 [NASA ADS] [CrossRef] [Google Scholar]
- Yan, Y. T., Zhang, J. S., Henkel, C., et al. 2019, ApJ, 877, 154 [Google Scholar]
- Zhang, C., Zhu, F.-Y., Liu, T., et al. 2023, MNRAS, 520, 3245 [NASA ADS] [CrossRef] [Google Scholar]
- Zou, L., & Widicus Weaver, S. L. 2017, ApJ, 849, 139 [NASA ADS] [CrossRef] [Google Scholar]
All Tables
All Figures
|
Fig. 1 Spectra of IRAS 16272-4837 C3 in the frequency range 342.4–346.1 GHz. The observed spectra are shown as gray curves, and the XCLASS-modeled spectra as colored curves. Spectra of other sources are presented in Fig. B.1. |
| In the text | |
|
Fig. 2 Continuum emission in gray scale at 870 μm overlaid with the integrated intensities of CH3COCH3, CH3CHO, CH3OH, and C2H5CN in nine high-mass star-forming regions. Colored contours represent the integrated intensities of each molecule. Contour levels are stepped by 10% of the peak values, with the outermost levels as follows: 4% for I14498, 6% for I15520, 10% for I15596, 1.3% for I16060, 1.3% for I16071, 5% for I16076, 1% for I16272, 0.8% for I16351, and 1.8% for I17220. Line-rich cores are named according to Li et al. (2024). The cross symbols mark the peak positions of the continuum emissions. The synthesized beam sizes are shown in the lower left, and scale bars are in the lower right. |
| In the text | |
|
Fig. 3 Abundances of CH3COCH3, CH3CHO, CH3OH, and C2H5CN relative to H2. Colored circles denote different types of cores: H (high-mass line-rich cores), I (intermediate-mass line-rich cores), and L (low-mass line-rich cores). The bars represent the 1σ errors estimated by MAGIX. Dashed lines represent linear least-squares fits to the data. The shaded regions indicate an order of magnitude scatter. Fitting results, Pearson correlation coefficients (r), and significance levels (P) are displayed in the upper left. |
| In the text | |
|
Fig. 4 Comparison of the rotation temperatures of CH3COCH3, CH3OH, and C2H5CN. Colored circles denote different core types: H (high-mass line-rich cores), I (intermediate-mass line-rich cores), and L (low-mass line-rich cores). The bars represent the 1σ errors estimated by MAGIX. Dashed lines indicate the mean temperatures for each molecule. |
| In the text | |
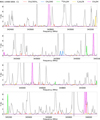 |
Fig. B.1 Same as Fig. 1, but for the other 15 line-rich cores. |
| In the text | |
Current usage metrics show cumulative count of Article Views (full-text article views including HTML views, PDF and ePub downloads, according to the available data) and Abstracts Views on Vision4Press platform.
Data correspond to usage on the plateform after 2015. The current usage metrics is available 48-96 hours after online publication and is updated daily on week days.
Initial download of the metrics may take a while.