Open Access
Fig. 1
Download original image
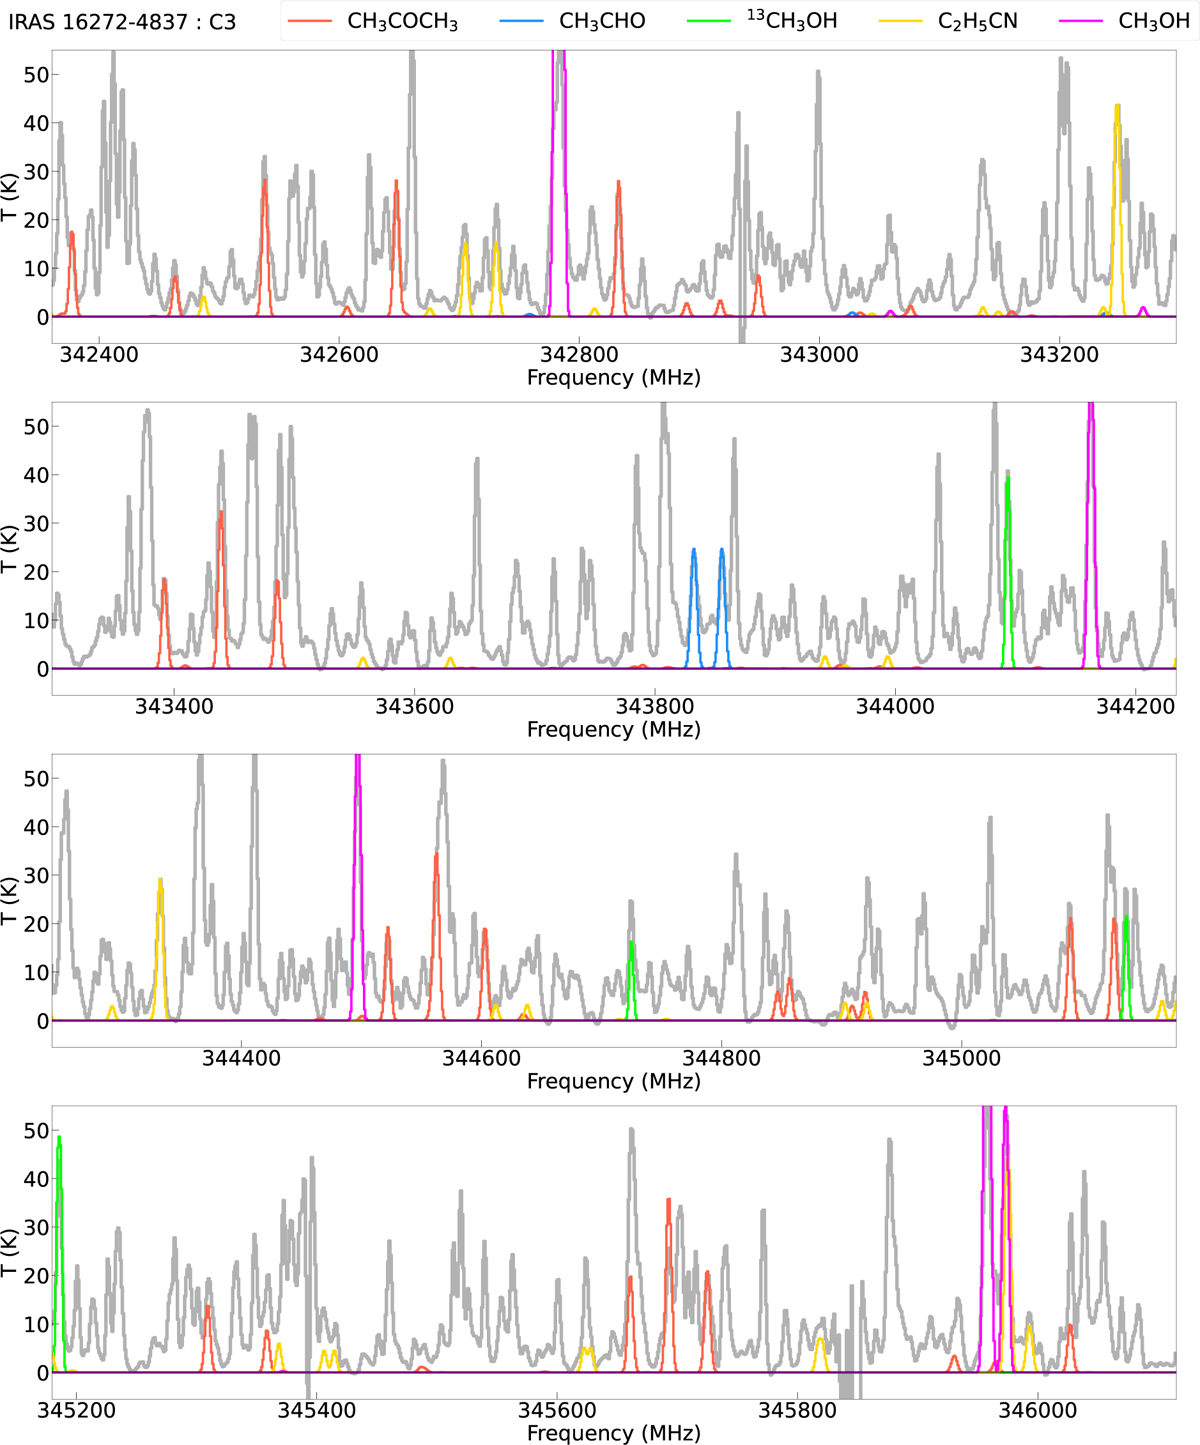
Spectra of IRAS 16272-4837 C3 in the frequency range 342.4–346.1 GHz. The observed spectra are shown as gray curves, and the XCLASS-modeled spectra as colored curves. Spectra of other sources are presented in Fig. B.1.
Current usage metrics show cumulative count of Article Views (full-text article views including HTML views, PDF and ePub downloads, according to the available data) and Abstracts Views on Vision4Press platform.
Data correspond to usage on the plateform after 2015. The current usage metrics is available 48-96 hours after online publication and is updated daily on week days.
Initial download of the metrics may take a while.