Fig. 2
Download original image
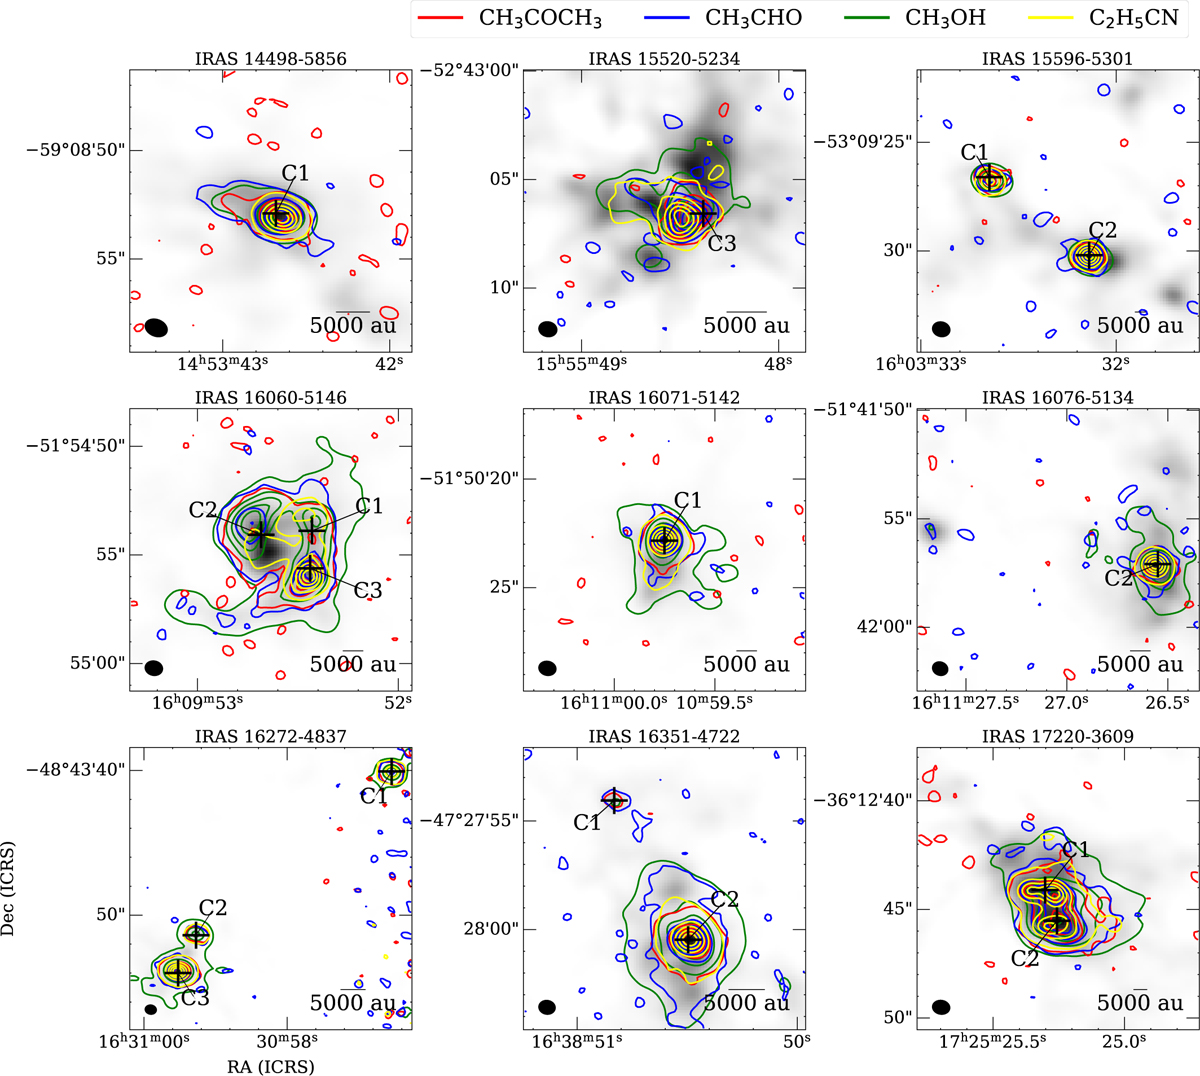
Continuum emission in gray scale at 870 μm overlaid with the integrated intensities of CH3COCH3, CH3CHO, CH3OH, and C2H5CN in nine high-mass star-forming regions. Colored contours represent the integrated intensities of each molecule. Contour levels are stepped by 10% of the peak values, with the outermost levels as follows: 4% for I14498, 6% for I15520, 10% for I15596, 1.3% for I16060, 1.3% for I16071, 5% for I16076, 1% for I16272, 0.8% for I16351, and 1.8% for I17220. Line-rich cores are named according to Li et al. (2024). The cross symbols mark the peak positions of the continuum emissions. The synthesized beam sizes are shown in the lower left, and scale bars are in the lower right.
Current usage metrics show cumulative count of Article Views (full-text article views including HTML views, PDF and ePub downloads, according to the available data) and Abstracts Views on Vision4Press platform.
Data correspond to usage on the plateform after 2015. The current usage metrics is available 48-96 hours after online publication and is updated daily on week days.
Initial download of the metrics may take a while.