| Issue |
A&A
Volume 694, February 2025
|
|
|---|---|---|
| Article Number | A222 | |
| Number of page(s) | 18 | |
| Section | Stellar structure and evolution | |
| DOI | https://doi.org/10.1051/0004-6361/202452500 | |
| Published online | 18 February 2025 | |
ALMA observations of CO isotopologues towards six obscured post-asymptotic giant branch stars
1
Department of Space, Earth and Environment, Chalmers University of Technology, Onsala Space Observatory, 439 92 Onsala, Sweden
2
Centro de Astrobiologia (CAB), CSIC-INTA, ESAC Campus, Camino Bajo del Castillo s/n, 28692 Villanueva de la Cañada, Madrid, Spain
3
Observatorio Astronómico Nacional (OAN-IGN), Alfonso XII No. 3, 28014 Madrid, Spain
4
Instituto de Astrofísica de Andalucía, CSIC, Glorieta de la Astronomía s/n, E-18008 Granada, Spain
5
Instituto de Fisica Fundamental (CSIC), C/Serrano,123, 28006 Madrid, Spain
6
Jet Propulsion Laboratory, MS 183-900, California Institute of Technology, Pasadena, CA 91109, USA
7
Observatorio Astronómico Nacional (OAN-IGN), Ap112, 28803 Alcalá de Henares, Madrid, Spain
8
School of Physics and Astronomy, Monash University, VIC 3800, Australia
9
ARC Centre of Excellence for All Sky Astrophysics in 3 Dimensions (ASTRO 3D), Clayton 3800, Australia
10
Rosseland Centre for Solar Physics, University of Oslo, PO Box 1029 Blindern, 0315 Oslo, Norway
11
Institute of Theoretical Astrophysics, University of Oslo, PO Box 1029 Blindern, 0315 Oslo, Norway
12
Center for General Education, Institute for Comprehensive Education, Kagoshima University, 1-21-30 Korimoto, Kagoshima 890-0065, Japan
13
Amanogawa Galaxy Astronomy Research Center (AGARC), Graduate School of Science and Engineering, Kagoshima University, 1-21-30 Korimoto, Kagoshima 890-0065, Japan
14
Joint ALMA Observatory, Avenida Alonso de Córdova 3107, Vitacura, Santiago, Chile
⋆ Corresponding author; theokhouri@gmail.com
Received:
5
October
2024
Accepted:
20
December
2024
Context. Low- and intermediate-mass stars evolve through the asymptotic giant branch (AGB) when an efficient mass-loss process removes a significant fraction of their initial mass. For most sources, this mass-loss process relies on the interplay between convection, stellar pulsations, and dust formation. However, predicting the mass-loss history of a given star from first principles is complex and not yet feasible at present. At the end of the AGB, at least some stars experience a substantial increase in their mass-loss rate for unknown reasons, leading to the creation of post-AGB objects that are completely enshrouded in thick dusty envelopes. Recent studies have suggested that some of these sources may be the product of interactions between an evolved star with a close companion.
Aims. We observed six obscured post-AGB stars (four C-rich and two O-rich sources) to constrain the properties of their circumstellar envelopes, recent mass-loss histories, and initial masses of the central stars.
Methods. We used observations of the J = 2 − 1 line of 13CO, C17O, and C18O with the Atacama Large Millimeter/submillimeter Array (ALMA) to determine the circumstellar gas masses and the 17O/18O isotopic ratios, the latter of which can be used to infer initial stellar masses. These results were interpreted in the context of comparisons with stellar evolution models in the literature and existing observations of other post-AGB stars.
Results. Based on the inferred 17O/18O isotopic ratios, we find all stars to have relatively low initial masses (< 2 M⊙), contrary to literature indications of higher masses for some sources. One of the C-rich sources, HD 187885, has a low 17O/18O ratio; coupled with a low metallicity, this would imply a relatively low mass (∼1.15 M⊙) for a carbon star. For all but one source (GLMP 950), we observe kinematic components with velocities of ≳30 km s−1, which are higher than typical AGB wind expansion velocities. For most sources, these higher velocity outflows display point-symmetric morphologies. The case of Hen 3-1475 is especially spectacular, with the high-velocity molecular outflow appearing to be interleaved with the high-velocity outflow of ionised gas observed at optical wavelengths. Based on the size of the emission regions of the slow components of the outflows, we derived typical kinematic ages associated with the C18O J = 2 − 1 emission of ≲1500 years and obtained relatively high associated mass-loss rates (≳10−4 M⊙ yr−1). The sources with known spectral types are found to have evolved faster than expected, compared to stellar evolutionary models.
Key words: stars: AGB and post-AGB / circumstellar matter / stars: evolution / stars: jets / stars: kinematics and dynamics / stars: winds / outflows
© The Authors 2025
 Open Access article, published by EDP Sciences, under the terms of the Creative Commons Attribution License (https://creativecommons.org/licenses/by/4.0), which permits unrestricted use, distribution, and reproduction in any medium, provided the original work is properly cited.
This article is published in open access under the Subscribe to Open model. Subscribe to A&A to support open access publication.
1. Introduction
Stars with initial masses between roughly 1 and 8 M⊙ evolve through the asymptotic giant branch (AGB) at the end of their lives (Karakas & Lattanzio 2014). In this phase, nuclear burning of helium and hydrogen happens in separate layers around the inert core rich in carbon and oxygen (Herwig 2005). The dense, stratified inner region is surrounded by a large (∼1 au) convective stellar envelope, making AGB stars evolve into large red giants. The combination of large sizes, low values of surface gravity, and cool and pulsating outer layers leads to such a strong degree of mass loss in the AGB phase (between 10−7 and 10−4 M⊙ yr−1, Höfner & Olofsson 2018) that it dominates the evolution of the star from its onset. This process of mass loss continues until the stellar envelope has essentially been stripped away. The high-energy radiation field from the newly exposed core eventually ionises the ejected gas. If the timing between outflow expansion and evolution of the central remnant is in the right range, the envelope will be visible as a planetary nebula (PN, Kwok 1994).
Explaining the shapes and properties of planetary nebulae (PNe) has been a long-standing problem in astrophysics. The transition from the mostly spherically symmetric outflows of AGB stars to the complex morphologies of PNe (e.g. Sahai & Trauger 1998; Parker et al. 2006; Sahai et al. 2007, 2011) has been a particularly challenging problem to resolve. Recent observations of AGB stars have revealed distributions of the circumstellar molecular gas (Decin et al. 2020), which are reminiscent of complex patterns of arcs and shells seen in the haloes of some PNe. These structures have been suggested to be created by stellar or even planetary companions. The ejection of clumps of gas in random directions due to convection has also been proposed as an important shaping mechanism of AGB outflows (Velilla-Prieto et al. 2023). However, the evolution of the structures of the density distributions into later evolutionary phases, their prevalence in the envelopes of AGB stars, and the average fraction of the circumstellar envelope (CSE) mass contained in such structures is still not well constrained. On large scales and at lower resolutions, the molecular CSEs of AGB stars appear spherically symmetric on average (Ramstedt et al. 2020).
One important process invoked to explain the circumstellar masses of PNe is the so-called super-wind, which has been proposed to be a short phase of intense mass loss (with rates of ∼10−4 M⊙ yr−1) taking place at the end of the AGB (Renzini 1981; Vassiliadis & Wood 1993). One possibility is that PNe are mostly the outcome of binary interactions, featuring a type of common-envelope phase (for an overview, see Jones & Boffin 2017; Boffin & Jones 2019, and references therein). However, only a relatively small fraction (∼20%) of stars evolving through the AGB are expected to have stellar companions at small-enough separations to potentially induce this type of evolution (e.g. Boffin & Jones 2019; Khouri et al. 2021). This relatively low fraction might not be in tension with the observed number of PNe because population synthesis calculations indicate that only a fraction of low- and intermediate-mass stars produce bright PNe (Moe & De Marco 2006; De Marco 2009). Moreover, single-star models do not maintain the required rotation rates to reproduce the observed fraction of non-symmetric PNe (e.g. García-Segura et al. 2014). Finally, the empirical binarity fraction of central-stars of PNe is only a lower limit ≳20% (Jones & Boffin 2017) to the actual fraction, given the observational challenges for this type of study (e.g. De Marco et al. 2015). Nonetheless, the clear correlation between the orientation of the PNe axis and the axis of the orbital plane in PNe with known binary central stars (Hillwig et al. 2016) implies that companions strongly affect the shape of PNe.
Given the observational evidence and the current limitations to studies of PNe and AGB stars, studying the phase before the PN stage and immediately after the AGB (i.e. the post-AGB phase) is crucial for understanding the final stages of the lives of low- and intermediate-mass stars. A subclass of post-AGB sources with dusty discs (containing > 80 objects) are known to very often have detectable close companions (Van Winckel 2007; Oomen et al. 2018). Some of these sources even display gaseous discs with Keplerian rotation that remain stable over long timescales (Van Winckel 2018; Gallardo Cava et al. 2021). Although determining binary fractions in post-AGB stars more obscured by circumstellar dust is difficult, observations of the morphology and dynamical components of their CSEs provides important clues. Studies of such objects have found high-velocity outflows with excess momentum that cannot be explained by radiation-driven outflows (e.g. Bujarrabal et al. 2001) as well as complex morphologies (Sahai et al. 2007; Lagadec et al. 2011). In fact, jets or bipolar outflows are expected to be one of the main agents affecting the morphologies of these systems and of PNe (e.g. Sahai & Trauger 1998; Sahai et al. 2011; Soker 2020). Circumstellar masses derived based on CO observations of post-AGB sources range broadly from 10−2 to 1 M⊙ (Bujarrabal et al. 2001; Sánchez Contreras & Sahai 2012). The different configurations of binary systems leading to the observed post-AGB morphology and CSE components are the subject of current investigations.
Another important diagnostic is the study of the isotopic ratios of the ejected material, which can be interpreted based on our understanding of nucleosynthesis and stellar evolution. The isotopes of oxygen, and specifically the 17O/18O ratio, provide particularly powerful constraints on the initial masses of stars in this mass range. For most low- and intermediate-mass stars, the significant changes to the oxygen isotopic ratios take place between the main sequence and the red giant branch phases, when convective streams in the stellar envelope reach material processed by nucleosynthesis in the stellar interior in a process referred to as the first dredge-up (e.g. Karakas & Lattanzio 2014). There is an overall agreement between different stellar evolution models on the quantitative values of oxygen isotopic ratios after the first dredge-up (De Nutte et al. 2017). However, the expected dependence of this ratio on the initial stellar mass of stars has not been fully validated by observations thus far (Abia et al. 2017). The oxygen isotopic ratios have been extensively studied for AGB stars (e.g. Harris et al. 1987; Smith & Lambert 1990; Hinkle et al. 2016; Abia et al. 2017; Danilovich et al. 2017; De Nutte et al. 2017; Lebzelter et al. 2019), but less often for post-AGB objects.
Stellar evolution models also predict whether or not stars with a given initial mass and metallicity become carbon-rich at the end of the AGB. The increase of the carbon abundance in excess of that of oxygen in the stellar envelope happens for stars with initial mass between ∼1.5 and ∼4 M⊙ during the third dredge-up (Karakas & Lattanzio 2014), which is a mixing event that takes place during the AGB phase itself (Iben & Renzini 1983). The lower mass limit for stars to become carbon rich is defined by whether the enrichment is efficient and proceeds for long enough, while the upper mass limit depends on whether the temperature at the base of the convective envelope is high enough to convert carbon mainly into nitrogen in a process known as hot bottom burning (HBB, e.g. Herwig 2005). The efficiency of the third dredge-up in enriching the stellar envelope with carbon depends on many parameters, including mixing efficiency, AGB lifetimes, and prescriptions for the mass-loss rate included in stellar evolution models (e.g. Stancliffe et al. 2004; Abia et al. 2017; Rees et al. 2024). If HBB takes place, 18O is expected to be very efficiently destroyed leading to very low 18O abundances, but the minimum initial stellar mass for which HBB becomes important is fairly uncertain (Ventura et al. 2018). A few AGB stars with extreme mass-loss rates seem to belong to this class (Justtanont et al. 2012), while no post-AGB stars with very low 18O abundances have been identified thus far to our knowledge. In fact, recent studies of oxygen isotopic ratios in post-AGB stars (Khouri et al. 2021; Alcolea et al. 2022) have indicated that some of the most obscured post-AGB sources have relatively low initial masses (≲3 M⊙), contrary to the expectation that these were more massive stars with initial masses ≳5 M⊙.
A small subclass of post-AGB stars termed water fountains accounts for a significant fraction of the post-AGB objects with determined oxygen isotopic ratios (Khouri et al. 2021). These sources show water maser emission with expansion velocities higher than those of their own OH maser emission, which is not observed in any other class of AGB or post-AGB stars. The water maser emission is thought to arise from the interaction of a nascent jet with a dense CSE (e.g. Imai 2007). The envelopes present tori-like structure oriented mostly perpendicularly to bipolar lobes sculpted by high-velocity jets (Sahai et al. 2017; Gómez et al. 2018; Tafoya et al. 2020). The ejection of large amounts of mass in these systems seems to have occurred ≲100 years ago (e.g. Boboltz & Marvel 2007; Day et al. 2010). The compactness of the emission observed towards water fountains and other highly obscured sources suggests a period of very intense mass loss, which has been proposed to be triggered by interactions with a nearby companion (Khouri et al. 2021; Alcolea et al. 2022). The process experienced by these sources could be connected to the super-wind phase, but whether these are the same (or related at all) remains presently unknown.
Regarding carbon enrichment, a lot of effort has been put into reproducing the mass range for which stars become carbon rich in stellar evolution models. Observations of carbon-rich stars in open clusters indicate that the lower limit in initial mass for forming carbon-rich stars is ∼1.5 M⊙ (Groenewegen et al. 1995) at solar metallicity. A similar limit is obtained by fitting the luminosity function of carbon stars in the Milky Way and satellite galaxies using stellar evolution codes (e.g. Groenewegen 2002), but the initial mass might extend down to ∼1 M⊙ at lower metallicities (Stancliffe et al. 2005). However, the predicted minimum luminosity is high compared to observations. Stellar evolution models are able to reproduce carbon stars with initial masses as low as ∼1.5 M⊙ by including extra mixing for the third dredge-up to be efficient enough (e.g. Weiss & Ferguson 2009; Cristallo et al. 2015; Karakas & Lugaro 2016; Ventura et al. 2018; Goriely & Siess 2018; Rees et al. 2024).
In this paper, we study a small sample of six obscured post-AGB objects and investigate the 17O/18O ratio, their recent mass-loss rates, and the CSE morphology at scales of a few thousand astronomical units (au) using the J = 2 − 1 transitions of isotopologues of CO. In Sect. 2, we list the sample stars and their relevant characteristics from literature. In Sects. 3 and 4, we describe the observations and present the results, respectively. The results are discussed in the context of our current understanding in Sect. 6. Finally, a summary and conclusions are presented in Sect. 7.
2. Sample
2.1. Sample selection
We observed six post-AGB stars selected for having very red colours. To select our sample, we obtained magnitudes in the J band from 2MASS and in the S9W and L18W bands from AKARI using the catalogue by Ita et al. (2010) for post-AGB stars listed in Szczerba et al. (2007). We selected sources with J − L18W > 8 and S9W − L18W > 2. When the magnitudes for AKARI filters were missing, we obtained values by interpolating the spectral energy distribution (SED) of the given source using the VizieR photometry tool. The colour-colour diagram containing the sample of post-AGB stars is shown in Fig. 1. The sources presented in this paper are shown by the blue pentagons, while water fountain sources studied in Khouri et al. (2021) (most of which are not included in the catalogue of Szczerba et al. 2007) are shown by the green squares. Our original sample of post-AGB stars consisted of twenty sources, but only six were successfully observed with ALMA within this project. Four of these (GLMP 950, GLMP 953, AFGL 5385, and HD 187885) are rich in carbon, while the other two (Hen 3-1475 and M1-92) have oxygen-rich composition. The bluer colors of the two oxygen-rich stars in our sample could in principle be linked to a systematic lower absorption opacity of oxygen-rich relatively to carbon-rich dust or to lower gas-to-dust ratios in C-rich sources. This is especially intriguing when considering the similar gas mass-loss rates and timescales derived below. However, the small number of sources in our sample prevents us from investigating this difference further.
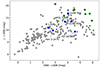 |
Fig. 1. Position of the sources included in our sample in a colour-colour diagram for post-AGB stars. The blue pentagons show the sources included in this study, the green squares represent water fountain sources observed by Khouri et al. (2021), and the grey circles correspond to other known post-AGB stars catalogued by Szczerba et al. (2007). The vertical arrows indicate our assessment that the J-band magnitude of GLMP 950 and GLMP 953 is dominated by contaminating sources close to their position on the sky (see Sects. 4.2 and 4.3 and Appendix C). |
2.2. Relevant information on individual sources
GLMP 950 (IRAS 19454+2920) and GLMP 953 (IRAS 19480+2504) were imaged by Lagadec et al. (2011) at wavelengths between 8 and 13 μm using VISIR/Very Large Telescope (VLT). The authors found GLMP 950 to be spatially resolved in the images, with a somewhat elliptical shape extending in the east-west direction to a maximum size of ∼2″. GLMP 953 was not spatially resolved in the observations with a full-width at half maximum (FWHM) of the Gaussian beam of  .
.
AFGL 5385 (IRAS 17441–2411, Silkworm Nebula) displays an edge-on torus oriented in the southeast-northwest direction and bipolar lobes oriented roughly in the north-south direction. An S-shaped structure is also visible within the lobes. This nebula has been imaged in visible light (Su et al. 1998) and in the near-IR (Su et al. 2003) with the Hubble Space Telescope (HST), and in the mid-IR with T-ReCS/Gemini South (Volk et al. 2007) and VISIR/VLT (Lagadec et al. 2011). The bipolar lobes have a total extent of ∼4″, while the torus has a size of ∼1″.
HD 187885 (IRAS 19500–1709) is commonly classified as a carbon-rich post-AGB star, but its determined elemental abundances indicate a carbon-to-oxygen ratio close to unity (Van Winckel et al. 1996; Van Winckel & Reyniers 2000). The source was also determined to be more metal poor than the Sun, with [Fe/H] = −0.6 (Van Winckel & Reyniers 2000). Lagadec et al. (2011) observed a slightly elliptical source with size ∼3″ at 11.85 and 12.81 μm using VISIR/VLT. They found an inner radius of the CSE of  , which confirmed previous indications from images at 10 and 20 μm obtained using the OSCIR/Gemini North (Clube & Gledhill 2004). Modelling of the spectral energy distribution (SED) indicates a dust mass in the CSE of ∼7 × 10⁻⁴ M⊙ and an associated duration of the high-mass-loss phase of 4000 yr (Clube & Gledhill 2004), where both values have been converted to the distance of 2.4 kpc adopted in this work. As discussed by the authors, under the assumption of a gas-to-dust ratio of 220 these results imply a mass-loss rate of ∼4 × 10⁻⁴ M⊙ yr−1, which is large in comparison to other determinations also through SED modelling (4 × 10⁻⁵ M⊙ yr−1, Guertler et al. 1996). Bujarrabal et al. (2001) found a clear separation between a slow (expansion velocity ∼10 km s−1) and a faster (expansion velocity ∼50 km s−1) components of the outflow in CO emission lines. The authors derived a total circumstellar gas mass of ∼7 × 10⁻³ and ∼2.6 × 10⁻² M⊙ for the fast and slow outflows, respectively, considering a distance of 1 kpc. At the distance of 2.4 kpc adopted by us, the fast and slow outflows would contain masses of ∼4 × 10⁻² and ∼0.15 M⊙, respectively.
Hen 3-1475 (IRAS 17423–1755) displays a bipolar morphology in images in visible light with a northwest-southeast orientation of the lobes and atomic line widths which imply a velocity range of ∼1000 km s−1 (Bobrowsky et al. 1995). Within the bipolar lobes, a point-symmetric structure with knots is visible in emission of atomic lines (Borkowski et al. 1997). Hen 3-1475 is the only post-AGB object where an ultrafast (∼2300 km s−1) collimated jet, presumably in a pristine stage before interacting with the surrounding nebula, has been identified with HST/STIS (Sánchez Contreras & Sahai 2001). The inclination of the ultrafast wind is ∼75° with respect to the plane of the sky, whereas the mean inclination of the nebula (reflecting lobes and CO hourglass) is ∼50°. Borkowski & Harrington (2001) determined a distance of 8.3 kpc to Hen 3-1475 based on proper motions of the jet knots, implying a luminosity of 25 000 L⊙. This led them to conclude that Hen 3-1475 is a massive AGB star or the product of binary evolution. Riera et al. (2003) found a smaller distance (5.8 ± 0.9 kpc), but also suggests a high initial mass based on a nitrogen overabundance reported by Riera et al. (1995). A distance of 5.8 kpc implies a luminosity of ∼12 000 L⊙. Bujarrabal et al. (2001) identified a slow (with expansion velocity ∼7 km s−1) and a faster (with expansion velocity ∼50 km s−1) component in the outflow of Hen 3-1475 based on CO and 13CO J = 1 − 0 and J = 2 − 1 lines. They inferred a mass of 0.16 M⊙ and 0.47 M⊙ for the two dynamical components, respectively, for a distance of 5 kpc. Huggins et al. (2004) derived a circumstellar mass of 0.64 M⊙ based on the measured continuum emission of 5.3 ± 1.2 and 31 ± 4 mJy at 2.6 and 1.3 mm, respectively, for a distance of 5.8 kpc and a gas-to-dust ratio of 100. The CO J = 1 − 0 and J = 2 − 1 lines were most likely affected by optical depth effects and implied a lower limit for the circumstellar mass of 0.19 M⊙. Manteiga et al. (2011) suggest Hen 3-1475 to be a high-mass (M > 3 M⊙) O-rich post-AGB star based on the presence of water ice absorption. We adopted a distance of 5.8 kpc to Hen 3-1475, following Riera et al. (1995).
M1-92 (IRAS 19343+2926, Minkowski’s Footprint) displays a bipolar shape at optical wavelengths (Trammell & Goodrich 1996). The strong molecular emission has been extensively observed and modelled in detail (Bujarrabal et al. 1997; Alcolea et al. 2007, 2022). The lines of the isotopologues of CO have been studied previously. In particular, emission from C17O and C18O have been used to determine a 17O/18O ratio of 1.6 ± 0.15 (Alcolea et al. 2022). Given these detailed studies, we refrain from discussing the morphology of this source extensively in this work and only report the values we measured to highlight any differences with values in the literature.
We adopted distances to each object from Vickers et al. (2015). The only the exception is Hen 3-1475, for which we adopted the value from Riera et al. (1995). The distances used in this work and their respective references are provided in Table 2.
3. Observations
The observations were carried out using the Atacama Large Millimeter/submillimeter Array (ALMA) in the context of project 2021.1.01259.S. The data reduction was performed by the observatory using the standard ALMA pipeline and the Common Astronomy Software Applications for Radio Astronomy (CASA, CASA-Team 2022) versions 6.2.1.7 for HD 187885 and 6.4.1.12 for the other five sources. We obtained the reduced cubes made available through the ALMA archive. The telescope setting was planned in Band 6 so that the J = 2 − 1 lines of C17O (at 224.714 GHz) and C18O (at 219.560 GHz) could be observed in the same frequency tuning. The same line of 13CO (at 220.399 GHz) was also observed in the spectral window used to observe the C18O line. No 12CO line was observed as part of this programme.
The four spectral windows cover frequencies ranging in the rest frame of the sources from ∼219.44 GHz to ∼221.31 GHz, ∼222.93 GHz to ∼224.80 GHz, ∼234.05 GHz to ∼234.92 GHz, and ∼235.95 GHz to ∼237.81 GHz. The exact frequency ranges varied slightly from one source to the other. We adopted an absolute flux calibration uncertainty of 10%1. This does not apply to the calculations of line ratios, for which the relative flux calibration is much more accurate. Hence, the relative flux calibration between the different molecular lines is negligible compared to the uncertainty from integrating the line emission.
The details of the obtained cubes are given in Table 1. The resolution of the maps varies between  and
and  for the different sources, while the sensitivity in the continuum-subtracted maps varies between 1.6 and 2.5 mJy/beam for a channel resolution of ∼1 MHz (∼1.4 km s−1). The maximum recoverable scale (MRS) is significantly larger than the extent of all sources in any given channel, with the exception of the continuum emission in M1-92 (see below). Even in this case, the observations presented here seem to recover all continuum emission as discussed in Sect. 4.7. The continuum maps produced by the ALMA pipeline include the four spectral windows and have a representative frequency of 228.6 GHz, which corresponds to a wavelength of 1.31 mm.
Parameters of the observations for each source.
4. Observational results
The J = 2 − 1 lines of the three targeted isotopologues of CO (13CO, C17O, and C18O) were detected for all sources. About 30 other lines emitted by ∼10 other molecules were also detected (https://zenodo.org/records/14615590). The vast majority of these lines was detected only towards the C-rich sources GLMP 950 and GLMP 953. The detections towards these two sources include lines assigned by us to NaCl, SiC2, K37Cl (tentative), and HC3N. We also detect a few unidentified lines. The spectra of the two other C-rich sources display almost no lines besides those from CO isotopologues, with only an HC3N line detected towards AFGL 5385, and no other lines detected towards HD 187885. The lack of lines in the spectrum of HD 187885 might be caused by its low initial metallicity.
The two O-rich sources show a smaller number of lines. Hen 3-1475 is the most line rich of the two, with five lines detected besides those from CO isotopologues. We assign the detected lines to emission from SO, SiS, and SO2. M1-92 shows emission lines of SO and SO2.
4.1. Methodology for line and continuum measurements
To determine the sizes of the apertures for measuring the 13CO, C17O, and C18O J = 2 − 1 line emission and the continuum fluxes, we employ the following procedure. First, we obtain the line profiles from circular regions with 5″ in diameter for each source. Then, we measure the full-width at zero intensity of the C17O and C18O J = 2 − 1 lines, which are very similar for all sources. Using the velocity range measured for the C18O J = 2 − 1 line, we produced moment-zero (integrated in velocity) maps of the 13CO J = 2 − 1 line. This was done to obtain a map of the brightest line (13CO J = 2 − 1), while excluding any velocity components not detected in C18O J = 2 − 1. If the contour marking emission three times above the root mean square (3-σ) of this 13CO J = 2 − 1 moment-zero map was larger than the 5″ aperture, we used an aperture of 7″ instead, which proved sufficiently large to enclose the 3-σ contour for all sources. We use circular apertures of similar size when possible for simplicity because the uncertainties introduced by the aperture shape are small for sources that are nearly circular. Following this procedure, we obtain aperture diameters of 5″ for GLMP 950 and Hen 3-1475 and 7″ for GLMP 953, AFGL 5385, and HD 187885. For M1-92, we integrated the emission with a non-circular aperture equal to the 3-σ contour. This was motivated by the very elongated morphology and large size of the emission region in M1-92 (see Appendix B). The high-velocity emission discussed below observed towards different sources are produced in regions within the circular apertures described above for all sources but Hen 3-1475. Hence, to obtain the spectra of the high-velocity component of Hen 3-1475, we used a rectangular aperture oriented along the axis of the high-velocity emission as described below. The obtained moment-zero maps of the C13O, C17O, and C18O J = 2 − 1 lines are available through in Appendix B.
The continuum emission is expected to be dominated by dust emission at these wavelengths, with only a very small contribution from free-free emission at 1.3 mm for the two objects with B-type central stars, Hen 3-1475 and M1-92 (see e.g. Sánchez Contreras et al. 2017). The continuum flux density reported in Table 1 were obtained by integrating the emission within the same apertures used to extract the line profiles, and, hence, adapted to fully enclose the emitting area of each source. The FWHM sizes of the continuum emission reported below were measured using the Interactive 2D fitting tool in CASA to fit a Gaussian function convolved with the beam to the maps in the image plane. Hence, the sizes we report are beam-deconvolved FWHM of the best-fitting Gaussian distributions. The measured continuum flux density, position of the emission centre, and continuum FWHM are given in Table 2. All coordinates throughout the paper are given in the equatorial system (J2000).
Parameters obtained from the literature and measured values of the continuum emission for the sample stars.
4.2. GLMP 950 (IRAS 19454+2920)
The continuum image and the line profiles of the 13CO, C17O, and C18O J = 2 − 1 extracted towards GLMP 950 from a circular region centered on the source and with 5″ in diameter are shown in Fig. 2. The line fluxes obtained from integrating the J = 2 − 1 lines from 13CO, C17O, and C18O over the same region are given in Table 3.
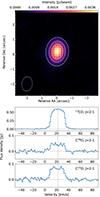 |
Fig. 2. Continuum (1.3 mm) and J = 2 − 1 13CO, C18O, and C17O line emission towards GLMP 950. Top: Maps of the continuum (colour map) and 13CO J = 2 − 1 emission integrated over the whole line emission (contours) at 10%, 30%, 50%, and 70% of the peak value (6.2 Jy beam−1 km s−1). The continuum emission peaks at |
Observed fluxes of the J = 2 − 1 lines and angular sizes of the emission region (Δθ3σC18O) and full widths at zero intensity (ΔυC18O) of the C18O J = 2 − 1 line.
4.2.1. Continuum
The original pointing direction was  and
and  based on the visible position assigned by the SIMBAD database (Wenger et al. 2000) at the time of our observations, which was that of the source Gaia DR3 2031794791233840128 (Gaia Collaboration 2021). That position also corresponds to the near-infrared source 2MASS J19472480+2928108. However, we detected a millimetre (mm) continuum source at
  and
and  , which lies
  away from the 2MASS and Gaia coordinates. We inspected publicly available Spitzer/IRAC images downloaded from the IRSA archive, and noticed two individual sources, one at the optical/near-infrared position and another one at the location of our mm source (https://zenodo.org/records/14615590). The latter is brighter at longer Spitzer wavelengths. We conclude that our mm source corresponds to the far-infrared source IRAS 19454+2920 and the GLMP entry. Therefore, the position we report is the actual position of GLMP 950.
The fit of an elliptical Gaussian source to our continuum image reveals a deconvolved FWHM significantly smaller than the beam, with a major axis of 485 ± 40 milliarcsecond (mas), a minor axis of 390 ± 30 mas, and a position angle of 170 ± 20°. The orientation we find is similar to that of the beam and, hence, it is unclear whether this an observational effect or a real feature. Moreover, the orientation reported by Lagadec et al. (2011) in the mid-IR (∼100°) is significantly different from the one we find. Higher-angular-resolution observations are necessary to confirm whether this difference is real given the small size of the source compared to the resolution of the observations we report. A flux density of 5.0 ± 0.5 mJy is recovered from the fit. A slightly larger flux density, of 5.2 ± 0.6 mJy is obtained from integrating the continuum image within a region of 5″ in diameter.
4.2.2. Line emission
The bulk of the emission in the 13CO J = 2 − 1 line is seen at velocities, |υ − υLSR|≲16 km s−1 from the systemic velocity with respect to the local standard of rest (LSR), υLSR ≈ 22 km s−1, while a weaker component extends to |υ − υLSR|≲20 km s−1. Integrating the 13CO J = 2 − 1 line over the interval 16 km s−1 ≤ |υ − υLSR|≤20 km s−1 produces maps that peak essentially at the same position as that produced by integrating the central region of the line, |υ − υLSR|≤16 km s−1. Hence, no sign of a more complex morphology of the line emission as a function of velocity was detected at the resolution of the observations we report here.
A Gaussian fit to the map produced integrating the 13CO J = 2 − 1 line over the whole profile reveals an essentially circular source with deconvolved FWHM of major and minor axes of  and
and  , respectively, and an unconstrained position angle.
We see that neither the continuum nor the moment-zero maps of the 13CO J = 2 − 1 line reveal a significantly elongated source. This differs from the 2″ east-west source size reported by Lagadec et al. (2011) from observations of dust emission in the mid-IR.
4.3. GLMP 953 (IRAS 19480+2504)
The continuum image and the profiles of the 13CO, C17O, and C18O J = 2 − 1 lines extracted towards GLMP 953 using an aperture of 7″ centered on the continuum peak are shown in Fig. 3. The fluxes of the J = 2 − 1 lines of 13CO, C17O, and C18O integrated over the same region are given in Table 3.
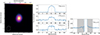 |
Fig. 3. Continuum (1.3 mm) and J = 2 − 1 13CO, C18O, and C17O line emission towards GLMP 953. Left: Maps of the continuum (colour map) and high-velocity line emission (contours). The continuum peak is at |
4.3.1. Continuum
Similarly to the case of GLMP 950 mentioned above, the original pointing direction was  and
and  , based on the position reported in the SIMBAD database (Wenger et al. 2000), which corresponds to the optical source Gaia DR3 2026709201998745472 (Gaia Collaboration 2021), also positionally coincident with the near-IR source 2MASS J19500826+2512008 (Cutri et al. 2003). However, we detected a mm continuum source centered at
  and
and  . The position we find differs by
  from those in the Gaia and 2MASS catalogues. Spitzer/IRAC images also show two distinct sources (https://zenodo.org/records/14615590), one coinciding with the position of the mm continuum and another coinciding with the optical/near-IR source, which is significantly weaker in all Spitzer bands. We thus conclude that our position (rather than the one reported by SIMBAD at the time of our observations) corresponds to that of the GLMP entry and the far-IR source IRAS 19480+2504, and should be adopted as the actual position of GLMP 953.
By fitting an elliptical Gaussian to the mm-continuum source, we obtained a nearly circular intensity distribution, with deconvolved FWHM of 240 ± 20 mas along the major axis and 225 ± 10 mas along the minor axis, which is roughly a factor of four smaller than the beam size. The position angle and the flux density retrieved from the fit are 170 ± 70° and 118 ± 12 mJy, respectively. Integrating the continuum emission within an aperture of 5″ in diameter reveals an essentially equal value of 119 ± 12 mJy. The size we report here is consistent with the unresolved source between 8 and 13 μm reported by Lagadec et al. (2011) based on observations with a beam size of  .
.
4.3.2. Line emission
Most of the emission in the 13CO J = 2 − 1 line lies within |υ − υLSR|≲16.5 km s−1 with υLSR ≈ 42 km s−1. A weaker, higher-velocity component extending roughly between −60 km s−1 and 125 km s−1 is also observed. Hence, the total line width is ∼185 km s−1. Integrating the emission from the high-velocity component, from |υ − υLSR|≳16.5 km s−1 to the extreme of the line wings (range marked in gray in Fig. 3), reveals emission regions slightly offset from the centre of the continuum peak. The distance between the centers of the red- and blue-shifted high-velocity components is  and the position angle is ∼ − 10°, with a high associated uncertainty because of the small separation between the two components.
4.4. AFGL 5385 (IRAS 17441–2411: Silkworm Nebula)
The continuum image and the profiles of the 13CO, C17O, and C18O J = 2 − 1 lines extracted towards AFGL 5385 using a circular region with 7″ in diameter are shown in Fig. 4. The fluxes of the J = 2 − 1 lines of 13CO, C17O, and C18O integrated over the same region are given in Table 3.
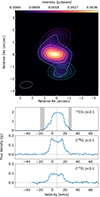 |
Fig. 4. Continuum (1.3 mm) and J = 2 − 1 13CO, C18O, and C17O line emission towards AFGL 5385. Top: Maps of the continuum (colour map) and high-velocity line emission (contours). The continuum peaks at |

4.4.1. Continuum
Fitting a Gaussian source, we obtained deconvolved FWHM axes of  and
and  and a position angle of 59° ±8°. The integrated flux density obtained from the fit is 11.8 ± 1.3 mJy. The continuum map shows an S-shaped morphology with two extensions in a roughly perpendicular direction to the elliptical central source. These reach
  in radius from the centre, and are not captured by the Gaussian fit. Including these extensions in the continuum integration using the 7″ aperture leads to a flux density of 12.9 ± 1.4 mJy.
An additional point-like source is detected at  and
and  , namely, at
  (∼2.5 × 10⁴ au at 3.4 kpc) to the east of AFGL 5385. The flux density of this second source peaks at 0.4 mJy, which is ∼9 times above the root-mean-square noise level of the continuum map. The continuum image including this additional source is available in Appendix D. It is unclear whether this second 1.3 mm continuum source is associated with AFGL 5385, or is a field object. The brightness ratio between the two sources at 1.3 mm and the coincidence of the position of the 1.3 mm emission of AFGL 5385 and that from the 2MASS maps imply that this secondary source does not affect the photometry obtained towards AFGL 5385 in a significant way.
4.4.2. Line emission
We obtained υLSR ≈ 7 km s−1 based on the approximate centres of the C18O and C17O J = 2 − 1 lines. However, this value leads to the main component of the 13CO J = 2 − 1 line exhibiting more red-shifted than blue-shifted emission, which could be a sign of relatively high optical depths affecting the 13CO line shape as this produces the well-known effect of blue-wing self-absorption (Morris et al. 1985).
The bulk of the 13CO J = 2 − 1 line emission arises from −2.5 km s−1 ≲ υ ≲ 20 km s−1. A weaker, higher velocity component extending from υ ≈ −19 km s−1 to υ ≈ 30 km s−1 is also present. Interestingly, the line shape of this higher-velocity component is much more symmetric about the systemic velocity. This reinforces the suggestion that the velocity shift observed in the bulk of the 13CO J = 2 − 1 emission is due to optical depth effects in the CSE.
Integrating the higher-velocity components in frequency over the interval marked in gray in Fig. 4 reveals emission produced by gas offset from the position of the continuum. The displacement of the emission peak in the integrated images with respect to the continuum peak is  for the red-shifted emission and
  for the blue-shifted emission. The high-velocity gas appears where the extensions of the continuum emission are also seen.
The position angle of the continuum emission region at millimeter wavelengths (59° ±8°) differs significantly from that observed in the mid-IR of ∼130° (Volk et al. 2007; Lagadec et al. 2011). Nonetheless, the S-shaped profile seen in those images is also clearly visible in the images we present. The emission regions of the higher-velocity gas are aligned roughly in the north-south direction, in apparent agreement with the orientation of the bipolar nebula seen in visible light (Su et al. 1998). This high-velocity emission also follows the tips of the S-shaped continuum emission region. The total size of the emission region of the 13CO J = 2 − 1 line is ∼5″, which is comparable to the size of the bipolar lobes in the HST images (Ueta et al. 2007) and of the mid-IR nebulosity (Lagadec et al. 2011).
4.5. HD 187885 (IRAS 19500–1709)
The continuum image and the profiles of the 13CO, C17O, and C18O J = 2 − 1 lines extracted towards HD 187885 using a circular region, with 7″ in diameter, are shown in Fig. 5. The fluxes of the J = 2 − 1 lines of 13CO, C17O, and C18O integrated over the same region are given in Table 3.
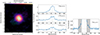 |
Fig. 5. Continuum (1.3 mm) and J = 2 − 1 13CO, C18O, and C17O line emission towards HD 187885. Left: Maps of the continuum (colour map) and high-velocity line emission (contours). The continuum peaks at |

4.5.1. Continuum
The continuum source is spatially resolved by the observations, with a Gaussian fit revealing an elongated morphology with a deconvolved FWHM of  for the major axis and of
  for the minor axis and a position angle of 39° ±12°. The flux density obtained with the fit is 6.1 ± 0.6 mJy. Integrating the continuum using an aperture of 7″ in diameter reveals a similar flux density of 6.3 ± 0.3 mJy. This value is consistent with the upper limit reported for the flux density of this source at 1.2 mm of 23 mJy by Dehaes et al. (2007). The observations we report do not reveal an inner cavity in the disk as spotted in the mid-IR by Lagadec et al. (2011) and suggest based on modelling by Clube & Gledhill (2004) before, but this is most likely due to the worse spatial resolution of the ALMA data relatively to that from VISIR.
4.5.2. Line emission
The profile of the 13CO J = 2 − 1 line (Fig. 5) shows three different components. The central and intermediate components comprise velocities |υ − υLSR|≲11 km s−1 and |υ − υLSR|≲27 km s−1, respectively, with υLSR = 25 km s−1. The high-velocity component is significantly weaker and spans a velocity range of ∼145 km s−1.
Integrating the emission of this high-velocity component over the spectral region indicated in gray in Fig. 5 reveals two elongated structures that extend away from the continuum peak in opposite directions. The elongations also curve in opposite directions, suggesting a point-symmetric structure. The continuum is elongated in a direction perpendicular to that of the high-velocity outflow. The red-shifted feature seems to align well with an emission hole in the 8.59 μm images presented by Lagadec et al. (2011). Any potential physical connection between these two features remains unknown.
The peak value of the 13CO J = 2 − 1 line (2.45 Jy) is compatible with the value of 2.6 Jy observed by Bujarrabal et al. (2001) using the IRAM 30m telescope. We converted the main beam temperature presented by the authors to flux density using historic values for the efficiencies of the IRAM 30m telescope available at the website of the observatory. Therefore, given the similarity between the two flux values and the beam size of the IRAM 30m telescope, which covers the entire extent of the nebula, the structures traced by our ALMA observations contain most of the emission in the 13CO J = 2 − 1 line, with no significant emission coming from more extended structures.
4.6. Hen 3-1475 (IRAS 17423–1755)
The continuum image and the profiles of the 13CO, C17O, and C18O J = 2 − 1 lines extracted towards Hen 3-1475 using a circular region with 5″ in diameter are shown in Fig. 6. The fluxes of the J = 2 − 1 lines of 13CO, C17O, and C18O integrated over the same region are given in Table 3.
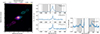 |
Fig. 6. Continuum (1.3 mm) and J = 2 − 1 13CO, C18O, and C17O line emission towards Hen 3-1475. Left: Maps of the continuum (colour map) and high-velocity line emission (contours). The continuum peaks at |


4.6.1. Continuum
The continuum emission is spatially resolved in the observations and a fit of an elliptical Gaussian source provides a deconvolved FWHM of  . Since the source is closer to appearing circular on the sky, the position angle is not well constrained. The Gaussian fit reveals a flux density of 27 ± 3 mJy. By integrating the continuum using a circular aperture of 5″ in diameter, we obtain a flux density of 29 ± 3 mJy. These values are consistent with the previous determination of 31 ± 4 mJy (Huggins et al. 2004).
4.6.2. Line emission
The υLSR of ∼49 km s−1 was derived using the peak of the narrow feature in the C18O and C17O lines and it agrees fairly well with the peak of the 13CO line. Different velocity components are observed in the lines of the CO isotopologues. A central core is apparent in the lines of C18O and C17O between velocities |υ − υLSR|≲9 km s−1 (with υLSR = 48.5 km s−1), but it is less clearly discernible in the 13CO line. Wings extending up to |υ − υLSR|≲45 km s−1 are prominent even in the lines of the two rarer isotopologues. In the 13CO line, the wings extend to even higher velocities |υ − υLSR|≲65 km s−1. The difference between the velocity range spanned by the wings in the different lines is most likely only due to the higher signal-to-noise ratio (S/N) in the 13CO line. The tips of these wings are marked in dark gray in Fig. 6. Integrating the line emission over this spectral region reveals emission regions with peaks offset from the continuum peak emission by  and
and  for the blue-shifted and red-shifted components, respectively.
The peak of the emission in the 13CO J = 2 − 1 line (∼0.9 Jy) is comparable to the single-dish measurements of ∼0.7 Jy (Bujarrabal et al. 2001). The flux density was again calculated using historic values for the efficiencies of the IRAM 30m telescope. The difference is most likely due to the uncertainty in flux calibration of the single-dish data and implies that no flux is lost in the ALMA data we present.
At larger scales (up to ∼8″ from the central source), we find an even weaker component of the 13CO line, which is marked in intermediate-dark and light gray in Fig. 6. To maximise the S/N of the high-velocity spectral features, we extracted spectra using a rectangular aperture of 3.5″ × 17″ and oriented along the high-velocity-emission direction (Fig. 6). This emission appears at more extreme projected velocities up to ∼240 km s−1 from the υLSR. Integrating over the intermediate-dark spectral regions reveals two emission regions with peak emission offset from the continuum peak by ∼4″ for the blue- and red-shifted components. Emission at the extreme-velocity component (marked in light gray), at projected velocities of ∼240 km s−1 from the υLSR, are produced even farther away. Hence, there is a positive velocity gradient in this high-velocity, point-symmetric molecular emission. To our knowledge, this is the first time these components with projected expansion velocities > 50 km/s have been detected towards Hen 3-1475 in observations of molecular lines. Previous observations recovered only the central component of the line with projected velocities up to ∼50 km s−1 from the υLSR (e.g. Bujarrabal et al. 2001; Huggins et al. 2004).
Interestingly, two different orientation directions can be identified in the high-velocity outflow. The inner, lower-velocity emission component displays a position angle relative to the north direction of ∼ − 70°, while the outer, higher-velocity components display a position angle of ∼ − 45°. In both cases, point symmetry about the continuum peak is observed.
4.7. M1-92 (IRAS 19343+2926, Minkowski’s Footprint)
The continuum image and the profiles of the 13CO, C17O, and C18O J = 2 − 1 lines extracted towards M1-92 using a region equal to the 3-σ contour of the 13CO J = 2 − 1 line are shown in Fig. 7. The fluxes of the J = 2 − 1 lines of 13CO, C17O, and C18O integrated over the same region are given in Table 3.
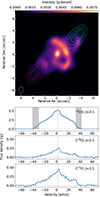 |
Fig. 7. Continuum (1.3 mm) and J = 2 − 1 13CO, C18O, and C17O line emission towards M1-92. Top: Maps of the continuum (colour map) and high-velocity line emission (contours). The continuum peaks at |
4.7.1. Continuum
The continuum emission shows a complex morphology with many different components. In light of this, we chose not to fit a Gaussian source to the continuum maps. We obtained an integrated flux density of 130 ± 13 mJy by integrating the emission over the 3-σ emission contour of the 13CO J = 2 − 1 line. This is very similar to the value of 127 ± 13 mJy obtained from integrating the emission over a circular region with diameter of 12″. The observed value agrees within uncertainties with previous single-dish measurements (between 90 and 120 mJy Sánchez Contreras et al. 1998, 2017). Hence, no loss of flux is caused by the relatively large extent of the continuum emission.
4.7.2. Line emission
The line peaks indicate a systemic velocity of ∼2 km s−1. The lines are about 85 km s−1 broad and tentatively display two main components: a central one spanning a range of velocities of |υ − υLRS|≲10 km s−1, appearing on top of the broader emission. The central component appears stronger relative to the broader component in the 13CO line than in those of the rarer isotopologues. However, the distinction between the two components is not very clear, and might not reflect two distinct physical velocity structures. Integrating the high-velocity end of the line profiles reveals two emission regions that peak just outside of the region from where the continuum arises and in the same region as extensions are observed in the continuum emission.
5. Analysis
Based on the observed angular sizes of the emission regions and the strengths of the J = 2 − 1 lines of 13CO, C17O, and C18O listed in Table 3, we derived linear sizes of the C18O emission region based on the assumed distances (ΔD3σC18O), 17O/18O ratios, circumstellar masses (Mgas), recent mass-loss rates (Ṁ), and 13CO abundances (f13CO). Based on the 17O/18O ratios we obtain, we inferred initial masses using the MONASH ( ) and FRUITY (
 ) models, maximum luminosities using the evolutionary models of Miller Bertolami (2016) (LPAGB), and maximum distances given these luminosities (dmax). These derived quantities are given in Table 4. For these calculations, we assume optically thin emission and an excitation temperature, Texc, of 10 K for all three isotopologues of CO. The value of the excitation temperature is motivated by the low values usually observed towards post-AGB stars with high molecular content (Bujarrabal et al. 2001).
For the calculation of the 17O/18O ratios, total circumstellar masses and 13CO abundances, we used the line fluxes extracted from the regions enclosing the 3-σ contour of the 13CO J = 2 − 1 moment-zero maps for each source as discussed above. The line fluxes obtained from these regions are referred to as S13CO, SC17O, and SC18O. For the calculation of the mass-loss rates at the end of the AGB (Ṁ), we measure the C18O J = 2 − 1 line fluxes extracted from smaller regions defined by the 3-σ contours of the C18O J = 2 − 1 line (see Appendix B), with sizes of Δθ3σC18O (Table 3).
5.1. 17O/18O isotopic ratios
We used the observed fluxes of the J = 2 − 1 lines of C17O and C18O to infer the 17O/18O ratio. For this, we assumed that the 17O/18O isotopic ratio is equal to the C17O/C18O abundance ratio. Given the low value assumed for the excitation temperature (10 K) and the slightly different energy levels of C17O and C18O, the fractions of molecules in the J = 2 level differ between the two isotopologues. Considering the excitation effects and the different Einstein-A coefficients and central frequencies of the lines (ν°), the 17O/18O ratio can be derived from the line flux ratio using
![$$ \begin{aligned} \frac{{^{17}\mathrm O}}{{^{18}\mathrm O}} = \frac{{S\!}^\mathrm{C^{17}O}_{J=2{-}1}}{{S\!}^\mathrm{C^{18}O}_{J=2{-}1}} \frac{[A \nu _\circ ]_{J=2{-}1}^\mathrm{C^{18}O}}{[A \nu _\circ ]_{J=2{-}1}^\mathrm{C^{17}O}} \frac{Q^\mathrm{C^{17}O}}{Q^\mathrm{C^{18}O}} e^{(E^\mathrm{C^{17}O}_{J=2}-E^\mathrm{C^{18}O}_{J=2})/kT_{\rm exc}} \approx 0.95 \frac{{S\!}^\mathrm{C^{17}O}_{J=2{-}1}}{{S\!}^\mathrm{C^{18}O}_{J=2{-}1}}, \end{aligned} $$](/articles/aa/full_html/2025/02/aa52500-24/aa52500-24-eq69.gif)
where S, Q, E, and k are the frequency-integrated line flux density, the partition function, the energy of the upper state, and the Boltzmann constant, respectively. The small difference between the energies of the J = 2 levels of C17O and C18O implies that assuming an excitation temperature of 40 K instead of 10 K causes the derived abundance ratio to be only ∼3% lower for a given observed line ratio. Hence, the isotopic ratios we obtain are virtually independent of the assumed excitation temperature as long as the excitation of both molecules is at the same level. The derived isotopic ratios are given in Table 4.
5.2. Circumstellar gas masses, recent mass-loss rates, and 13CO abundances
The molecular abundance with respect to hydrogen is a critical parameter required to derive the hydrogen gas masses in the CSEs from observed molecular lines. Since the abundances of the CO isotopologues at the end of the AGB vary significantly as a function of stellar mass, we selected the isotopologue with the smallest expected change for this calculation, C18O. For stars with initial masses between 1 and 4 M⊙, the final 18O abundance is at most ∼30% lower than the initial value for the models of Karakas & Lugaro (2016), with more massive stars reaching larger differences than lower-mass ones. For comparison, the final 13C and 17O abundance can vary by an order of magnitude or more from the initial value. For the circumstellar mass calculations, we assume an average value of the 18O (and C18O) abundance, fC18O, of 8.5 × 10⁻⁷ relative to the number of hydrogen nuclei (Karakas & Lugaro 2016), which is based on an initial solar abundance of ∼1.1 × 10⁻⁶. For HD 187885, which has been determined to have a lower metallicity (Z = 0.0035), we adopt an abundance of 2.1 × 10⁻⁷, also based on the models presented by Karakas & Lugaro (2016). The total circumstellar gas mass is calculated using the following expression
where d is the distance to the source, gJ = 2 is the statistical weight of the J = 2 level, and MH and mH are the total hydrogen mass and the mass of a hydrogen atom, respectively. The factor 0.7 corresponds to the approximate fraction of the total mass accounted for by hydrogen at the end of the AGB (Karakas & Lugaro 2016). The derived circumstellar gas masses are given in Table 4.
The recent mass-loss rates are determined using Eq. (1) with SC18O replaced by  . This approach is chosen because most of the C18O J = 2 − 1 emission is produced in smaller regions than those defined by the 3-σ13CO J = 2 − 1 contours (see Appendix B). The kinematic ages (Δt) of the C18O J = 2 − 1 emission regions are also determined using the 3-σ C18O J = 2 − 1 contours. The line widths used for the calculation of the kinematic ages of the C18O J = 2 − 1 emission regions correspond to the widths of the C18O J = 2 − 1 line profiles at zero intensity. Using the derived expansion velocity, the size of the emission region and the adopted distances, we determined kinematic ages of the C18O J = 2 − 1 emission (Δt). Based on these ages and on the gas masses within the 3-σ C18O J = 2 − 1 regions, we determine a recent mass-loss rate for each source. These mass-loss rates represent lower limits to the maximum mass-loss rates experienced by each source recently, because the phase of high AGB mass loss probably ceased even hundreds of years ago for some sources (see Sect. 6.4).
Using an analogous expression to Eq. (1), we also derive the 13CO abundance relative to hydrogen nuclei (f13CO) that would make the estimated gas masses consistent with those derived based on the C18O J = 2 − 1 line. Although we assume optically thin emission, optical depth effects seem to affect the 13CO emission to some extent because for all sources the brightness temperatures observed towards the peak of the integrated emission reach values (between 7 and 13 K) comparable to the excitation temperature we assume. If our assumed excitation temperature is correct, this implies optical depths ≳1. Nonetheless, the relatively high values of the 13CO abundances we derive (see below) suggest that the optical depth effects are not very strong.
6. Discussion
6.1. Isotopic ratios
The 17O/18O isotopic ratios allow us to estimate the initial masses of the sample stars using results from stellar evolution models. These are powerful constraints for understanding the properties and evolution of these sources, and allow us to infer stellar luminosities and distances and investigate whether the sources with known spectral types have evolved within the expected timescales.
6.1.1. Comparison to other sources
To put the values of the 17O/18O ratios determined for the sample stars in context, we compare them to those available in the literature for AGB stars using the sample of C-rich AGB stars studied by Abia et al. (2017), with a total of 29 objects, and the samples of O-rich AGB stars studied by Hinkle et al. (2016) and Lebzelter et al. (2019), which include a total of 80 sources.
The minimum and maximum values reported by Abia et al. (2017) for C-rich sources are ∼0.5 and ∼2.5. Only three sources (∼10%) display ratios ≲0.6. Hence, the values we obtain for AFGL 5385 (0.61) and HD 187885 (0.59) do occur in AGB stars as well, but are relatively rare. The values we report for GLMP 950 and GLMP 953 are very typical for C-rich AGB stars based on the sample of Abia et al. (2017). The value of the 17O/18O ratio is not expected to change during the AGB or post-AGB for stars that become rich in carbon and do not experience HBB. Hence, comparing the values for post-AGB and AGB C-rich stars is meaningful. Nonetheless, we note that a direct comparison of the observed distributions is not straight-forward, because the duration of the carbon-rich phase in the AGB and that of the post-AGB phase depend strongly on initial mass and metallicity.
The 17O/18O ratios reported by Hinkle et al. (2016) and Lebzelter et al. (2019) for O-rich AGB stars cover a broad range of values, from ∼0.05 to ∼16. Nonetheless, extreme values are relatively rare, with only ∼11% having ratios lower than 0.2 and ∼11% having values larger than 2. Hence, the values we obtain for Hen 3-1475 (1.29) and M1-92 (1.8) are typical for O-rich AGB stars. However, we emphasise that these ratios were determined at different points during the AGB for each source, and at least some of the O-rich stars studied by Hinkle et al. (2016) and Lebzelter et al. (2019) will become C-rich or experience HBB before entering the post-AGB phase.
Observations of isotopic ratios in post-AGB stars are much rarer, and to our knowledge only six C-rich and ten O-rich sources have had 17O/18O ratios determined thus far (Khouri et al. 2021; Gallardo Cava et al. 2022; Alcolea et al., in prep.). These samples are also heavily biased by observations of specific subgroups of post-AGB stars, such as the eight O-rich water fountain sources studied by Khouri et al. (2021). The observed values range roughly from 0.3 to 4 for C-rich objects and from 0.2 to 6 for O-rich ones. Hence, the values reported by us are within the observed ranges.
6.1.2. Derived initial masses
We compared the isotopic ratios derived in this work to stellar evolution models using the MONASH code (Karakas & Lugaro 2016; Karakas et al. 2018) and the FRUITY database (Cristallo et al. 2015). These models assume a solar-like composition scaled to different metallicities. While there is no strong disagreement between the predictions of the models regarding the first dredge-up, which has the dominant effect on the oxygen isotopic ratios for stars with initial masses ≲4 M⊙, the effects of the third dredge-up are much more uncertain (e.g. Palmerini et al. 2021). The uncertain aspects relative to the third dredge-up relevant for the analysis presented here concern the mass ranges for which stars become carbon rich and for which HBB destroys 18O in the stellar envelope efficiently.
The observed isotopic ratios imply remarkably similar initial masses for a given metallicity for the two models. The derived values are given in Table 4 for solar metallicity, with the exception of HD 187885 for which we consider a metallicity Z = 0.0035 (Van Winckel & Reyniers 2000). M1-92 is the only object with a previous determination of the 17O/18O ratio. Our value of 1.8 ± 0.1 is in agreement within uncertainties with the value reported in the literature (1.6 ± 0.15, Alcolea et al. 2022). The value that we obtain implies an initial mass ∼1.8 M⊙ for solar composition, similar to the value obtained by Alcolea et al. (2022), ∼1.7 M⊙.
While the MONASH and FRUITY models with the exact metallicity of HD 187885 ([Fe/H] = −0.6, or Z = 0.0035) are not available in the literature, we can conclude that the predicted trends in the 17O/18O ratio with metallicity imply an initial mass smaller than < 1.3 M⊙ in both cases. In the case of the MONASH code, the predicted 17O/18O ratios imply an initial mass of ∼1.15 M⊙ for Z = 0.0028 (Karakas et al. 2018), which is the closest metallicity to that of HD 187885 for which the models have been calculated. For the FRUITY database, the models with lowest initial mass available (1.3 M⊙) predict larger 17O/18O values for both Z = 0.003 and Z = 0.006, and the predicted value decreases with decreasing initial mass in this range. The relatively low mass and carbon-rich nature of this source is in agreement with the findings from Karakas et al. (2018), which imply that stars with masses as low as 1.15 M⊙ become rich in carbon by the end of the AGB for Z = 0.0028. Hence, the initial mass of HD 187885 seems to be very close to the minimum mass required for becoming a carbon star given its initial metallicity. We note that the models of Karakas et al. (2018) assume initial isotopic ratios equal to solar even at lower metallicities, which might not be representative of the initial isotopic ratios of HD 187885. Our results imply initial masses for GLMP 950 and GLMP 953 (1.8 and 1.7 M⊙, respectively) within the range usually attributed to carbon stars.
Interestingly, the derived initial masses for Hen 3-1475 and M1-92 also fall in the range expected for stars to become carbon rich. The fact that these sources are observed to still be oxygen rich in the post-AGB phase might be explained by an interrupted evolution, for instance with the envelope being ejected by interactions with a close companion (e.g. Khouri et al. 2021; Alcolea et al. 2022). Alternatively, these sources might have an initial metallicity higher than solar and initial masses between 2.0 to 2.4 M⊙. In this scenario, their O-rich nature could be consistent with stellar evolution models, which remain oxygen rich up to initial masses ∼2.4 M⊙ at higher metallicity (e.g. Z = 0.03).
Despite the encouraging agreement between the two evolutionary models considered for the interpretation of the derived 17O/18O ratios, we note that the initial masses we derive are fairly uncertain both because of uncertainties in the model calculations and in the initial composition of these sources. More robust results can be obtained using larger statistical samples.
6.1.3. Implications for luminosities and distances
The initial masses we derive are relatively low, and set limits on the maximum luminosities reached by each star. To assess how these limits compare to our assumptions, we determine the maximum expected post-AGB luminosity for each source from evolutionary models presented by Miller Bertolami (2016) given the inferred initial masses. Using these luminosities (presented in Table 4), we scaled the distance for each sources based on the luminosities adopted from the literature (Table 2). These distances are also given in Table 4. The distances for GLMP 950, GLMP 953, HD 187885, and M1-92 are consistent with those adopted from the literature with differences < 10%, while those for AFGL 5385 and Hen 3-1475 show larger discrepancies of 30% and 22%, respectively. Nonetheless, considering the uncertainties in the derived initial masses and on the determination of distances, the overall agreement is good. We note that distances up to 8.3 kpc have been reported for Hen 3-1475 (Borkowski & Harrington 2001). Our results indicate that such large distances are not realistic. Riera et al. (2003) derived a distance of 5.8 kpc based on improved measurements of radial velocities and proper motions of the jet features. Our results suggest an even smaller distance which, based on the discussion in Riera et al. (2003), implies a larger value (≳55°) for the inclination angle of the jet than what is assumed in their calculations (50°).
6.1.4. Implications for post-AGB lifetimes
Given the definition of the beginning of the post-AGB as when the mass of the envelope becomes 0.01 times the present-day mass of the given star (e.g. Miller Bertolami 2016), the large circumstellar masses we derive imply that these sources must have been on the AGB when the high-mass-loss phase started. Hence, the kinematic ages given in Table 4 represent an upper limit for the duration of the post-AGB evolution of these sources up to now. Using the spectral types available in the literature for four of the sources (AFGL 5385, HD 187885, Hen 3-1475, and M1-92, see Table 2) we are able to compare the time these objects took to transition between the end of the AGB and their present position in the Hertzsprung-Russell (HR) diagram with predictions from evolutionary models.
Relatively large uncertainties are associated with the timescales predicted by stellar evolution models mostly because of the unknown evolution of the mass-loss rate in the post-AGB phase. This is particularly critical in the beginning of the post-AGB, because stellar temperatures are still relatively low in this phase and AGB-like mass loss can still take place (Miller Bertolami 2016). Miller Bertolami (2016) divides the evolution during the post-AGB phase in two stages, the early and late post-AGB, with associated timescales τtr and τcross, respectively. The final point of the post-AGB evolution is defined when the maximum effective temperature is reached, which corresponds to Teff > 105 K in all models presented by Miller Bertolami (2016).
Since the changes experienced by the stars are gradual, definitions of transition points are to a large extent arbitrary. Nonetheless, the general trend is that model stars move to the blue in the HR diagram as the envelope mass decreases. This change is slow at first and accelerates strongly as the envelope mass becomes lower. At the start of the post-AGB (envelope mass equal to 0.01 of present-day mass), the effective temperature of the model stars are relatively low (≲4000 K) for initial stellar mass between 1.2 and 2 M⊙, as inferred from Fig. 8 in Miller Bertolami (2016). The point of transition between early and late post-AGB phase is set by Miller Bertolami (2016) to be log(Teff) = 3.85 (Teff ∼ 7080 K). Since the change in temperature as a function of time is fast in the late post-AGB, the definition of this transition point is of relative little consequence for the derived timescales according to the author, as long as the temperatures are relatively low, but high enough to prevent AGB-like outflows.
AFGL 5385, HD 187885, Hen 3-1475, and M1-92 have effective temperatures ranging between ∼6800 K and ∼30 000 K based on their spectral types (Table 2). Hence, they have evolved significantly beyond what would be considered the start of the post-AGB phase. Moreover, only the source with the lowest effective temperature (AFGL 5385) would be classified as an early post-AGB source, but even this object is relatively close to transitioning into the late post-AGB in which a rapid evolution of the effective temperature takes place.
By comparing the predicted times for stars to evolve from the beginning of the post-AGB to effective temperatures ∼7000 K (τtr) to the kinematic ages of the C18O J = 2 − 1 emission, it is clear that these four sources exhibited an evolution that proceeded faster than predicted by models (by a factor of at least a few). By interpolating the values for Z = 0.02 and Z = 0.01 in Table 3 in Miller Bertolami (2016), we find that τtr varies between ∼4400 yr for 1.25 M⊙ stars to ∼2370 yr for 2.0 M⊙ for solar metallicity (Z = 0.014). At lower metallicities (Z = 0.001), τtr becomes shorter and varies between ∼3700 yr and ∼1600 yr for models with 1.15 and 2.0 M⊙. AFGL 5385, HD 187885, Hen 3-1475, and M1-92 all seem to have reached their present position at least two times faster (and even faster in most cases) than expected. This particularly striking for M1-92 and Hen 3-1475 which have B-type central stars, with Teff > 10 000 K, and kinematic ages ≲1000 yr. HD 187885 also seems to have evolved more than five times faster than expected into the late post-AGB phase.
Previous models for post-AGB evolution presented by Vassiliadis & Wood (1994) display on average a slower evolution between the end of the strong AGB-like mass loss and the less intense post-AGB one. However, the comparison between different stellar evolution models is not completely straight forward because of different definitions of transitions points. In contrast to Miller Bertolami (2016), Vassiliadis & Wood (1994) defined the beginning of the post-AGB phase as the phase when the stellar temperature in the models increases by a factor of 2 from the value during the AGB. For a solar composition, this indicates that stellar temperatures at the beginning of the post-AGB would vary between ∼4500 K and ∼4200 K for a star with initial masses between 1.5 and 2 M⊙, respectively. From these starting points, the models reached stellar temperatures of 104 K in ≳8000 yr for initial masses ≳1.5 M⊙. For a metallicity Z = 0.004 comparable to that of HD 187885 (Z = 0.0035) and an initial mass equal to 1 M⊙, the evolution is shorter ∼6000 yr from an initial post-AGB stellar temperature ∼5600 K.
The timescales reported by Vassiliadis & Wood (1994) are almost an order of magnitude larger than that inferred for the evolution of Hen 3-1475 and M1-92, which have evolved to stellar temperature larger than 104 K. A comparison to HD 187885 and AFGL 5385 is not as clear because these sources have stellar temperatures lower than 104 K, and the durations of shorter steps of evolution below this limit are not specified. According to the models, AFGL 5385 and HD 187885 should have had stellar temperatures at the beginning of the post-AGB phase of ∼4500 K and ∼5600 K, respectively. The evolution of AFGL 5385 to the present value of ∼7300 K in 1500 yr seems to have happened faster than predicted considering that the source has experienced half the evolution to 104 K (expected to happen in ∼8600 yr) and that the pace of evolution is slower at lower stellar temperatures. For HD 187885, the change in temperature to the present value of ∼6800 K is relatively small, and we refrain from making a comparison that would require too many assumptions.
The fast evolution we infer with respect to those predicted by models discussed above might be caused by a different evolutionary path from the single-star evolution considered in the models. However, if at least some of these four sources evolved without the direct effect of a close companion, our results indicate that the central remnant warms up faster than expected. Sánchez Contreras et al. (2017) also suggested a faster evolution of the central source in the post-AGB phase based on high mass-loss rates derived for a small sample of post-AGB sources.
6.2. 13CO and C18O abundances
For the stars assumed to have initial solar composition, we find 13CO abundances between 0.9 × 10⁻⁵ and 2.0 × 10⁻⁵ with respect to the total number density of hydrogen atoms (including atomic and molecular sources). We find the largest values of 1.5 and 2.0 × 10⁻⁵ for Hen 3-1475 and M1-92, which are oxygen-rich sources. This fits the expectation that the abundance of 13C is larger in O-rich stars, but the values are 1.5 and 2 times larger than often assumed for post-AGB stars with solar-like elemental abundances and high molecular content, ∼1 × 10⁻⁵ (e.g. Bujarrabal et al. 2001, 2017). The values for C-rich sources with assumed solar metallicity are lower with respect to the O-rich ones, but the difference in values for these five sources is only a factor of approximately 2. The relatively high abundances of 13C we find are somewhat surprising because optical depth effects are expected to affect the 13CO lines more strongly than the C18O ones, which should lead to lower inferred values for the 13CO abundances than the real ones. From this, it seems that optical depth effects are at most mild in the 13CO lines.
If the C18O envelope is much smaller than the 13CO because of more efficient dissociation, we would overestimate the 13CO abundances. To examine this possibility, we compared the ratio between intensities of the 13CO and C18O J = 2 − 1 lines in the central beam of the maps to the same ratio between the line fluxes given in Table 3, which are integrated over larger apertures. We find larger ratios for all sources when larger apertures are used, implying that the C18O emission is more centrally peaked than the that of 13CO. This could be caused by the 13CO emission being either optically thick in the central beam or more extended than that of C18O. Nonetheless, compared to the ratios from 13CO J = 2 − 1 3-σ regions, those measured from the central beams are only between 15 and 20% smaller for GLMP 950, GLMP 953, HD 187885, and M1-92, and 30% smaller for AFGL 5385 and Hen 3-1475. Furthermore, the different sizes of the 3-σ contours of the J = 2 − 1 emission of 13CO and C18O are consistent with the lower S/N in the maps of the C18O lines. Based on these considerations, we conclude that, if present, the effect of different dissociation radii on the line ratios seems to be relatively small, and the 13CO abundance seems to be indeed relatively high in these sources.
Interestingly, the three C-rich sources with assumed solar metallicity display 13CO/C18O ratios between 10 and 13, while the C-rich source with lower metallicity (HD 187885) shows a value of ∼26, which is even larger than the values of 18 (Hen 3-1475) and 24 (M1-92) determined for the two O-rich sources. This might be caused by the chemical composition of HD 187885 not having been as strongly affected by the third dredge-up as those of the other C-rich sources, given the relatively low value of its C/O ratio ∼1 (Van Winckel et al. 1996; Van Winckel & Reyniers 2000).
6.3. Circumstellar gas masses
6.3.1. Uncertainties
The uncertainties on the circumstellar masses determined by us arise from uncertainties on the excitation temperature, distance, and C18O abundance. The circumstellar masses depend on the assumed excitation temperature in a non-linear manner. Increasing the excitation temperature from 10 K to 20 K causes the derived masses to decrease by approximately 20%, while increasing it from 10 K to 40 K causes the derived masses to increase by about 10%. Hence, we estimate the uncertainty on the excitation temperature translates to an uncertainty of at most ∼20% on the derived circumstellar gas masses. The circumstellar masses are proportional to the square of the adopted distance, which we assume to be uncertain by 30%. Considering the uncertainty of 30% from 18O abundance variation (Sect. 5.2), we find the circumstellar masses to be uncertain by a factor of 1.7. This does not account for uncertainties regarding the initial metallicity or, more specifically, the initial 18O abundance.
6.3.2. Comparison to the literature
The derived circumstellar gas masses correspond to a substantial fraction of the initial stellar mass of each source, given the initial masses < 2 M⊙. These values are on the high end when compared to those observed in a sample of 21 post-AGB stars, pre-PN, and PN, for which circumstellar masses between ∼10−2 and 1 M⊙ were inferred (Sánchez Contreras & Sahai 2012).
Oppenheimer et al. (2005) modelled the spectral energy distribution of AFGL 5385 and derived a dust mass-loss rate of ∼10−6 M⊙ yr−1. This is somewhat high compared to gas mass-loss rate of 1.7 × 10⁻⁴ M⊙ yr−1 derived by us, and would imply a gas-to-dust ratio of 170. This relatively low value implies substantial depletion of refractory elements, but is comparable to values ∼200 determined for AGB stars with large mass-loss rates ≳10−5 M⊙ yr−1 (e.g. Blommaert et al. 2018; Olofsson et al. 2022). The outer radius derived from their model implied a timescale for building up the envelope larger than 2000 yr for an assumed expansion velocity of 15 km s−1. The expansion velocity we find using the C18O J = 2 − 1 line (22.5 km s−1) would imply a timescale for the dust envelope larger than 1300 yr, which is consistent with the kinematic ages of the C18O J = 2 − 1 emission, ∼1500 yr.
The total circumstellar masses derived by Bujarrabal et al. (2001) of ∼2.6 × 10⁻² M⊙ and 0.63 M⊙ for HD 187885 and Hen 3-1475, respectively, can be compared to the values we find by using the distances assumed by them (1 kpc for HD 187885 and 5 kpc for Hen 3-1475). We find a circumstellar mass of 6 × 10⁻² and 0.32 M⊙, for HD 187885 and Hen 3-1475, respectively. The discrepancy is mostly explained by the different value of the 13CO abundance relative to hydrogen adopted by Bujarrabal et al. (2001), 1 × 10⁻⁵, compared to that derived by us, 1.5 × 10⁻⁵ and 0.55 × 10⁻⁵ for Hen 3-1475 and HD 187885, respectively.
A significantly larger circumstellar gas mass (∼1 M⊙) has been determined for M1-92 (Alcolea et al. 2022) than what we find (0.35 M⊙). This can also be mostly explained by a difference between the 13CO abundance assumed by Alcolea et al. (2022) (1 × 10⁻⁵) and that determined by us (2 × 10⁻⁵). Li et al. (2024) also find a circumstellar mass ∼1 M⊙ based on observations of optical scattered light and an assumed gas-to-dust ratio of 200. The lower circumstellar gas mass we find would imply a lower gas-to-dust ratio ∼70, which is quite low even if full condensation of refractory elements is considered.
6.4. Recent mass-loss rates
The mass-loss rates we derive ∼10−4 M⊙ yr−1 are roughly an order of magnitude higher than the peak values achieved by stars with initial masses between 1 and 2 M⊙ (∼10−5 M⊙ yr−1) in commonly used mass-loss-rate prescriptions (e.g. Vassiliadis & Wood 1993). Nonetheless, our calculations might even underestimate the actual peak mass-loss rates experienced by these sources. For instance, the inner radius of the envelope of HD 187885 observed by Lagadec et al. (2011), of 0.4″, implies a timescale for the cessation of mass loss ∼160 yr ago assuming the same expansion velocity we use, ∼30 km s−1. This is only four times smaller than kinematic age of the C18O J = 2 − 1 derived by us. The dust model calculated by Oppenheimer et al. (2005) for AFGL 5385 also implies a cessation of the high-mass-loss-rate phase ∼300 years ago (at the distance of 3.4 kpc considered by us). Hence, these non-negligible times since copious mass loss has ceased imply lower times spent in the phase of large mass-loss rates than given in Table 4, indicating that the maximum instantaneous mass-loss rates experienced by these sources are even larger than the average values we report.
We also note that the derived timescales pertain to the region traced by the J = 2 − 1 line of the observed isotopologues. If the size of the emission region is being determined by dissociation or excitation of the J = 2 levels, rather than by the onset of the high-mass-loss-rate phase, the timescales and circumstellar masses we infer will be lower than those experienced by the sources. Nonetheless, the obtained mass-loss rates are independent of whether the high-mass-loss-rate phase has been ongoing for longer than listed in Table 4.
6.5. Progenitor sources
One interesting question is whether the oxygen-rich stars in our sample could be an evolved stage of water fountain sources. The inferred kinematic ages for the C18O J = 2 − 1 emission for M1-92 and Hen 3-1475 (∼1190 and ∼770 years, respectively) are a factor of at least 4 larger than typical ages for the envelopes of water fountains (≲200 years, Khouri et al. 2021). When compared to average mass-loss rates derived for water fountains (≳10−3 M⊙ yr−1, Khouri et al. 2021), the values we present here are lower. However, this mostly reflects the larger timescales since the creation of the envelopes. If the intense mass-loss process of M1-92 and Hen 3-1475 lasted ≲200 years instead of the kinetic ages of the C18O J = 2 − 1 we determine, their mass-loss rates would have been ∼10−3 M⊙ yr−1, in the same range derived for water fountains. In fact, Alcolea et al. (2022) argues that it is not possible to exclude scenarios in which the whole envelope of M1-92 was created in a short mass-loss event. Moreover, the large excess momentum in the outflow compared to that provided by the radiation field in these two sources (Bujarrabal et al. 2001) imply an acceleration mechanism that probably requires the action of a companion. Khouri et al. (2021) suggested water fountains to have experienced common-envelope evolution, and similar suggestions have been made for M1-92 (e.g. Alcolea et al. 2022; Li et al. 2024) and Hen 3-1475 (Borkowski & Harrington 2001). The redder colours of water fountains (see Fig. 1) are most likely caused at least in part by their envelopes being more compact, with shorter timescales since the start of their high-mass-loss phase. Moreover, the high-velocity water masers, which are the distinguishing feature of water fountains, are only expected to be produced in the ∼200 years that define the class. Whether M1-92 and Hen 3-1475 displayed such high-velocity masers several hundred years ago is possible but unknown.
Confirming that these classes of sources are associated is not straight-forward, but statistical studies that include more sources at different evolutionary stages and should reveal whether this scenario is in agreement with observations when taking into account the different relevant timescales. Moreover, hydrodynamical modeling of the evolution of water fountain systems should also indicate whether the evolution of spectral energy distributions and morphologies are consistent. Another interesting question that deserves further investigation is whether an evolutionary relationship exists between post-AGB stars with dusty discs (e.g. Van Winckel 2007) and the objects studies here and water fountains.
Regarding the carbon-rich stars, their expected too-low water abundances imply that water masers are not produced, which would prevent these sources from even being classified as water fountains. Nonetheless, their compact envelopes and high mass-loss rates suggests that some sources (e.g. HD 187885, GLMP 950, GLMP 953, and AFGL 5385) might be carbon-rich stars that have followed the same evolutionary path as the path associated with water-fountain sources, namely, common envelope evolution.
6.6. High-velocity outflow of Hen 3-1475
As shown in Fig. 8, the high-velocity molecular outflow observed in Hen 3-1475 is well aligned with the images of [NII] emission obtained with the HST. Interestingly, the molecular gas appears in the dark regions between the bright clumps. The clumps observed by the HST show no significant proper motion, which has been interpreted as an indication that these structures trace quasi-stationary shocks (Fang et al. 2018).
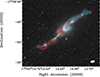 |
Fig. 8. Maps of the high-velocity 13CO J = 2 − 1 emission towards Hen 3-1475 as shown in Fig. 6 compared to images obtained with the HST WFPC2 through the F658N ([N II] at 6584 Å) filter (Riera et al. 2003). |
The projected velocity of the 13CO emission increases with distance from the star up to ∼240 km s−1 at the emission clumps observed the farthest away from the star (at ∼5″). The ionised gas displays velocities that also increase up to the same distance, but to a maximum of ∼600 km s−1 at ∼5″. The ionised gas, then, decelerate outwards by ∼100 km s−1 up to ∼9″ from the central source (Bobrowsky et al. 1995). Hence, the velocity of the molecular gas is a factor of roughly 2 lower than that of the ionised gas at a similar distance from the star, indicating that most of the molecular material is entrained in a faster outflow.
The bright knot to the northeast has been detected in X-rays (Sahai et al. 2003). Strong emission of energetic radiation in the clumps of ionised gas could be the cause for the lack of molecular emission from them. It is also possible that molecules are destroyed by the shock, but form again after (part of) the gas cools in the post-shock region.
The oxygen isotopic ratio we determine implies that Hen 3-1475 is not a high-mass O-rich post-AGB star, as suggested in the literature (Borkowski & Harrington 2001; Manteiga et al. 2011), but had a more typical initial mass for a post-AGB star (≲2 M⊙). The interpretation of this object (and similar ones) as the product of binary interactions (Borkowski & Harrington 2001) seems the most plausible option.
6.7. Comparison between GLMP 950 and GLMP 953
GLMP 950 and GLMP 953 display many similarities, but also striking differences. For instance, while the fluxes of the 13CO, C17O, and C18O J = 2 − 1 lines (Table 3) and the derived circumstellar masses (Table 4) display a difference of less than a factor of 2 between the two sources, the difference in the continuum emission measured at ∼1.3 mm (Table 2) exceeds a factor of 20. GLMP 953 shows higher values in both line and continuum emission. Another significant difference is that high-velocity emission (υ > 30 km s−1 from the systemic velocity) is observed towards GLMP 953, but not towards GLMP 950.
The large difference in continuum emission is puzzling, given the other similarities, including the similar kinematic ages, initial masses, circumstellar gas masses. and averaged mass-loss rates derived for the two sources. One possibility is that the emission from GLMP 953 at these wavelengths is mainly due to free-free emission, rather than dust. However, the flux density of this source at 353 GHz of 0.32 Jy (Eden et al. 2017) implies a spectral index between 353 and 228 GHz of ∼2.3, which does not suggest strong free-free emission.
The number of detected lines is similar towards the two sources. However, on the one hand, we observe lines we assign to K37Cl towards GLMP 953 (if confirmed, it is most likely produced in the inner and denser CSE), but not towards GLMP 950. On the other hand, a few unidentified lines are clearly detected towards GLMP 950, but not towards GLMP 953.
The cause of these differences is not obvious from the observations we report. While a different inclination could explain why we do not see high-velocity emission towards GLMP 950, it does not account for the much weaker continuum emission and the slightly different molecular spectra. A difference in C/O ratio could potentially explain the different chemistry and stronger continuum if it leads to the formation of more dust in GLMP 953, or of different types of dust between the two sources. Additionally, the high-velocity emission towards GLMP 953 hints at the presence of a companion in that system. If that is indeed the case, and the lack of high-velocity emission towards GLMP 950 indicates no companion is present, the observed differences might be all related to GLMP 953 being in a binary system and GLMP 950 not.
7. Summary and conclusions
We observed the J = 2−1 lines of 13CO, C17O, and C18O with ALMA towards a sample of six obscured post-AGB stars: four carbon-rich (GLMP 950, GLMP 953, AFGL 5385, and HD 187885) and two oxygen-rich sources (Hen 3-1475 and M1-92). Emission was detected and emission-region sizes were determined for all sources in the three lines and 1.3 mm continuum. The richness of the spectra varies strongly within the sample, with detection of emission lines assigned by us to NaCl, SiC2, SiS, K37Cl (tentative), and HC3N towards the carbon-rich sources and SO, SO2, and SiS towards the O-rich sources. The two sources with by far the largest number of detected lines (GLMP 950 and GLMP 953) have comparable strengths of the lines of CO isotopologues and similar luminosities, initial masses, and kinematic ages of the C18O J = 2 − 1 emission, but continuum emission at 238 GHz that differs by a factor of ∼20.
All but one source (GLMP 950) show high-velocity emission in the form of low-intensity wings (υ ≳ 30 km s−1) in the 13CO J = 2 − 1 line. The emission regions of these components show point-symmetric structure in all cases. The high-velocity molecular outflow of Hen 3-1475 was found to be particularly remarkable, with expansion velocities of > 200 km s−1 and emission regions that are interleaved with emission from hotter ionised gas observed by the HST. The lower velocities of the molecular gas with respect to the ionised gas at the same distance from the central source suggests that the molecules are entrained in the atomic outflow.
We inferred initial masses between 1.15 and 1.8 for the stars in our sample using the 17O/18O isotopic ratio, which we derived based on the observed ratios of the C17O and C18O lines. We found high circumstellar masses (between ∼0.1 and ∼0.42 M⊙) and low kinematic ages (ranging from ∼600 to ∼1500 yr) corresponding to the C18O J = 2 − 1 emission. Together, these values imply very large recent mass-loss rates (≳10−4 M⊙ yr−1). The high effective temperatures of AFGL 5385, HD 187885, Hen 3-1475, and M1-92, along with the relatively short times since the phases of strong mass loss, imply that the central sources have evolved faster than expected for single stars.
Our results highlight how our understanding of post-AGB stars can advance using ALMA observations of galactic sources and through a comprehensive study of their properties (circumstellar mass, kinematic ages, and isotopic ratios). The extent to which the population of obscured post-AGB stars are the product of single-star evolution or binary interactions remains open, but we confirmed that their characteristics are similar to those of water fountains, which are suggested to be the product of binary interactions. Moreover, the two O-rich sources M1-92 and Hen 3-1475 have remained rich in oxygen despite having initial masses in the range where the transition to a carbon-rich composition is expected. In conclusion, observations of this type of a larger sample of objects have the potential to substantially advance our understanding of post-AGB stars, planetary nebulae, and the end of the AGB.
8. Data availability
The table with detected lines and the figures of integrated J = 2−1 13CO, C17O, and C18O emission, Spitzer/IRAC images towards GLMP 950 and GLMP 953, and continuum image of AFGL 5385 showing the secondary source have been uploaded to Zenodo and are available through the following link: https://zenodo.org/records/14615590
Acknowledgments
The authors thank the referee Eric Lagadec for his questions and suggestions which improved the quality of the manuscript. The authors thank Marcelo Miller Bertolami for helpful discussions regarding the interpretation of timescales for post-AGB evolution in his models. This paper makes use of the following ALMA data: ADS/JAO.ALMA#2021.1.01259.S ALMA is a partnership of ESO (representing its member states), NSF (USA) and NINS (Japan), together with NRC (Canada), MOST and ASIAA (Taiwan), and KASI (Republic of Korea), in cooperation with the Republic of Chile. The Joint ALMA Observatory is operated by ESO, AUI/NRAO and NAOJ. T.K. acknowledges support from the Swedish Research Council through grants 2019-03777. JA, VB, CSC are partially supported by I+D+i project, PID2019-105203GB-C21/C22, funded by the Spanish MICIU/AEI/10.13039/501100011033. JFG is financially supported by grants PID2020-114461GB-I00, PID2023-146295NB-I00, and CEX2021-001131-S, funded by MCIN/AEI/10.13039/501100011033. L.V.-P. acknowledges support from the grant PID2020-117034RJ-I00 funded by the Spanish MCIN/AEI/10.13039/501100011033. R.S.’s contribution to the research described here was carried out at the Jet Propulsion Laboratory, California Institute of Technology, under a contract with NASA, and funded in part by NASA via multiple ADAP and HST GO awards. AK was supported by the Australian Research Council Centre of Excellence for All Sky Astrophysics in 3 Dimensions (ASTRO 3D), through project number CE170100013. MS acknowledges support from the Research Council of Norway via ESGC project (project No. 335497).
References
- Abia, C., Hedrosa, R. P., Domínguez, I., & Straniero, O. 2017, A&A, 599, A39 [NASA ADS] [CrossRef] [EDP Sciences] [Google Scholar]
- Alcolea, J., Neri, R., & Bujarrabal, V. 2007, A&A, 468, L41 [NASA ADS] [CrossRef] [EDP Sciences] [Google Scholar]
- Alcolea, J., Agúndez, M., Bujarrabal, V., et al. 2022, Galaxies, 10, 47 [NASA ADS] [CrossRef] [Google Scholar]
- Allen, D. A., & Swings, J. P. 1976, A&A, 47, 293 [NASA ADS] [Google Scholar]
- Blommaert, J. A. D. L., Groenewegen, M. A. T., Justtanont, K., & Decin, L. 2018, MNRAS, 479, 3545 [CrossRef] [Google Scholar]
- Boboltz, D. A., & Marvel, K. B. 2007, ApJ, 665, 680 [NASA ADS] [CrossRef] [Google Scholar]
- Bobrowsky, M., Zijlstra, A. A., Grebel, E. K., et al. 1995, ApJ, 446, L89 [NASA ADS] [CrossRef] [Google Scholar]
- Boffin, H. M. J., & Jones, D. 2019, The Importance of Binaries in the Formation and Evolution of Planetary Nebulae (Springer Nature Switzerland AG) [Google Scholar]
- Borkowski, K. J., & Harrington, J. P. 2001, ApJ, 550, 778 [NASA ADS] [CrossRef] [Google Scholar]
- Borkowski, K. J., Blondin, J. M., & Harrington, J. P. 1997, ApJ, 482, L97 [NASA ADS] [CrossRef] [Google Scholar]
- Bujarrabal, V., Alcolea, J., Neri, R., & Grewing, M. 1997, A&A, 320, 540 [NASA ADS] [Google Scholar]
- Bujarrabal, V., Castro-Carrizo, A., Alcolea, J., & Sánchez Contreras, C. 2001, A&A, 377, 868 [NASA ADS] [CrossRef] [EDP Sciences] [Google Scholar]
- Bujarrabal, V., Castro-Carrizo, A., Alcolea, J., et al. 2017, A&A, 597, L5 [NASA ADS] [CrossRef] [EDP Sciences] [Google Scholar]
- CASA-Team (Bean, B., et al.) 2022, PASP, 134, 114501 [NASA ADS] [CrossRef] [Google Scholar]
- Clube, K. L., & Gledhill, T. M. 2004, MNRAS, 355, L17 [NASA ADS] [CrossRef] [Google Scholar]
- Cristallo, S., Straniero, O., Piersanti, L., & Gobrecht, D. 2015, ApJS, 219, 40 [Google Scholar]
- Cutri, R. M., Skrutskie, M. F., van Dyk, S., et al. 2003, VizieR Online Data Catalog: II/246 [Google Scholar]
- Danilovich, T., Lombaert, R., Decin, L., et al. 2017, A&A, 602, A14 [NASA ADS] [CrossRef] [EDP Sciences] [Google Scholar]
- Day, F. M., Pihlström, Y. M., Claussen, M. J., & Sahai, R. 2010, ApJ, 713, 986 [NASA ADS] [CrossRef] [Google Scholar]
- Decin, L., Montargès, M., Richards, A. M. S., et al. 2020, Science, 369, 1497 [Google Scholar]
- Dehaes, S., Groenewegen, M. A. T., Decin, L., et al. 2007, MNRAS, 377, 931 [NASA ADS] [CrossRef] [Google Scholar]
- De Marco, O. 2009, PASP, 121, 316 [NASA ADS] [CrossRef] [Google Scholar]
- De Marco, O., Long, J., Jacoby, G. H., et al. 2015, MNRAS, 448, 3587 [Google Scholar]
- De Nutte, R., Decin, L., Olofsson, H., et al. 2017, A&A, 600, A71 [NASA ADS] [CrossRef] [EDP Sciences] [Google Scholar]
- Eden, D. J., Moore, T. J. T., Plume, R., et al. 2017, MNRAS, 469, 2163 [Google Scholar]
- Fang, X., Gómez de Castro, A. I., Toalá, J. A., & Riera, A. 2018, ApJ, 865, L23 [NASA ADS] [CrossRef] [Google Scholar]
- Gaia Collaboration (Brown, A. G. A., et al.) 2021, A&A, 649, A1 [NASA ADS] [CrossRef] [EDP Sciences] [Google Scholar]
- Gallardo Cava, I., Gómez-Garrido, M., Bujarrabal, V., et al. 2021, A&A, 648, A93 [NASA ADS] [CrossRef] [EDP Sciences] [Google Scholar]
- Gallardo Cava, I., Bujarrabal, V., Alcolea, J., Gómez-Garrido, M., & Santander-García, M. 2022, A&A, 659, A134 [NASA ADS] [CrossRef] [EDP Sciences] [Google Scholar]
- García-Segura, G., Villaver, E., Langer, N., Yoon, S. C., & Manchado, A. 2014, ApJ, 783, 74 [CrossRef] [Google Scholar]
- Gómez, J. F., Niccolini, G., Suárez, O., et al. 2018, MNRAS, 480, 4991 [CrossRef] [Google Scholar]
- Goriely, S., & Siess, L. 2018, A&A, 609, A29 [NASA ADS] [CrossRef] [EDP Sciences] [Google Scholar]
- Groenewegen, M. A. T. 2002, ArXiv e-prints [arXiv:astro-ph/0208449] [Google Scholar]
- Groenewegen, M. A. T., van den Hoek, L. B., & de Jong, T. 1995, A&A, 293, 381 [NASA ADS] [Google Scholar]
- Guertler, J., Koempe, C., & Henning, T. 1996, A&A, 305, 878 [NASA ADS] [Google Scholar]
- Harris, M. J., Lambert, D. L., Hinkle, K. H., Gustafsson, B., & Eriksson, K. 1987, ApJ, 316, 294 [NASA ADS] [CrossRef] [Google Scholar]
- Herwig, F. 2005, ARA&A, 43, 435 [NASA ADS] [CrossRef] [Google Scholar]
- Hillwig, T. C., Jones, D., De Marco, O., et al. 2016, ApJ, 832, 125 [NASA ADS] [CrossRef] [Google Scholar]
- Hinkle, K. H., Lebzelter, T., & Straniero, O. 2016, ApJ, 825, 38 [NASA ADS] [CrossRef] [Google Scholar]
- Höfner, S., & Olofsson, H. 2018, A&ARv, 26, 1 [Google Scholar]
- Huggins, P. J., Muthu, C., Bachiller, R., Forveille, T., & Cox, P. 2004, A&A, 414, 581 [NASA ADS] [CrossRef] [EDP Sciences] [Google Scholar]
- Iben, I., & Renzini, A. 1983, ARA&A, 21, 271 [NASA ADS] [CrossRef] [Google Scholar]
- Imai, H. 2007, in Astrophysical Masers and their Environments, eds. J. M. Chapman, & W. A. Baan, 242, 279 [NASA ADS] [Google Scholar]
- Ita, Y., Matsuura, M., Ishihara, D., et al. 2010, A&A, 514, A2 [NASA ADS] [CrossRef] [EDP Sciences] [Google Scholar]
- Jones, D., & Boffin, H. M. J. 2017, Nat. Astron., 1, 0117 [Google Scholar]
- Justtanont, K., Khouri, T., Maercker, M., et al. 2012, A&A, 537, A144 [NASA ADS] [CrossRef] [EDP Sciences] [Google Scholar]
- Karakas, A. I., & Lattanzio, J. C. 2014, PASA, 31, e030 [NASA ADS] [CrossRef] [Google Scholar]
- Karakas, A. I., & Lugaro, M. 2016, ApJ, 825, 26 [NASA ADS] [CrossRef] [Google Scholar]
- Karakas, A. I., Lugaro, M., Carlos, M., et al. 2018, MNRAS, 477, 421 [NASA ADS] [CrossRef] [Google Scholar]
- Khouri, T., Vlemmings, W. H. T., Tafoya, D., et al. 2021, Nat. Astron., 6, 275 [NASA ADS] [CrossRef] [Google Scholar]
- Kwok, S. 1994, PASP, 106, 344 [NASA ADS] [CrossRef] [Google Scholar]
- Lagadec, E., Verhoelst, T., Mékarnia, D., et al. 2011, MNRAS, 417, 32 [NASA ADS] [CrossRef] [Google Scholar]
- Lebzelter, T., Hinkle, K. H., Straniero, O., et al. 2019, ApJ, 886, 117 [NASA ADS] [CrossRef] [Google Scholar]
- Li, Y. Q., Morris, M. R., & Sahai, R. 2024, Galaxies, 12, 44 [NASA ADS] [CrossRef] [Google Scholar]
- Manteiga, M., García-Hernández, D. A., Ulla, A., Manchado, A., & García-Lario, P. 2011, AJ, 141, 80 [NASA ADS] [CrossRef] [Google Scholar]
- Miller Bertolami, M. M. 2016, A&A, 588, A25 [NASA ADS] [CrossRef] [EDP Sciences] [Google Scholar]
- Moe, M., & De Marco, O. 2006, ApJ, 650, 916 [Google Scholar]
- Morris, M., Lucas, R., & Omont, A. 1985, A&A, 142, 107 [NASA ADS] [Google Scholar]
- Olofsson, H., Khouri, T., Sargent, B. A., et al. 2022, A&A, 665, A82 [NASA ADS] [CrossRef] [EDP Sciences] [Google Scholar]
- Omont, A., Loup, C., Forveille, T., et al. 1993, A&A, 267, 515 [NASA ADS] [Google Scholar]
- Oomen, G.-M., Van Winckel, H., Pols, O., et al. 2018, A&A, 620, A85 [NASA ADS] [CrossRef] [EDP Sciences] [Google Scholar]
- Oppenheimer, B. D., Bieging, J. H., Schmidt, G. D., et al. 2005, ApJ, 624, 957 [NASA ADS] [CrossRef] [Google Scholar]
- Palmerini, S., Cristallo, S., Piersanti, L., Vescovi, D., & Busso, M. 2021, Universe, 7, 175 [CrossRef] [Google Scholar]
- Parker, Q. A., Acker, A., Frew, D. J., et al. 2006, MNRAS, 373, 79 [NASA ADS] [CrossRef] [Google Scholar]
- Ramstedt, S., Vlemmings, W. H. T., Doan, L., et al. 2020, A&A, 640, A133 [EDP Sciences] [Google Scholar]
- Rees, N. R., Izzard, R. G., & Karakas, A. I. 2024, MNRAS, 527, 9643 [Google Scholar]
- Renzini, A. 1981, in Red Giants as Precursors of Planetary Nebulae, eds. I. Iben, & A. Renzini, 88, 431 [NASA ADS] [Google Scholar]
- Riera, A., Garcia-Lario, P., Manchado, A., Pottasch, S. R., & Raga, A. C. 1995, A&A, 302, 137 [NASA ADS] [Google Scholar]
- Riera, A., García-Lario, P., Manchado, A., Bobrowsky, M., & Estalella, R. 2003, A&A, 401, 1039 [NASA ADS] [CrossRef] [EDP Sciences] [Google Scholar]
- Sahai, R., & Trauger, J. T. 1998, AJ, 116, 1357 [NASA ADS] [CrossRef] [Google Scholar]
- Sahai, R., Kastner, J. H., Frank, A., Morris, M., & Blackman, E. G. 2003, ApJ, 599, L87 [NASA ADS] [CrossRef] [Google Scholar]
- Sahai, R., Morris, M., Sánchez Contreras, C., & Claussen, M. 2007, AJ, 134, 2200 [NASA ADS] [CrossRef] [Google Scholar]
- Sahai, R., Morris, M. R., & Villar, G. G. 2011, AJ, 141, 134 [NASA ADS] [CrossRef] [Google Scholar]
- Sahai, R., Vlemmings, W. H. T., Gledhill, T., et al. 2017, ApJ, 835, L13 [NASA ADS] [CrossRef] [Google Scholar]
- Sánchez Contreras, C., & Sahai, R. 2001, ApJ, 553, L173 [CrossRef] [Google Scholar]
- Sánchez Contreras, C., & Sahai, R. 2012, ApJS, 203, 16 [NASA ADS] [CrossRef] [Google Scholar]
- Sánchez Contreras, C., Alcolea, J., Bujarrabal, V., & Neri, R. 1998, A&A, 337, 233 [NASA ADS] [Google Scholar]
- Sánchez Contreras, C., Báez-Rubio, A., Alcolea, J., Bujarrabal, V., & Martín-Pintado, J. 2017, A&A, 603, A67 [NASA ADS] [CrossRef] [EDP Sciences] [Google Scholar]
- Smith, V. V., & Lambert, D. L. 1990, ApJS, 72, 387 [NASA ADS] [CrossRef] [Google Scholar]
- Soker, N. 2020, Galaxies, 8, 26 [NASA ADS] [CrossRef] [Google Scholar]
- Stancliffe, R. J., Tout, C. A., & Pols, O. R. 2004, MNRAS, 352, 984 [NASA ADS] [CrossRef] [Google Scholar]
- Stancliffe, R. J., Izzard, R. G., & Tout, C. A. 2005, MNRAS, 356, L1 [Google Scholar]
- Su, K. Y. L., Volk, K., Kwok, S., & Hrivnak, B. J. 1998, ApJ, 508, 744 [NASA ADS] [CrossRef] [Google Scholar]
- Su, K. Y. L., Hrivnak, B. J., Kwok, S., & Sahai, R. 2003, AJ, 126, 848 [NASA ADS] [CrossRef] [Google Scholar]
- Suárez, O., García-Lario, P., Manchado, A., et al. 2006, A&A, 458, 173 [NASA ADS] [CrossRef] [EDP Sciences] [Google Scholar]
- Szczerba, R., Siódmiak, N., Stasińska, G., & Borkowski, J. 2007, A&A, 469, 799 [NASA ADS] [CrossRef] [EDP Sciences] [Google Scholar]
- Tafoya, D., Imai, H., Gómez, J. F., et al. 2020, ApJ, 890, L14 [NASA ADS] [CrossRef] [Google Scholar]
- Trammell, S. R., & Goodrich, R. W. 1996, ApJ, 468, L107 [NASA ADS] [CrossRef] [Google Scholar]
- Ueta, T., Murakawa, K., & Meixner, M. 2007, AJ, 133, 1345 [NASA ADS] [CrossRef] [Google Scholar]
- Van Winckel, H. 2007, Balt. Astron., 16, 112 [NASA ADS] [Google Scholar]
- Van Winckel, H. 2018, ArXiv e-prints [arXiv:1809.00871] [Google Scholar]
- Van Winckel, H., & Reyniers, M. 2000, A&A, 354, 135 [NASA ADS] [Google Scholar]
- Van Winckel, H., Waelkens, C., & Waters, L. B. F. M. 1996, A&A, 306, L37 [NASA ADS] [Google Scholar]
- Vassiliadis, E., & Wood, P. R. 1993, ApJ, 413, 641 [Google Scholar]
- Vassiliadis, E., & Wood, P. R. 1994, ApJS, 92, 125 [NASA ADS] [CrossRef] [Google Scholar]
- Velilla-Prieto, L., Fonfría, J. P., Agúndez, M., et al. 2023, Nature, 617, 696 [NASA ADS] [CrossRef] [Google Scholar]
- Ventura, P., Karakas, A., Dell’Agli, F., García-Hernández, D. A., & Guzman-Ramirez, L. 2018, MNRAS, 475, 2282 [NASA ADS] [Google Scholar]
- Vickers, S. B., Frew, D. J., Parker, Q. A., & Bojičić, I. S. 2015, MNRAS, 447, 1673 [NASA ADS] [CrossRef] [Google Scholar]
- Volk, K., Kwok, S., & Hrivnak, B. J. 2007, ApJ, 670, 1137 [NASA ADS] [CrossRef] [Google Scholar]
- Weiss, A., & Ferguson, J. W. 2009, A&A, 508, 1343 [NASA ADS] [CrossRef] [EDP Sciences] [Google Scholar]
- Wenger, M., Ochsenbein, F., Egret, D., et al. 2000, A&AS, 143, 9 [NASA ADS] [CrossRef] [EDP Sciences] [Google Scholar]
All Tables
Parameters obtained from the literature and measured values of the continuum emission for the sample stars.
Observed fluxes of the J = 2 − 1 lines and angular sizes of the emission region (Δθ3σC18O) and full widths at zero intensity (ΔυC18O) of the C18O J = 2 − 1 line.
All Figures
|
Fig. 1. Position of the sources included in our sample in a colour-colour diagram for post-AGB stars. The blue pentagons show the sources included in this study, the green squares represent water fountain sources observed by Khouri et al. (2021), and the grey circles correspond to other known post-AGB stars catalogued by Szczerba et al. (2007). The vertical arrows indicate our assessment that the J-band magnitude of GLMP 950 and GLMP 953 is dominated by contaminating sources close to their position on the sky (see Sects. 4.2 and 4.3 and Appendix C). |
| In the text | |
|
Fig. 2. Continuum (1.3 mm) and J = 2 − 1 13CO, C18O, and C17O line emission towards GLMP 950. Top: Maps of the continuum (colour map) and 13CO J = 2 − 1 emission integrated over the whole line emission (contours) at 10%, 30%, 50%, and 70% of the peak value (6.2 Jy beam−1 km s−1). The continuum emission peaks at |
| In the text | |
|
Fig. 3. Continuum (1.3 mm) and J = 2 − 1 13CO, C18O, and C17O line emission towards GLMP 953. Left: Maps of the continuum (colour map) and high-velocity line emission (contours). The continuum peak is at |
| In the text | |
|
Fig. 4. Continuum (1.3 mm) and J = 2 − 1 13CO, C18O, and C17O line emission towards AFGL 5385. Top: Maps of the continuum (colour map) and high-velocity line emission (contours). The continuum peaks at |
| In the text | |
|
Fig. 5. Continuum (1.3 mm) and J = 2 − 1 13CO, C18O, and C17O line emission towards HD 187885. Left: Maps of the continuum (colour map) and high-velocity line emission (contours). The continuum peaks at |
| In the text | |
|
Fig. 6. Continuum (1.3 mm) and J = 2 − 1 13CO, C18O, and C17O line emission towards Hen 3-1475. Left: Maps of the continuum (colour map) and high-velocity line emission (contours). The continuum peaks at |
| In the text | |
|
Fig. 7. Continuum (1.3 mm) and J = 2 − 1 13CO, C18O, and C17O line emission towards M1-92. Top: Maps of the continuum (colour map) and high-velocity line emission (contours). The continuum peaks at |
| In the text | |
|
Fig. 8. Maps of the high-velocity 13CO J = 2 − 1 emission towards Hen 3-1475 as shown in Fig. 6 compared to images obtained with the HST WFPC2 through the F658N ([N II] at 6584 Å) filter (Riera et al. 2003). |
| In the text | |
Current usage metrics show cumulative count of Article Views (full-text article views including HTML views, PDF and ePub downloads, according to the available data) and Abstracts Views on Vision4Press platform.
Data correspond to usage on the plateform after 2015. The current usage metrics is available 48-96 hours after online publication and is updated daily on week days.
Initial download of the metrics may take a while.