Fig. 2.
Download original image
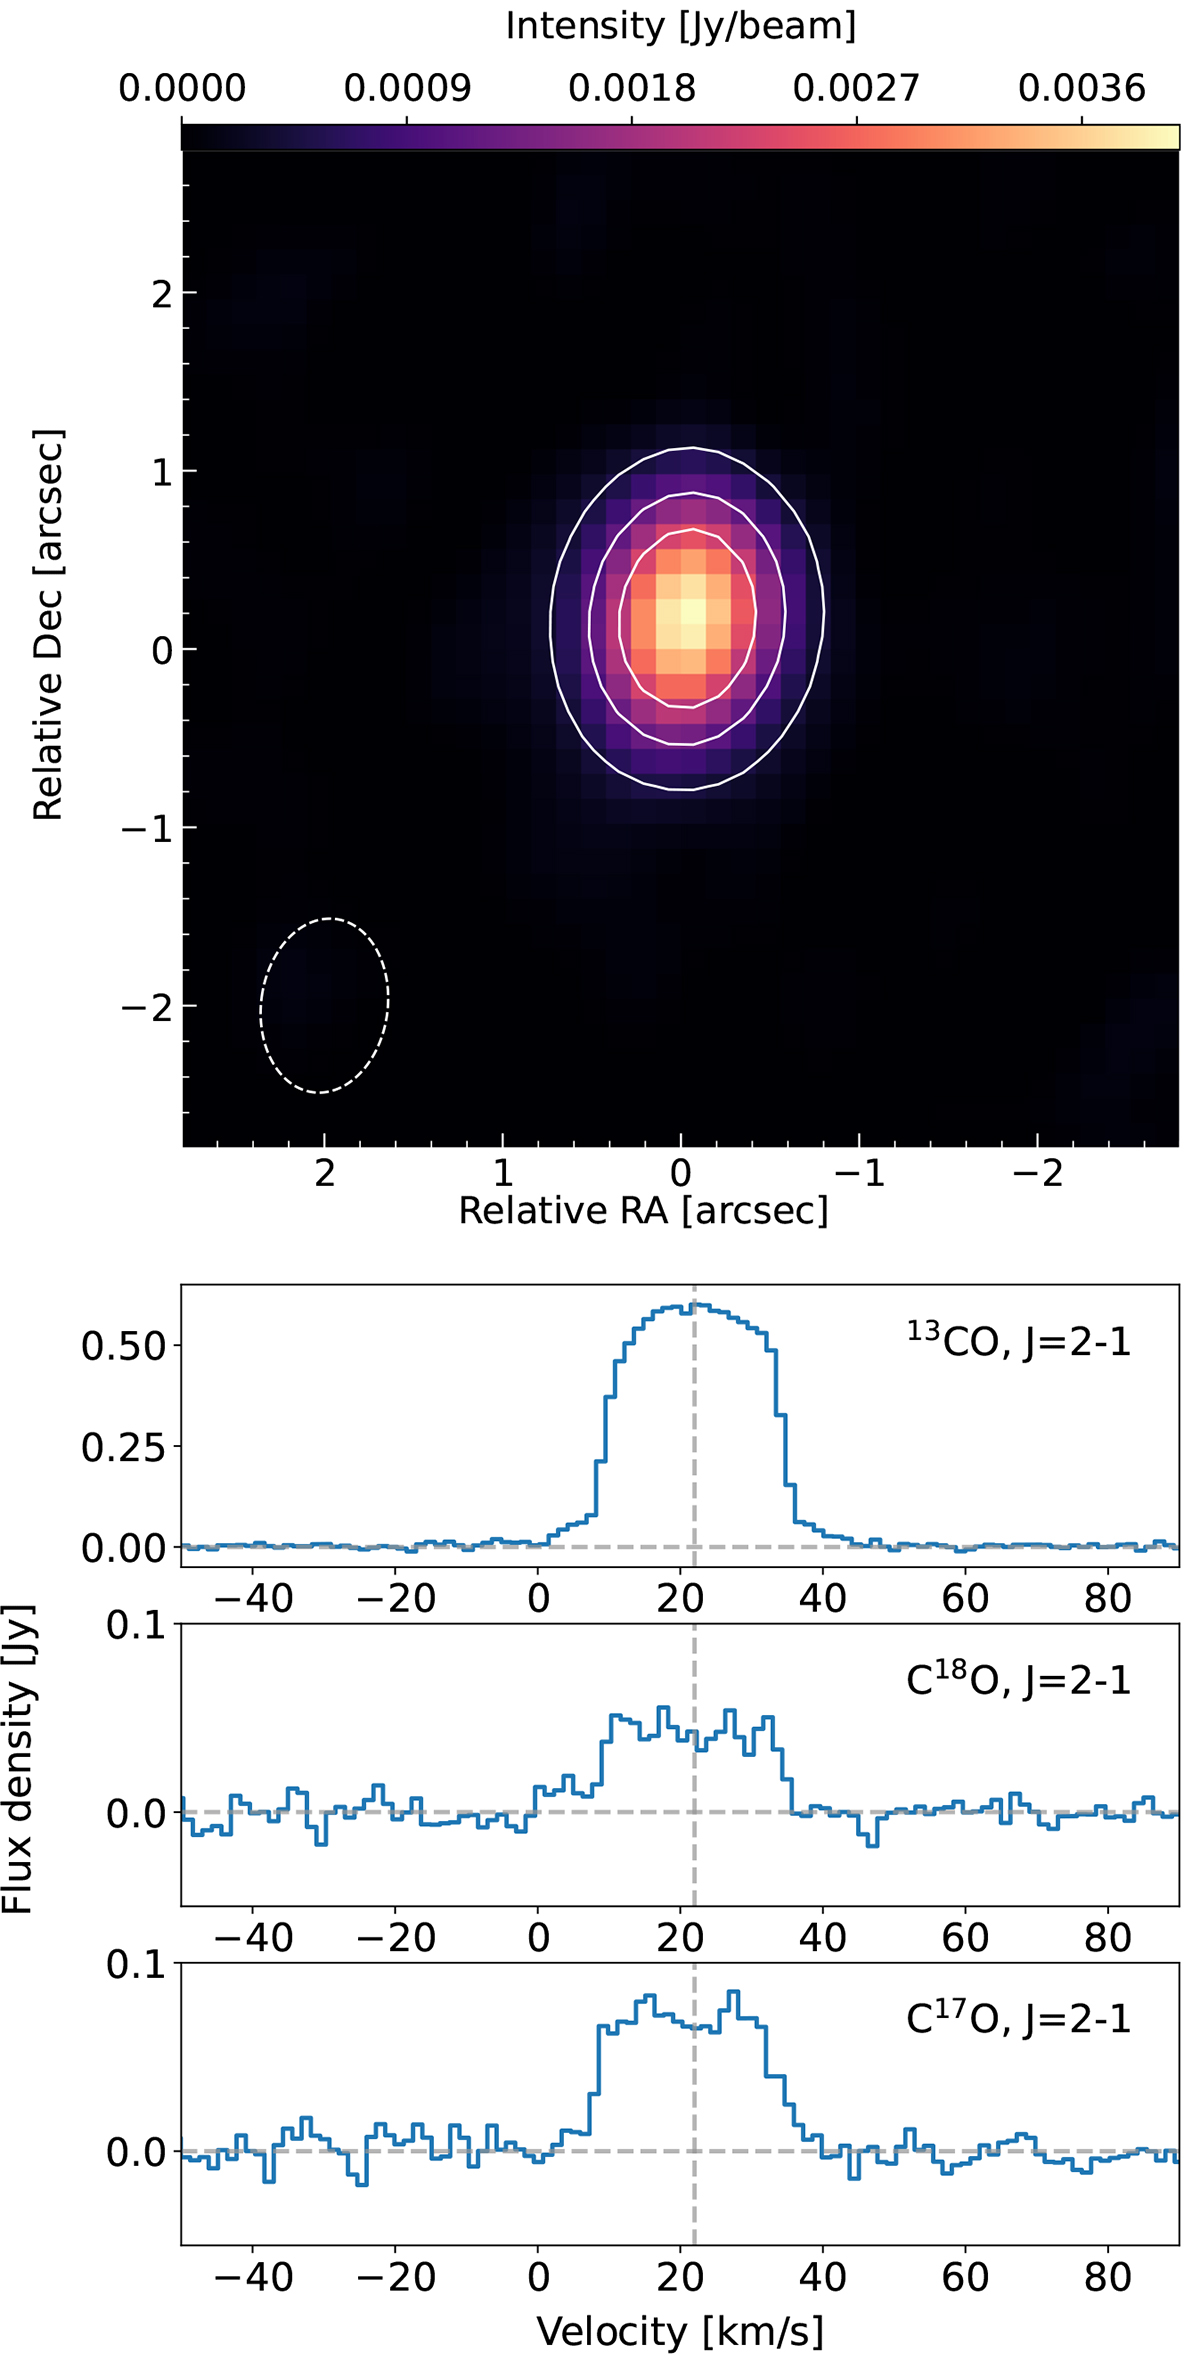
Continuum (1.3 mm) and J = 2 − 1 13CO, C18O, and C17O line emission towards GLMP 950. Top: Maps of the continuum (colour map) and 13CO J = 2 − 1 emission integrated over the whole line emission (contours) at 10%, 30%, 50%, and 70% of the peak value (6.2 Jy beam−1 km s−1). The continuum emission peaks at ![]() and
and ![]() . Bottom: Source-integrated spectra of the 13CO J = 2 − 1, C18O J = 2 − 1, and C17O J = 2 − 1 lines. The vertical line marks the inferred velocity of the source υLSR = 22 km s−1.
. Bottom: Source-integrated spectra of the 13CO J = 2 − 1, C18O J = 2 − 1, and C17O J = 2 − 1 lines. The vertical line marks the inferred velocity of the source υLSR = 22 km s−1.
Current usage metrics show cumulative count of Article Views (full-text article views including HTML views, PDF and ePub downloads, according to the available data) and Abstracts Views on Vision4Press platform.
Data correspond to usage on the plateform after 2015. The current usage metrics is available 48-96 hours after online publication and is updated daily on week days.
Initial download of the metrics may take a while.