Fig. 7.
Download original image
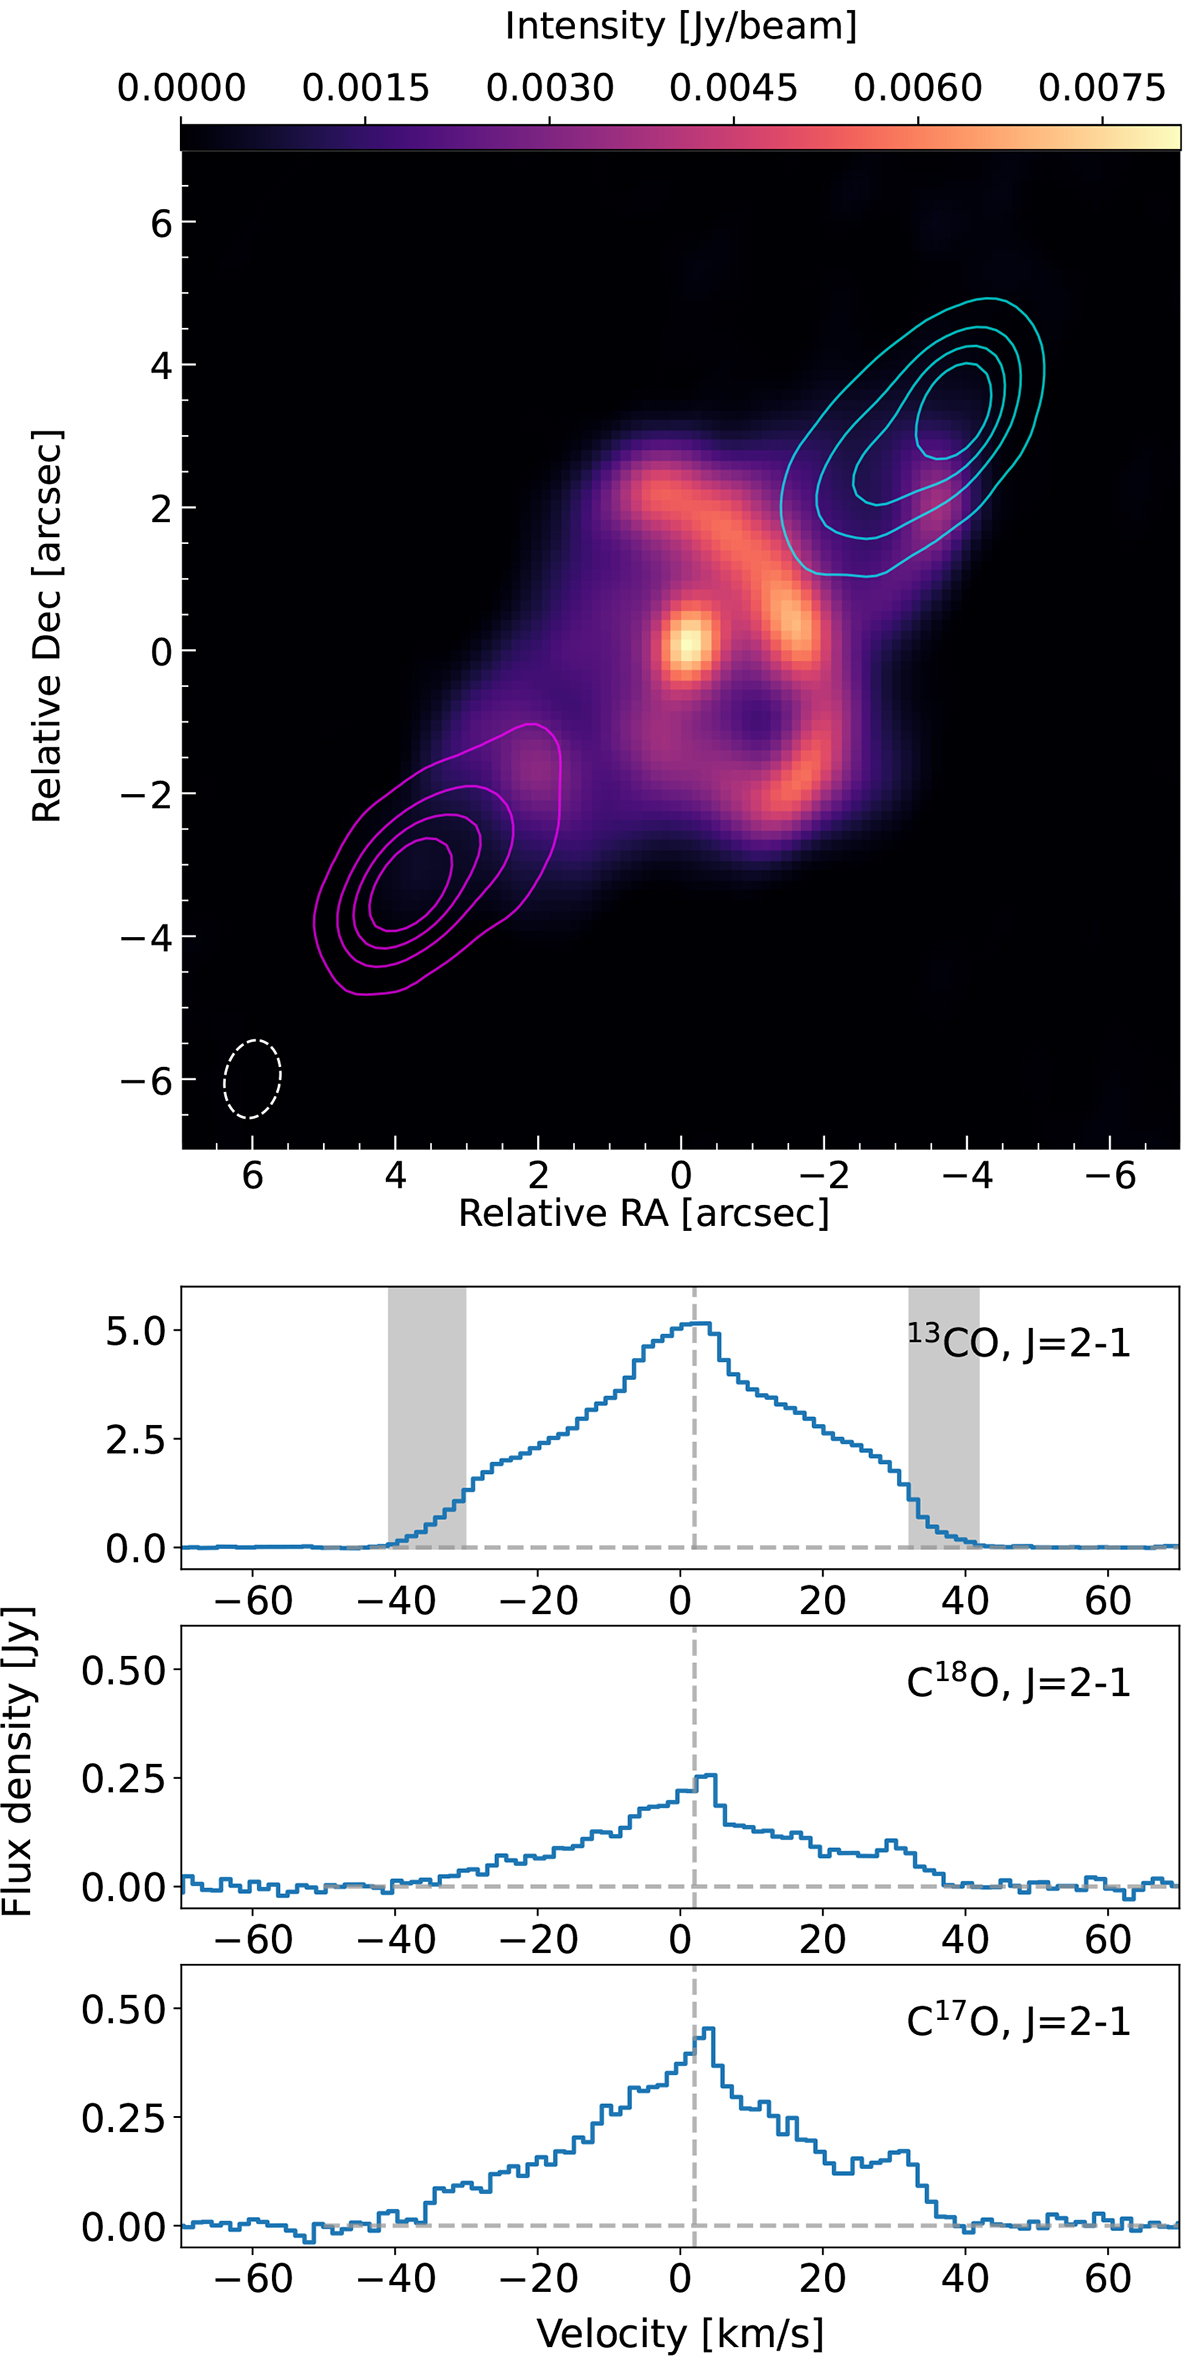
Continuum (1.3 mm) and J = 2 − 1 13CO, C18O, and C17O line emission towards M1-92. Top: Maps of the continuum (colour map) and high-velocity line emission (contours). The continuum peaks at ![]() and
and ![]() . The full lines show emission in the 13CO J = 2 − 1 integrated over the spectral intervals marked in grey in the line plot. Magenta and cyan contours show red-shifted and blue-shifted emission, respectively, at 70%, 50%, 30%, and 10% level of the peak values of 0.115 (red-shifted) and 0.127 (blue-shifted) Jy beam−1 × km s−1. Bottom: Source-integrated spectra of the 13CO J = 2 − 1, C18O J = 2 − 1, and C17O J = 2 − 1 lines.
. The full lines show emission in the 13CO J = 2 − 1 integrated over the spectral intervals marked in grey in the line plot. Magenta and cyan contours show red-shifted and blue-shifted emission, respectively, at 70%, 50%, 30%, and 10% level of the peak values of 0.115 (red-shifted) and 0.127 (blue-shifted) Jy beam−1 × km s−1. Bottom: Source-integrated spectra of the 13CO J = 2 − 1, C18O J = 2 − 1, and C17O J = 2 − 1 lines.
Current usage metrics show cumulative count of Article Views (full-text article views including HTML views, PDF and ePub downloads, according to the available data) and Abstracts Views on Vision4Press platform.
Data correspond to usage on the plateform after 2015. The current usage metrics is available 48-96 hours after online publication and is updated daily on week days.
Initial download of the metrics may take a while.