| Issue |
A&A
Volume 698, May 2025
|
|
|---|---|---|
| Article Number | A247 | |
| Number of page(s) | 13 | |
| Section | Galactic structure, stellar clusters and populations | |
| DOI | https://doi.org/10.1051/0004-6361/202452136 | |
| Published online | 23 June 2025 | |
A JWST project on 47 Tucanae
Binaries among multiple populations
1
Dipartimento di Fisica e Astronomia “Galileo Galilei”, Univ. di Padova,
Vicolo dell’Osservatorio 3,
Padova
35122,
Italy
2
Istituto Nazionale di Astrofisica – Osservatorio Astronomico di Padova,
Vicolo dell’Osservatorio 5,
Padova
35122,
Italy
3
Department of Astronomy, Indiana University, Bloomington,
Swain West, 727 E. 3rd Street,
IN
47405,
USA
4
Research School of Astronomy and Astrophysics, Australian National University,
Canberra,
ACT
2611,
Australia
5
Istituto Nazionale di Astrofisica, Osservatorio Astronomico di Roma,
Via Frascati 33,
00077
Monte Porzio Catone,
Italy
6
Center for Galaxy Evolution Research and Department of Astronomy, Yonsei University,
Seoul
03722,
Korea
7
South-Western Institute for Astronomy Research, Yunnan University,
Kunming
650500,
PR China
8
Department of Physics and Astronomy, Sejong University,
209 Neungdong-ro,
Gwangjin-Gu,
Seoul
05006,
Republic of Korea
9
Department of Physics, Xi’an Jiaotong-Liverpool University,
111 Ren’ai Road, Dushu Lake Science and Education Innovation District,
Suzhou
215123,
Jiangsu Province,
PR China
10
Shanghai Key Laboratory for Astrophysics, Shanghai Normal University,
100 Guilin Road,
Shanghai
200234,
PR China
★ Corresponding author: antonino.milone@unipd.it
Received:
6
September
2024
Accepted:
24
March
2025
Almost all globular clusters (GCs) contain multiple stellar populations consisting of stars with varying helium and light-element abundances. These populations include first-population stars, which exhibit similar chemical compositions as halo-field stars with comparable [Fe/H], and second-population stars, characterized by higher helium and nitrogen abundances along with reduced levels of oxygen and carbon. Nowadays, one of the most intriguing open questions about GCs pertains to the formation and evolution of their multiple populations. Recent works based on N-body simulations of GCs show that the fractions and characteristics of binary stars can serve as dynamic indicators of the formation period of multiple-population GCs and their subsequent dynamical evolution. Nevertheless, the incidence of binaries among multiple populations is still poorly studied. Moreover, the few available observational studies focus only on the bright stars of a few GCs. We used deep images of the GC 47 Tucanae collected with the James Webb and the Hubble space telescopes to investigate the incidence of binaries among multiple populations of M dwarfs and bright main- sequence stars. To reach this objective, we used UV, optical, and near-infrared filters to construct photometric diagrams that allowed us to disentangle binary systems and multiple populations. Moreover, we compared these observations with a large sample of simulated binaries. In the cluster central regions, the incidence of binaries among first-population stars is only slightly higher than that of second- population stars. In contrast, in the external regions, the majority of the studied binaries (≳85%) are composed of first-population stars. These results are consistent with the GC formation scenarios in which the second-population stars originate in the cluster’s central region, forming a compact and dense stellar group within a more extended system of first-population stars.
Key words: techniques: photometric / stars: abundances / Hertzsprung-Russell and C-M diagrams / stars: Population II / globular clusters: individual: NGC 104
© The Authors 2025
 Open Access article, published by EDP Sciences, under the terms of the Creative Commons Attribution License (https://creativecommons.org/licenses/by/4.0), which permits unrestricted use, distribution, and reproduction in any medium, provided the original work is properly cited.
This article is published in open access under the Subscribe to Open model. Subscribe to A&A to support open access publication.
1 Introduction
Galactic globular clusters (GCs) are among the most ancient stellar systems in the Universe and serve as laboratories for testing theories of stellar structure and evolution. Their investigation is complementary to studies based on high-redshift galaxies and helps shed light on the assembly of large-scale structures such as the Galactic halo (e.g. Renzini 2017; D’Antona et al. 2023). One of the most fascinating properties of GCs is that a large fraction of their stars exhibits distinctive chemical compositions that are rarely observed among field stars. These ‘second-population’ (2P) stars are enhanced in some light elements (including helium, nitrogen, aluminium, and sodium) and depleted in others (e.g. carbon and oxygen) with respect to the ‘first-population’ (1P) GC stars, which have the same content of light elements as α-enhanced field stars of similar metallicities (see Kraft 1994; Gratton et al. 2004, 2012, 2019; Bastian & Lardo 2018; Milone & Marino 2022, for reviews).
Although the origin of multiple populations in GCs is a widely debated topic (Cottrell & Da Costa 1981; Dantona et al. 1983; D’Antona et al. 2016; Ventura et al. 2001; Decressin et al. 2007; de Mink et al. 2009; Bastian et al. 2013; Denissenkov & Hartwick 2014; Renzini et al. 2015, 2022; Gieles et al. 2018; Calura et al. 2019; Wang et al. 2020; Lacchin et al. 2022, 2024), most formation scenarios suggest that 2P stars formed in a high- density environment in the innermost GC regions. The binary stars among the distinct stellar populations in GCs are efficient tools for testing this hypothesis and constraining the cluster formation and dynamical evolution. As a consequence of the denser formation environment, the 2P binaries should be more strongly affected by stellar interactions and disrupted at higher rates than 1P binaries (Vesperini et al. 2011; Hong et al. 2015, 2016; Hypki et al. 2022). N-body simulations by Vesperini, Hong, and collaborators show that in multiple-population clusters, a denser 2P system embedded in a less concentrated 1P cluster can lead to similar binary fractions for 1P and 2P stars in the central regions, with 1P binaries making up the majority of the total binaries (Hong et al. 2015, 2016; Milone et al. 2020; Bortolan et al. 2025).
Early observational constraints on the incidence of binaries among 1P and 2P stars of GCs relied on spectroscopy. D’Orazi et al. (2010) detected five barium-rich stars in five GCs and noticed that four of them have sodium and oxygen contents consistent with being 1P stars, with only one belonging to the 2P. The high barium abundance observed in these Ba stars is linked to unseen evolved companions that transferred processed material to the visible star during their asymptotic giant branch phase (e.g. McClure 1989; Luck & Bond 1991). Consequently, the findings by D’Orazi and collaborators suggest a prevalence of binaries among 1P stars.
Similar conclusions come from works based on spectroscopy of binary stars identified by means of radial-velocity variations. Based on a study involving 21 radial-velocity binaries across ten GCs, Lucatello et al. (2015) conclude that the fraction of binaries among 1P stars is 4.1 ±1.7 times higher than the fraction observed among 2P stars. This conclusion aligns with the research by Dalessandro et al. (2018), who determined that out of the 12 radial-velocity binaries in NGC 6362, only 1 belongs to the 2P.
Most of the stars studied spectroscopically are red giant branch (RGB) stars located in the external cluster regions. The first photometric investigation of binaries in the cluster centres relied on multi-band images of bright main-sequence (MS) stars obtained with the Hubble Space Telescope (HST) and yielded puzzling conclusions. In the core of M4, the 1P binaries incidence is about three times higher than the 2P incidence (Milone et al. 2020), and a predominance of 1P binaries is also detected in the central region of NGC 3201 (Marino et al. 2019; Kamann et al. 2020). In contrast, NGC288, NGC6352, NGC 6362, NGC 6397, and NGC6838 exhibit similar binary incidence rates in their central ∼2.7 x 2.7 square-arcmin regions (Milone et al. 2020, 2025).
Recently, we initiated a project to explore faint stars in the GC 47 Tucanae by using spectra and images obtained through the James Webb Space Telescope (JWST) as part of the GO-2560 programme (PI: Anna F. Marino) together with archive HST and JWST images. The initial findings from this project include the pioneering detection of the brown-dwarf cooling sequence within a GC (Marino et al. 2024a), the identification of multiple stellar populations among M dwarfs, and the first determination of their oxygen abundances by means of both photometry and spectroscopy (Milone et al. 2023b; Marino et al. 2024a,b).
In this work, we studied the incidence of binaries among 1P and 2P stars of 47 Tucanae, a GC that hosts a small fraction of binaries (they make up ∼1% of the stars in the central regions; Milone et al. 2012a). The paper is organized as follows. Section 2 presents the dataset and summarizes the data reduction techniques. Section 3 illustrates the methods we used to study the binaries among the multiple populations of 47 Tucanae. The distribution of binaries in the pseudo two-colour diagrams, dubbed ‘chromosome maps’ (ChMs), is discussed in Sect. 4, and Sect. 5 provides a summary of the results and the conclusions.
2 Observations and data reduction
To investigate the binaries among the multiple populations of 47 Tucanae, we analysed stars in two different fields of view: a central field (RA ∼ 00h24m06s, Dec 72d04m53s) and an external field (RA ∼ 00h24m37s, Dec 72d04m06s) located at ∼7 arcmin west of the cluster centre (about 2.2 Rhl where Rhl = 3.17 arcmin is the cluster half-light radius from the 2010 version of the Harris (1996) catalogue).
We used images of the central field collected through the F435W, F606W, and F814W filters of the Wide Field Channel of the Advanced Camera for Surveys (WFC/ACS) and images in the F275W, F343N, F336W, and F438W bands of the Ultraviolet and Visual Channel of the Wide Field Camera 3 (UVIS/WFC3) on board the HST. For the external field, we investigated the M dwarfs of 47 Tucanae by using the photometric catalogues by Marino et al. (2024a), which are obtained from ACS/WFC data in the F606W and F814W bands and images collected through the F322W2 filter of the near-infrared camera (NIRCam) on board the JWST. In addition, we used images collected with the F336W of UVIS/WFC3 and the F435W of WFC/ACS. These data, together with the photometry in the F606W and F814W bands from Marino et al. (2024a), allowed us to explore the upper MS of 47 Tucanae. The main properties of the images used to derive the photometry used in this paper are summarized in Table 1.
Stellar photometry and astrometry are obtained using the computer program KS2, developed by Jay Anderson as an evolution of the program initially developed to reduce ACS/WFC images from GO-10775 in the F606W and F814W bands (Anderson et al. 2008). In summary, KS2 employs three methods for measuring stars, optimizing astrometry and photometry for stars in different luminosity intervals. As our focus lies on relatively bright stars, we relied on the results obtained from method I. This method measures all stellar sources that produce a distinct peak within a 5×5 pixel region after subtracting neighbouring stars.
To achieve this, KS2 calculates the flux and position of each star in each image separately by using the point spread function (PSF) model associated with its position. It also subtracts the sky level, which is computed from the annulus between 4 and 8 pixels from the stellar centre. Finally, the results from all images are averaged to obtain the most accurate determinations of stellar magnitudes and positions. The KS2 computer program offers multiple diagnostics for assessing photometric quality. To ensure high-precision photometry, we included only isolated stars that are well fitted by the PSF model in our analysis (see Sect. 2.4 of Milone et al. 2023a, for details). Moreover, we excluded the region with a radial distance of less than 0.77 arcminutes from the analysis of MS stars in order to avoid the most crowded inner area. The stellar positions derived from the ACS/WFC and UVIS/WFC3 images were corrected for distortion using the solutions provided by Anderson & King (2006), Bellini & Bedin (2009), and Bellini et al. (2011). The photometry has been calibrated into the Vega-mag system by using the procedure outlined by Milone et al. (2023a) and by adopting the encircled energy and the zero points available at the STScI web page1.
We exploited stellar proper motions to separate field stars from cluster members. We calculated the proper motions of stars in the central field as in Milone et al. (2023a), by comparing the stellar positions of images collected at different epochs. For the external field, we used the proper motions by Marino et al. (2024a).
To estimate the photometric errors and create the simulated colour-magnitude diagram (CMD), we conducted artificial star (AS) tests for each field. Following the method outlined by Anderson et al. (2008), we generated a list of 106 ASs with radial distributions and luminosity functions matching those of the observed stars. We adopted for the ASs the F814W instrumental magnitudes, which range from the saturation limit to −5.0 mag2. The photometry and astrometry of the ASs and the selection of the relatively isolated ASs that are well fitted by the PSF model have been carried out with the same procedure used for real stars.
Properties of the used HST and JWST images.
3 Binaries among multiple populations
In this section we describe the procedure that we used to derive the fraction of binaries among 1P and 2P stars of 47 Tucanae and present the results. In a nutshell, this method, detailed in the following subsections, is based on Milone et al. (2020) and Muratore et al. (2024) who estimated the binary incidence among multiple populations in Galactic GCs and Magellanic Cloud young star clusters. It utilizes two photometric diagrams: a CMD, where 1P and 2P stars appear indistinguishable and are used to identify binaries, and another diagram where 1P and 2P stars form distinct sequences. Binary fractions for 1P and 2P stars are inferred by comparing the colour distributions of observed binaries with those from simulated CMDs containing varying 1P and 2P binary fractions. We separately analysed stars with different luminosities and radial distances from the cluster centre. Section 3.1 is focused on binaries among M dwarfs in the external field3, whereas Sect. 3.2 is dedicated to the investigation of upper-MS stars in the central field.
3.1 The M dwarfs
To estimate the fraction of binaries among the multiple populations of M dwarfs in 47 Tucanae, we used the method illustrated in Figs. 3 and 4, which is based on the procedure introduced by Milone et al. (2020) to derive the fractions of binaries composed of 1P and 2P stars along the upper MS of GCs.
The first step consists in selecting groups of bona fide 1P and 2P stars. To do this, we used the ΔCF606W,F814W.F322W2 vs. ΔF606W,F814W ChM of M dwarfs introduced by Marino et al. (2024a), which is reproduced in the top-left panel of Fig. 1. This ChM is composed of MS stars with 20.0 < mF814W < 24.0 mag, thus including the MS region where the sequences of 1P and 2P stars are more evident. As discussed by Marino and collaborators, 1P stars populate the ChM region near the origin of the reference frame, whereas the 2P defines a narrow sequence of stars that extend towards the top-left corner of the ChM. The distribution of stars along the 2P sequence is not uniform but shows stellar overdensities that correspond to sub-populations of stars with different oxygen abundances (Marino et al. 2024a,b). We identified a sample of bona fide 1P stars and four main groups of 2P stars.
Then, we used two pseudo-CMDs, where the multiple populations exhibit very different behaviours. In the mF814W vs. CF606W,F814W,F322W2 diagram plotted in the right panel of Fig. 1 the five stellar populations identified in the ChM define distinct sequences. The pseudo-colour separation among the sequences is well illustrated in the inset, where we superimposed their fiducials (solid lines) and the corresponding fiducials of equal-luminosity binaries4 (dotted lines) on the pseudo- CMD. Furthermore, we introduce the mF814W vs. (mF606W – mF16OW)-0.55(mF6O6W – mF814W) pseudo-CMD in Fig. 2, where the fiducial lines of the five selected stellar groups are nearly superimposed on each other.
This diagram was used to select a sample of binary systems composed of stars with similar luminosities as illustrated in Fig. 3a. The 44 selected binaries are represented with large magenta triangles and are located within the yellow-shaded portion of the pseudo-CMD and delimited by the two orange fiducial lines. Specifically, the left boundary is the fiducial line composed of MS-MS binaries where the secondary component is 1.6 mag fainter than the primary star in the F814W band. Based on diagrams constructed with ASs, this adopted value allows us to minimize the contamination of single stars with large observational errors. The right boundary is the fiducial line of equal-luminosity binaries shifted to the red by three times the pseudo-colour observational error. Figure 3b highlights the selected binaries in the mF814W vs. CF606W,F814W,F322W2 pseudo- CMD together with the fiducial lines of 1P and 2PD stars (solid red and blue lines) and the fiducial line of equal-luminosity 1P binaries (dotted red line). These three fiducials are used to derive the verticalized mF814W vs. δCF606W,F814W,F322W2 plotted in Fig. 3c, which is obtained by using the procedure by Milone et al. (2017, see their Appendix A).
In a nutshell, we considered two groups of stars in the mF814W vs. CF606W,F814W,F322W2 pseudo-CMD, namely group I and II, which are located on the left and right side of the 1P fiducial line, respectively.

where X = CF606W,F814W,F322W2. We have assumed for fiducial A, B, and C the solid blue, solid red, and dotted red fiducial lines of Fig. 3b, respectively. The constant WI and WII indicates the ΔCF606W,F814W,F322W2 pseudo-colour distance between the fiducials B and A at mF814W = 22.25 mag. Similarly, the constant WII refers to the distance between the fiducials C and B at the same F814W magnitude level.
We derived the cumulative distribution of δcF606w,F814w,F322w2 and the corresponding kernel-density distribution (plotted in panels d and e of Fig. 3, respectively). The latter was obtained by assuming a Gaussian kernel with dispersion of 0.02 mag.
The fraction of binaries composed of two 1P stars, two 2P stars, or a 1P and 2P star (hereafter 1P, 2P, and mixed binaries) is derived by comparing the δCF606W,F814W,F322W2 cumulative distribution of the observed binaries and the cumulative distributions derived from grids of simulated CMDs that are constructed by using the ASs. We assumed grids of values that range from 0% to 100% in steps of 1% for the fractions of 1P binaries (f ), 2PX binaries (f
 , where X=A,B,C, and D) and the fraction of mixed binaries (f
 ). For simplicity, we assumed that the 2P components of the mixed binaries have the same probability of belonging to each of the four populations 2PA–D, based on the relative fractions of stars in each of them calculated by Marino et al. (2024a). For each combination of f
 , f
, f and f
and f , we derived the δCF606W,F814W,F322W2 cumulative distribution of the simulated binaries by using the same photometric diagrams and the same procedure adopted for the real stars. This quantity is compared with the corresponding cumulative distribution of the observed binaries by means of χ2.
As summarized in Table 2, we find a predominance of 1P binaries, with the fractions of 1P and 2P binaries corresponding to 84.8±5.0%, and 8.2±4.5%, respectively. The inferred fraction of mixed binaries is 7.0±4.5%. The simulated diagrams that provide the best match with the observations are illustrated in the panels a and b of Fig. 4. The simulated cumulative and kerneldensity distributions of the studied simulated binaries (aqua triangles in Figs. 4a, b) are compared with the corresponding observed distributions.
To assess the uncertainties associated with the binaryfractions, we used ASs to create 10000 pairs of mock mF814W vs. (mF606W – mF160W)-0.55 (mF606W – mF814W) and mF814W vs. CF275W,F343N,F438W photometric diagrams. These diagrams were generated with identical fractions of 1P, 2P and mixed binaries as determined from the observational data. We applied the identical methodology used for real stars to determine the fraction of binaries among the multiple stellar populations within each pair of simulated diagrams. For estimating the uncertainties associated with the observed fractions of 1P binaries, we assumed that the error corresponds to the root mean scatter of the 10000 values of f derived from the simulated diagrams. We adopted a similar criterion to estimate the uncertainties associated with the best estimates of the fractions of 2P and mixed binaries.
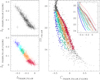 |
Fig. 1 ΔCF606W,F814W,F322W2 vs. ΔFg06w,F814w ChMs for M dwarfs with 20.5 < mF814W < 24.00 mag (left panels) and mF814W vs. CF606W,F814W,F322W2 pseudo-CMD of M dwarfs from Marino et al. (2024a, right panel). The probable 1P, 2PA, 2PB, 2PC, and 2PD stars, selected from the ChM, are coloured crimson, orange, green, cyan, and blue, respectively. The inset in the right panel is a zoomed-in view of the mF814W vs. CF606W,F814W,F322W2 pseudo-CMD around the MS region, where the five stellar populations are more clearly distinguishable. The fiducial lines of the five stellar populations are represented with solid coloured lines, while the dotted lines represent the corresponding fiducial lines for equal-luminosity binaries. |
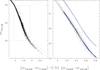 |
Fig. 2 Left: mF814W as a function of the colour difference (mF606W – mF160W)-0.55(mF606W – mF814W) for the stars plotted in Fig. 1. Right: zoomed-in view of the pseudo-CMD plotted in the left panel around the MS region used to derive the ChM. The solid coloured lines, which partially overlap with each other, are the fiducial lines of the five populations identified in the ChM of Fig. 1. The fiducials of the corresponding sequences of equal-luminosity binaries are represented with dotted lines. |
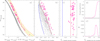 |
Fig. 3 Panel a: reproduction of the mF814W vs. (mF606W – mF160W)-0.55(mF606W – mF814W) pseudo-CMD of Fig. 2. The MS fiducial is represented with the solid black line, whereas the dotted line is the fiducial of equal-luminosity binaries. The orange lines mark the boundaries of the yellow shaded region that we used to select the binaries (magenta triangles). Panel b: mF814W vs. CF606W,F814W,F322W2 pseudo-CMD. The fiducials of 1P and 2PD stars are represented with solid red and blue lines, respectively, and the equal-luminosity 1P binaries fiducial is indicated by the dotted red line. Panel c: verticalized mF814W vs. δCF606W,F814W,F322W2 diagram. Panels d and e: δcF606W,F814W,F322W2 cumulative and kernel-density distributions, respectively. |
Binary fractions among multiple populations.
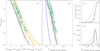 |
Fig. 4 Simulated mF814W vs. (mF606W – mF160W)-0.55(mF606W – mF814W) (panel a) and mF814W vs. CF606W,F814W,F322W2 (panel b) pseudo-CMDs. The adopted fractions of 1P, 2P, and mixed binaries provide the best fit with the observations. The selected binaries, which are located within the yellow shaded area of the panel a diagram, are marked with aqua triangles and the remaining binaries with black symbols. For clarity, the number of plotted simulated binaries is three times larger than the number of observed binaries. The lines plotted in panels a and b reproduce the fiducial lines that we defined in Fig. 3. Panels c and d compare the δCF606W,F814W,F322W2 cumulative and the kernel density distributions, respectively, for the observed binaries (magenta lines) and the best-fit simulations (aqua lines). For completeness, we show the distributions of 1P binaries (solid grey lines), 2P binaries (solid black lines), and mixed binaries (dashed grey lines). |
3.2 The upper main sequence
To investigate the binaries among the bright MS stars (17.25 < mF814W < 19.10 mag) we used the procedure described in Sect. 3.1 and by Milone et al. (2020). We reproduced the ΔCF275W,F343N,F438W vs. ΔF275W,F814W ChM derived by Milone & Marino (2022) in the left panels of Fig. 5 to identify the probable 1P (crimson points in the bottom-left panel of Fig. 5) and 2P stars. In addition, we selected by eye four groups of 2P stars, namely 2Pα, 2Pβ, 2Pγ, 2Pδ, and 2Pɛ.
We present the selected stars in a mF814W vs. CF275W,F343N,F438W pseudo-CMD in the right panel of Fig. 5. As shown in the inset, the selected stellar groups define distinct fiducial lines.
On the contrary, we verified that the fiducials of 1P and 2P stars of 47 Tucanae are nearly coincident in the mF814W vs. (mF336W – mF814W)-0.40(mF606W – mF814W) pseudo- CMD (Fig. 6a). Hence, we used this diagram to identify the sample of 57 probable binaries along the MS.
We used the fiducial lines of 2Pδ, 1P stars, and equal-luminosity 1P binaries superimposed on the mF814W vs. CF275W,F336W,F438W pseudo-CMD of Fig. 6b to derive the verticalized mF814W vs. δCF275W,F343N,F438W diagram plotted in Fig. 6c. To do that, we used Eq. (3) and assumed that WI and WII correspond to the CF275W,F336W,F438W pseudo-colour distance between the solid blue and red fiducials and between the solid red and dotted red fiducials, respectively, at mF814W = 18.3 mag. The cumulative and the kernel-density distributions of the selected binaries are represented in panels d and e of Fig. 6.
To derive the fractions of 1P, 2P, and mixed binaries, we used the procedure outlined in Sect. 3.1 and compared the observed δCF275W,F343N,F438W cumulative distributions and the cumulative distributions of grids of simulated binaries. The best match is provided by a fraction of 17.3±7.3% 1P binaries, 55.8±8.0% 2P binaries, and 26.8±7.3% mixed binaries.
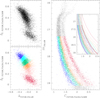 |
Fig. 5 ΔCF275W,F343N,F438W vs. ΔF275W,F814W ChMs for MS stars with 17.25 < mF814W < 19.10 mag (left panels) and mF814W vs. CF275W,F343N,F438W pseudo-CMD (right panel) of stars in the central field from Milone & Marino (2022). The probable 1P stars are coloured crimson, whereas the five groups of 2P stars, namely α, β, γ, δ, and ɛ that we selected from the ChM, are coloured pink, orange, aqua, cyan, and blue, respectively. The solid lines superimposed on the diagram in the inset of the right panel represent the fiducial lines of the six stellar populations, while the corresponding fiducial lines of equal-luminosity binaries are represented with dotted lines. |
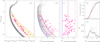 |
Fig. 6 mF814W vs. (mF336W — mF814W)-0.40 (mF606W — mF814W) (panel a) and mF814W vs. CF275W,F343N,F438W (panel b) pseudo-CMDs of stars in the central field. Panel c: verticalized mF814W vs. δCF275W,F36W,F438W diagrams for the MS-MS binaries that we show in panel a and represent with magenta triangles in panels a, b, and c. The δCF275W,F336W,F435W cumulative and the kernel-density distributions of the studied binaries are illustrated with magenta lines in panels d and e, respectively, whereas the corresponding distributions for the simulated binaries that provide the best fit with the observations are coloured aqua. The gray and black lines correspond to the cumulative and the kernel-density distributions of 1P and 2P binaries alone, while the dashed gray lines represent the same distributions for mixed binaries. The solid and the dotted black lines plotted in panel a are the MS fiducial line and the fiducial of equal-luminosity binaries, and the orange lines delimit the yellow shaded area of the CMD, which hosts the studied binaries. The blue lines in panels b and c correspond to the fiducials of 2P stars, and the solid and dotted red lines are the fiducial lines of 1P stars and the fiducial lines of equal-luminosity 1P binaries, respectively. |
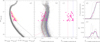 |
Fig. 7 Panel a: reproduction of the mF814W vs. (mF336W – mF814W)-0.40 (mF606W – mF814W) pseudo-CMD of stars in the central field plotted in Fig. 5. Panel b: mF814W vs. CF336W,F435W,F814W pseudo-CMDs. Panel c: Verticalized mF814W vs. δCF336W,F435W,F814W diagram for the MS-MS binaries. The binaries in panel a are represented with magenta triangles in panels a, b, and c. The red and blue lines superimposed in panel b are the fiducials of 1P and 2Pδ stars, respectively, while the corresponding fiducial lines of equal-luminosity binaries are represented with dotted lines in panels b and c. Panels d and e: Cumulative and kernel-density δCF33eW,F435W,F814W distributions, respectively, for the observed binaries (solid magenta lines), for the simulated binaries that provide the best match with the observations (solid aqua lines), 1P binaries (solid grey lines), mixed binaries (dashed grey lines), and 2P binaries (solid black lines). |
3.3 The radial distribution of 1P and 2P binaries
The analysis presented in the previous subsections reveals a predominance of 1P binaries in the outer field, whereas the central field hosts significant amounts of 1P, 2P, and mixed binaries. However, the results in the central field are based on bright MS stars, whereas the study of the outer field is focused on M dwarfs.
To ensure that the results on radial distribution are not influenced by stellar mass and to disentangle the effects of stellar mass and radial distance on the frequencies of binaries among multiple stellar populations, we used the photometry in the F336W, F435W, F606W, and F814W bands, which is available for bright MS stars in both the central and the outer field. The procedure that we used to study the binaries among 1P and 2P stars is similar to the one presented in Sect. 3.2 and is illustrated in Figs. 7 and 8 for stars in the central and external field, respectively. Similarly to what we have done in Sect. 3.2, we used the mF814W vs. (mF336W> – mF814W)-0.40 (mF606W – mF814W) pseudo-CMD to identify the candidate binaries. In this case, we selected all candidate binary systems where the F814W luminosity of the two components differs by less than 1.8 mag (magenta triangles in Figs. 7 and 8).
The b panels of these figures highlight the selected binaries in the mF814W vs. CF336W,F435W,F814W pseudo-CMDs. These diagrams provide a smaller pseudo-colour separation between 1P and 2P stars (e.g. Jang et al. 2022; Milone & Marino 2022). Moreover, the fiducial lines of equal-luminosity 1P and 2P binaries cross their respective single-stars fiducial lines around mF814W = 17.8 and 19.0 mag, thus making it challenging to identify binaries among multiple populations for mF814W ≳ 17.8. Nevertheless, this diagram allows us to homogeneously analyse bright MS stars with different radial distances.
Figures 7c and 8c show the mF814W vs. δcF336W,F435W,F814W diagram for the selected binaries. In this case, we used the fiducial lines of equal-luminosity binaries to verticalize the pseudo-CMD. Finally, panels d and e of Figs. 7 and 8 illustrate the δCF336W,F435W,F814W cumulative and kernel-density distributions (magenta lines) of the selected binaries. We also show the distributions of the simulated binaries that provide the best fit with the observations (aqua lines), and of 1P binaries (solid grey lines), mixed binaries (dashed grey lines), and 2P binaries (black lines).
We find that the central field hosts 1P, 2P, and mixed binary systems, which comprise 25.6±9.5%, 53.5±10.5%, and 20.9±8.3% of the 35 studied binaries, respectively. In contrast, the six binary stars that we studied in the outer-field are all composed of 1P pairs. The results of this section thus confirm the radial trend in the fraction of 1P and 2P binaries found in the previous subsection using M dwarfs for the outer field.
The ChMs of the observed 47 Tucanae stars are shown in Fig. 10, where we also plot the simulated 1P binaries. The binary systems studied in Sect. 3 and the remaining probable binaries are also marked. The simulated 1P binaries overlap with a small portion of the observed binaries in the central-field ChMs, whereas the majority of both observed and simulated binaries are located in the same region of the outer-field ChM. These observations qualitatively confirm the conclusion of Sect. 3 that the central field is populated by both 1P and 2P binaries, whereas 1P binaries are more prevalent in the external regions of 47 Tucanae.
4 Chromosome map of binaries
In our opinion, the procedure introduced in the previous section is the optimal method for quantifying the fractions of binaries among 1P and 2P stars in GCs. Furthermore, the examination of the ChM can offer a qualitative yet direct perspective on the distribution of binaries among the different populations.
4.1 Binaries and multiple populations along the MS
The top panel of Fig. 9 shows the simulated ΔCF275W,F343N,F435W vs.  ChM for MS binaries of 47 Tucanae with 17.25 < mF814W < 19.10 mag. The ordinate of this diagram is derived as in Milone et al. (2017) by using the mF814W vs. CF275W,F343N,F438W diagram. The abscissa is obtained from the mF814W vs. mF275W – mF814W CMD and is calculated as
 (2)
(2)
where the quantity ΔF275W,F814W is defined by Milone et al. (2017, see their Sect. 3.2) and Wbin is the mF275W – mF814W colour separation at mF814W = 18.3 mag between the fiducial line that marks the red boundary of the MS (fiducial R) and the corresponding fiducial line shifted by 0.752 mag to the bright side (fiducial bin; see Milone et al. 2017, for details). To simulate the binary systems, we combined the colour and the magnitudes of MS stars located on the fiducial lines of each population. Stellar masses were inferred using the isochrones from Dotter et al. (2008), which provide the best match with the mF814W vs. mF606W – mF814W Cmd. For the binaries, we adopted a flat mass-ratio distribution. We used the same method to generate ΔCF336W,F435W,F814W vs.  and ΔCF606W,F814W,F322W2 vs.
  ChMs, which we present in the middle and bottom panel of Fig. 9 for MS binaries in the same magnitude intervals used for real stars. Clearly, the 1P and 2P binaries populate different regions of these ChMs.
4.2 Binaries and multiple populations along the RGB
For completeness, in this subsection we investigate the frequency of 1P and 2P binaries along the RGB. To investigate the distribution of binary systems composed of at least one RGB star in the mF814W vs. mF275W – mF814W CMD, we show the fiducial line of MS, sub giant branch (SGB), and RGB stars and the fiducial of binary systems composed of pairs of stars with the same luminosity and evolutionary stage in Fig. 11. The region of the CMD that includes binaries with mF814W ≳ 13.8 mag is also populated by evolved blue strugglers5.
The middle panel of Fig. 11 shows the mF814W vs. CF275W,F343N,F435W pseudo-CMD of the stars in the central field. The ΔF275W,F343N,F435W vs.  ChM is plotted in the top-right panel for RGB stars with 13.0 < mF814W < 16.0 mag. This ChM is derived by following the recipe used for the MS but in this case we account for the fact that the fiducial of equal-luminosity RGB binaries is bluer than the RGB boundaries, by using the relation
 (3)
(3)
where the F275W-F814W RGB width, W, and the quantity ΔF275W,F814W is defined by Milone et al. (2017, see their Sects. 3.1 and 3.2), and Wbin is the mF275W – mF814W absolute value of the colour separation at mF814W =14.8 mag between the fiducial line that marks the blue boundary of the MS (fiducial B) and the corresponding fiducial line shifted by 0.752 mag to the bright side (fiducial bin).
As demonstrated by Marino et al. (2019), RGB binaries exhibit lower values of ΔF275W,F814W than the bulk of single stars, thus populating the left region of the ChM. As expected, the selected stars populate the region of the mF814W vs. mF275W – mF814W CMD occupied by binaries.
To qualitatively associate binary stars with 1P and 2P stars, we simulated RGB binaries composed of 1P RGB stars, and 2P RGB stars with intermediate and extreme chemical compositions. The simulated binaries are shown in the ChM plotted in the bottom-right panel of Fig. 11 and are superimposed on the observed RGB stars (grey points). We notice that six binaries only are consistent with IP binaries, whereas the remaining selected binaries are probably composed of 2P stars or mixed. A similar conclusion is provided by the visual inspection of the mF814W vs. CF275W,F343N,F435W pseudo-CMD plotted in the middle panel of Fig. 11. A quantitative determination of the frequency of binaries among 1P and 2P RGB stars is challenged by the fact that the selected candidate binaries could comprise evolved blue stragglers, for which accurate models are not available to us. Nevertheless, the comparison between the observed ChM of RGB stars in 47 Tucanae and the simulated ChMs of 1P and 2P binaries corroborates the conclusion derived from MS stars that both 1P and 2P binaries populate the central region of 47 Tucanae.
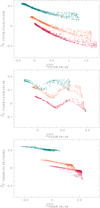 |
Fig. 9 Simulated ChMs for upper-MS stars of 47 Tucanae. Crimson, orange, and teal indicate 1P, 2Pβ, and 2Pɛ binaries, respectively. The triangles, crosses, and circles indicate the binaries with mass ratios q > 0.8, 0.6 < q < 0.8, and q < 0.6, respectively. |
5 Summary and discussion
In this study we used multi-band HST and JWST photometry of 47 Tucanae to estimate the fraction of binaries among 1P and 2P stars. In contrast with previous works on other GCs, which are limited to either the cluster centre or the external regions (D’Orazi et al. 2010; Lucatello et al. 2015; Dalessandro et al. 2018; Marino et al. 2019; Kamann et al. 2020; Milone et al. 2020), we homogeneously analysed two distinct fields with different radial distances from the centre of 47 Tucanae. We used the method from Milone et al. (2020), which consists of three main steps: (i) the identification of 1P and 2P stars, (ii) the selection of binary systems composed of stars with similar luminosities, and (iii) the analysis of the pseudo-colours of the selected binaries, which are indicative of their chemical composition.
In the central field, we took advantage of the ΔCF275W.F343N,F435W vs. ΔF275W,F814W ChM to identify the bulk of 1P and 2P stars along the upper MS, together with five subgroups of 2Pα-ɛ, stars. We identified a sample of MS-MS binaries using the mF814W vs. mF336W – mF814W)−0-40(mF606W – mF814W) pseudo-CMD, where the fiducial lines of the multiple stellar populations are nearly coincident. Finally, we analysed the CF275W,F343N,F435W pseudo-colour distribution of the observed binary stars and compared it to the distributions from a large set of simulated stellar populations. These simulations encompassed various combinations of 1P, 2P, and mixed stars. We find that about 18% and 56% of the studied binaries are composed of 1P and 2P stars, respectively. The remaining ∼26% of binaries are probable mixed stellar systems.
We analysed both M-dwarfs and bright MS stars located in the external field. The 1P and 2P M-dwarfs were identified from the ΔCF606W,F814W,F322W2 vs. ΔF606W,F814W ChM and the binaries from the mF814W vs. mF606W − mF160W)−0.55(mF606W − mF814W) pseudo-CMD. In this case, the fraction of binaries among the multiple populations was inferred by comparing the ΔCF606W,F814W,F322W2 pseudo-colour of the selected binaries with that of a large sample of simulated binaries. Most binaries, ∼85%, are composed of 1P stars. These results are illustrated in the top panel of Fig. 12 and are confirmed by the analysis of bright MS stars in the mF814W vs. CF336W,F435W,F814W pseudo-CMD in both the inner and outer fields.
As illustrated in the bottom panel of Fig. 12, the multiple stellar populations of 47 Tucanae exhibit different radial distributions, with 2P stars being significantly more centrally concentrated than the 1P ones (e.g. Milone et al. 2012b; Cordero et al. 2014; Dondoglio et al. 2021; Lee 2022; Mehta et al. 2025). In particular, the fraction of 1P stars in the cluster centre and in the external field studied in this study is ∼20% and 40%, respectively (Milone et al. 2017; Marino et al. 2024a).
The incidence of 1P binaries can be estimated as the ratio between the fractions of 1P binaries and the fractions of 1P stars (from Milone et al. 2012b; Marino et al. 2024a), and the analogous relation can be adopted for the incidence of 2P binaries. Hence, in the cluster centre, the incidence of 1P binaries is slightly (∼1.3 times) higher than that of 2P binaries. In contrast, the outer regions predominantly feature 1P binaries.
The present-day fractions of binaries among 1P and 2P stars provide information on the origin and the dynamic evolution of multiple stellar populations in GCs. Binary systems have been widely investigated in the context of GC formation scenarios, in which the 2P stars formed in a high-density environment in the innermost region of a more extended 1P. Such a configuration is adopted in various scenarios for the formation of 2P stars (e.g. D’Ercole et al. 2008, 2012; Bekki 2010; Lacchin et al. 2022) and is consistent with the expected initial configuration of various scenarios (e.g. Bastian et al. 2013; Gieles et al. 2018).
Studies based on analytic calculations and N-body simulations suggest that the exact values of the current fractions of 1P and 2P binaries are influenced by several factors. These include the initial numbers and configurations of 1P and 2P stars, the evolution and disruption of binary systems, and the changes in the spatial distributions of 1P and 2P single and binary stars over time. Nevertheless, these simulations show that, due to the dense environment, 2P binaries evolve and are disrupted at a much higher rate than 1P binaries. Consequently, the present-day 2P population is expected to have a lower global binary incidence compared to the 1P population (Vesperini et al. 2011; Hong et al. 2015, 2016, 2019). These studies, which assume different initial radial distributions of 1P and 2P stars, with the 2P initially more centrally concentrated, predict radial variations in the incidence of 1P and 2P binaries, with the most pronounced differences observed in the outermost regions of the cluster (e.g. Hong et al. 2016; Milone et al. 2020).
The evidence of a radial gradient in the incidence of 1P and 2P binaries in 47 Tucanae, and the fact that the external regions are mostly populated by 1P binaries, is in general agreement with the predictions of those theoretical studies and corroborate the possibility that 2P stars formed in a dense subsystem in the innermost cluster regions. Similarly, the finding of mixed binary systems composed of one 1P and one 2P star is qualitatively consistent with the findings of the simulations by Hong et al. (2015, 2016), who postulate that, due to stellar encounters, one of the binary-system components can be replaced by one of the interacting stars of a different population, thus producing a mixed binary system.
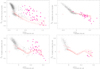 |
Fig. 10 ChMs for stars in the central field (left panels) and in the outer field (right panels). The binaries selected in Figs. 3a, 6a, 7a, and 8a are represented with large magenta triangles. The remaining candidate binaries are plotted with black circles. The dashed red lines separate the bulk of single 1P and 2P stars, which are located below and above the lines, respectively. The pink points show simulated 1P binaries. |
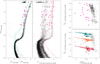 |
Fig. 11 mF814W vs. mF275W – mF814W CMD (left) and mF814W vs. CF275W,F343N,F435W pseudo-CMD (middle) of stars in the central field zoomed in around the RGB. The solid aqua line plotted in the left panel is the fiducial line of the MS, SGB, and RGB. The dashed line represents the fiducial of equal-luminosity stars, and the fiducial line of binary systems composed of one MS turn-off star is plotted with the dot-dashed line. The probable RGB binaries, selected from the ΔF275W,F343N,F435W vs. |

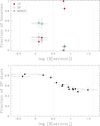 |
Fig. 12 Top: fractions of 1P binaries (dots), 2P binaries (starred symbols), and mixed binaries (triangles) derived in this study against the logarithm of the radial distance from the centre of 47 Tucanae. Bottom: fraction of 2P stars as a function of radial distance, in logarithm scale, from the literature (Milone et al. 2017; Dondoglio et al. 2021; Marino et al. 2024a; Mehta et al. 2025). The vertical dotted, dashed, and dashed- dotted lines mark the core, half-light, and tidal radius, respectively, from the 2010 edition of the Harris (1996) catalogue. |
Acknowledgements
We thank the anonymous referee for their valuable suggestions, which have improved the manuscript. This work has been funded by the European Union – NextGenerationEU RRF M4C2 1.1 (PRIN 2022 2022MMEB9W: “Understanding the formation of globular clusters with their multiple stellar generations”, CUP C53D23001200006). (PI Anna F. Marino), from INAF Research GTO-Grant Normal RSN2-1.05.12.05.10 – (ref. Anna F. Marino) of the “Bando INAF per il Finanziamento della Ricerca Fondamentale 2022”, and from the European Union’s Horizon 2020 research and innovation programme under the Marie Sklodowska-Curie Grant Agreement No. 101034319 and from the European Union – NextGenerationEU (beneficiary: T. Ziliotto). SJ acknowledges support from the National Research Foundation of Korea (2022R1A2C3002992, 2022R1A6A1A03053472). J.-W. Lee acknowledges financial support from the Basic Science Research Program (grant no. 2019R1A2C2086290) through the National Research Foundation of Korea. EV acknowledges support from NSF grant AST-2009193. This work is based on observations made with the NASA/ESA/CSA JWST. The data were obtained from the Mikulski Archive for Space Telescopes at the Space Telescope Science Institute, which is operated by the Association of Universities for Research in Astronomy, Inc., under NASA contract NAS 5-03127 for JWST. These observations are associated with programme GO-2559 and GO-2560. This research is also based on observations made with the NASA/ESA HST obtained from the Space Telescope Science Institute, which is operated by the Association of Universities for Research in Astronomy, Inc., under NASA contract NAS 526555.
References
- Anderson, J., & King, I. R. 2006, PSFs, Photometry, and Astronomy for the ACS/WFC, Instrument Science Report ACS 2006-01, 34 [Google Scholar]
- Anderson, J., Sarajedini, A., Bedin, L. R., et al. 2008, AJ, 135, 2055 [Google Scholar]
- Bastian, N., & Lardo, C. 2018, ARA&A, 56, 83 [Google Scholar]
- Bastian, N., Lamers, H. J. G. L. M., de Mink, S. E., et al. 2013, MNRAS, 436, 2398 [CrossRef] [Google Scholar]
- Bekki, K. 2010, ApJ, 724, L99 [CrossRef] [Google Scholar]
- Bellini, A., & Bedin, L. R. 2009, PASP, 121, 1419 [CrossRef] [Google Scholar]
- Bellini, A., Anderson, J., & Bedin, L. R. 2011, PASP, 123, 622 [CrossRef] [Google Scholar]
- Bortolan, E., Bruce, J., Milone, A. P., et al. 2025, A&A, 696, A220 [NASA ADS] [CrossRef] [EDP Sciences] [Google Scholar]
- Calura, F., D’Ercole, A., Vesperini, E., Vanzella, E., & Sollima, A. 2019, MNRAS, 489, 3269 [Google Scholar]
- Cordero, M. J., Pilachowski, C. A., Johnson, C. I., et al. 2014, ApJ, 780, 94 [Google Scholar]
- Cottrell, P. L., & Da Costa, G. S. 1981, ApJ, 245, L79 [NASA ADS] [CrossRef] [Google Scholar]
- Dalessandro, E., Mucciarelli, A., Bellazzini, M., et al. 2018, ApJ, 864, 33 [NASA ADS] [CrossRef] [Google Scholar]
- Dantona, F., Gratton, R., & Chieffi, A. 1983, Mem. Soc. Astron. Italiana, 54, 173 [Google Scholar]
- D’Antona, F., Vesperini, E., D’Ercole, A., et al. 2016, MNRAS, 458, 2122 [Google Scholar]
- D’Antona, F., Vesperini, E., Calura, F., et al. 2023, A&A, 680, L19 [NASA ADS] [CrossRef] [EDP Sciences] [Google Scholar]
- Decressin, T., Meynet, G., Charbonnel, C., Prantzos, N., & Ekström, S. 2007, A&A, 464, 1029 [NASA ADS] [CrossRef] [EDP Sciences] [Google Scholar]
- de Mink, S. E., Pols, O. R., Langer, N., & Izzard, R. G. 2009, A&A, 507, L1 [NASA ADS] [CrossRef] [EDP Sciences] [Google Scholar]
- Denissenkov, P. A., & Hartwick, F. D. A. 2014, MNRAS, 437, L21 [Google Scholar]
- D’Ercole, A., Vesperini, E., D’Antona, F., McMillan, S. L. W., & Recchi, S. 2008, MNRAS, 391, 825 [CrossRef] [Google Scholar]
- Milone, A. P., et al.: A&A proofs, manuscript no. aa52136-24 [Google Scholar]
- D’Ercole, A., D’Antona, F., Carini, R., Vesperini, E., & Ventura, P. 2012, MNRAS, 423, 1521 [Google Scholar]
- Dondoglio, E., Milone, A. P., Lagioia, E. P., et al. 2021, ApJ, 906, 76 [NASA ADS] [CrossRef] [Google Scholar]
- D’Orazi, V., Gratton, R., Lucatello, S., et al. 2010, ApJ, 719, L213 [CrossRef] [Google Scholar]
- Dotter, A., Chaboyer, B., JevremoviC, D., et al. 2008, ApJS, 178, 89 [NASA ADS] [CrossRef] [Google Scholar]
- Gieles, M., Charbonnel, C., Krause, M. G. H., et al. 2018, MNRAS, 478, 2461 [Google Scholar]
- Gratton, R., Sneden, C., & Carretta, E. 2004, ARA&A, 42, 385 [Google Scholar]
- Gratton, R. G., Carretta, E., & Bragaglia, A. 2012, A&A Rev., 20, 50 [NASA ADS] [CrossRef] [Google Scholar]
- Gratton, R., Bragaglia, A., Carretta, E., et al. 2019, A&A Rev., 27, 8 [NASA ADS] [CrossRef] [Google Scholar]
- Harris, W. E. 1996, AJ, 112, 1487 [Google Scholar]
- Hong, J., Vesperini, E., Sollima, A., et al. 2015, MNRAS, 449, 629 [NASA ADS] [CrossRef] [Google Scholar]
- Hong, J., Vesperini, E., Sollima, A., et al. 2016, MNRAS, 457, 4507 [NASA ADS] [CrossRef] [Google Scholar]
- Hong, J., Patel, S., Vesperini, E., Webb, J. J., & Dalessandro, E. 2019, MNRAS, 483, 2592 [Google Scholar]
- Hypki, A., Giersz, M., Hong, J., et al. 2022, MNRAS, 517, 4768 [NASA ADS] [CrossRef] [Google Scholar]
- Jang, S., Milone, A. P., Legnardi, M. V., et al. 2022, MNRAS, 517, 5687 [CrossRef] [Google Scholar]
- Kamann, S., Giesers, B., Bastian, N., et al. 2020, A&A, 635, A65 [Google Scholar]
- Kraft, R. P. 1994, PASP, 106, 553 [Google Scholar]
- Lacchin, E., Calura, F., Vesperini, E., & Mastrobuono-Battisti, A. 2022, MNRAS, 517, 1171 [NASA ADS] [CrossRef] [Google Scholar]
- Lacchin, E., Mastrobuono-Battisti, A., Calura, F., et al. 2024, A&A, 681, A45 [NASA ADS] [CrossRef] [EDP Sciences] [Google Scholar]
- Lee, J.-W. 2022, ApJS, 263, 20 [NASA ADS] [CrossRef] [Google Scholar]
- Lucatello, S., Sollima, A., Gratton, R., et al. 2015, A&A, 584, A52 [NASA ADS] [CrossRef] [EDP Sciences] [Google Scholar]
- Luck, R. E., & Bond, H. E. 1991, ApJS, 77, 515 [Google Scholar]
- Marino, A. F., Milone, A. P., Sills, A., et al. 2019, ApJ, 887, 91 [NASA ADS] [CrossRef] [Google Scholar]
- Marino, A. F., Milone, A. P., Legnardi, M. V., et al. 2024a, ApJ, 965, 189 [NASA ADS] [CrossRef] [Google Scholar]
- Marino, A. F., Milone, A. P., Renzini, A., et al. 2024b, ApJ, 969, L8 [Google Scholar]
- McClure, R. D. 1989, in IAU Colloq. 106: Evolution of Peculiar Red Giant Stars, eds. H. R. Johnson, & B. Zuckerman, 196 [Google Scholar]
- Mehta, V. J., Milone, A. P., Casagrande, L., et al. 2025, MNRAS, 536, 1077 [Google Scholar]
- Milone, A. P., & Marino, A. F. 2022, Universe, 8, 359 [NASA ADS] [CrossRef] [Google Scholar]
- Milone, A. P., Piotto, G., Bedin, L. R., et al. 2012a, A&A, 540, A16 [NASA ADS] [CrossRef] [EDP Sciences] [Google Scholar]
- Milone, A. P., Piotto, G., Bedin, L. R., et al. 2012b, ApJ, 744, 58 [NASA ADS] [CrossRef] [Google Scholar]
- Milone, A. P., Piotto, G., Renzini, A., et al. 2017, MNRAS, 464, 3636 [Google Scholar]
- Milone, A. P., Vesperini, E., Marino, A. F., et al. 2020, MNRAS, 492, 5457 [Google Scholar]
- Milone, A. P., Cordoni, G., Marino, A. F., et al. 2023a, A&A, 672, A161 [NASA ADS] [CrossRef] [EDP Sciences] [Google Scholar]
- Milone, A. P., Marino, A. F., Dotter, A., et al. 2023b, MNRAS, 522, 2429 [CrossRef] [Google Scholar]
- Milone, A. P., Cordoni, G., Marino, A. F., et al. 2025, A&A, 696, A221 [NASA ADS] [CrossRef] [EDP Sciences] [Google Scholar]
- Muratore, F., Milone, A. P., D’Antona, F., et al. 2024, A&A, 692, A135 [NASA ADS] [CrossRef] [EDP Sciences] [Google Scholar]
- Renzini, A., 2017, MNRAS, 469, L63 [Google Scholar]
- Renzini, A., D’Antona, F., Cassisi, S., et al. 2015, MNRAS, 454, 4197 [Google Scholar]
- Renzini, A., Marino, A. F., & Milone, A. P. 2022, MNRAS, 513, 2111 [NASA ADS] [CrossRef] [Google Scholar]
- Ventura, P., D’Antona, F., Mazzitelli, I., & Gratton, R. 2001, ApJ, 550, L65 [CrossRef] [Google Scholar]
- Vesperini, E., McMillan, S. L. W., D’Antona, F., & D’Ercole, A. 2011, MNRAS, 416, 355 [NASA ADS] [Google Scholar]
- Wang, L., Kroupa, P., Takahashi, K., & Jerabkova, T. 2020, MNRAS, 491, 440 [Google Scholar]
While NIRCam data are unavailable for the cluster centre, the HST archive includes IR/WFC images in F110W and F160W (GO-11664, PI., Brown). These filters can identify multiple populations below the MS knee, but crowding makes distinguishing 1P and 2P stars in the cluster centre challenging. Hence, we only investigated binaries among M dwarfs in the external regions.
The fiducial lines shown in the left panel of Fig. 11 are used to illustrate the CMD region populated by RGB binaries. For simplicity, we derived these fiducials by considering both 1P and 2P stars. The fiducial of single RGB stars composed by 1P stars only and the fiducials of binary systems that host one 1P RGB star would exhibit slightly redder mF275W – mF814W colour. Similarly, the corresponding fiducials derived from 2P RGB stars would be bluer than those plotted in Fig. 11.
All Tables
All Figures
|
Fig. 1 ΔCF606W,F814W,F322W2 vs. ΔFg06w,F814w ChMs for M dwarfs with 20.5 < mF814W < 24.00 mag (left panels) and mF814W vs. CF606W,F814W,F322W2 pseudo-CMD of M dwarfs from Marino et al. (2024a, right panel). The probable 1P, 2PA, 2PB, 2PC, and 2PD stars, selected from the ChM, are coloured crimson, orange, green, cyan, and blue, respectively. The inset in the right panel is a zoomed-in view of the mF814W vs. CF606W,F814W,F322W2 pseudo-CMD around the MS region, where the five stellar populations are more clearly distinguishable. The fiducial lines of the five stellar populations are represented with solid coloured lines, while the dotted lines represent the corresponding fiducial lines for equal-luminosity binaries. |
| In the text | |
|
Fig. 2 Left: mF814W as a function of the colour difference (mF606W – mF160W)-0.55(mF606W – mF814W) for the stars plotted in Fig. 1. Right: zoomed-in view of the pseudo-CMD plotted in the left panel around the MS region used to derive the ChM. The solid coloured lines, which partially overlap with each other, are the fiducial lines of the five populations identified in the ChM of Fig. 1. The fiducials of the corresponding sequences of equal-luminosity binaries are represented with dotted lines. |
| In the text | |
|
Fig. 3 Panel a: reproduction of the mF814W vs. (mF606W – mF160W)-0.55(mF606W – mF814W) pseudo-CMD of Fig. 2. The MS fiducial is represented with the solid black line, whereas the dotted line is the fiducial of equal-luminosity binaries. The orange lines mark the boundaries of the yellow shaded region that we used to select the binaries (magenta triangles). Panel b: mF814W vs. CF606W,F814W,F322W2 pseudo-CMD. The fiducials of 1P and 2PD stars are represented with solid red and blue lines, respectively, and the equal-luminosity 1P binaries fiducial is indicated by the dotted red line. Panel c: verticalized mF814W vs. δCF606W,F814W,F322W2 diagram. Panels d and e: δcF606W,F814W,F322W2 cumulative and kernel-density distributions, respectively. |
| In the text | |
|
Fig. 4 Simulated mF814W vs. (mF606W – mF160W)-0.55(mF606W – mF814W) (panel a) and mF814W vs. CF606W,F814W,F322W2 (panel b) pseudo-CMDs. The adopted fractions of 1P, 2P, and mixed binaries provide the best fit with the observations. The selected binaries, which are located within the yellow shaded area of the panel a diagram, are marked with aqua triangles and the remaining binaries with black symbols. For clarity, the number of plotted simulated binaries is three times larger than the number of observed binaries. The lines plotted in panels a and b reproduce the fiducial lines that we defined in Fig. 3. Panels c and d compare the δCF606W,F814W,F322W2 cumulative and the kernel density distributions, respectively, for the observed binaries (magenta lines) and the best-fit simulations (aqua lines). For completeness, we show the distributions of 1P binaries (solid grey lines), 2P binaries (solid black lines), and mixed binaries (dashed grey lines). |
| In the text | |
|
Fig. 5 ΔCF275W,F343N,F438W vs. ΔF275W,F814W ChMs for MS stars with 17.25 < mF814W < 19.10 mag (left panels) and mF814W vs. CF275W,F343N,F438W pseudo-CMD (right panel) of stars in the central field from Milone & Marino (2022). The probable 1P stars are coloured crimson, whereas the five groups of 2P stars, namely α, β, γ, δ, and ɛ that we selected from the ChM, are coloured pink, orange, aqua, cyan, and blue, respectively. The solid lines superimposed on the diagram in the inset of the right panel represent the fiducial lines of the six stellar populations, while the corresponding fiducial lines of equal-luminosity binaries are represented with dotted lines. |
| In the text | |
|
Fig. 6 mF814W vs. (mF336W — mF814W)-0.40 (mF606W — mF814W) (panel a) and mF814W vs. CF275W,F343N,F438W (panel b) pseudo-CMDs of stars in the central field. Panel c: verticalized mF814W vs. δCF275W,F36W,F438W diagrams for the MS-MS binaries that we show in panel a and represent with magenta triangles in panels a, b, and c. The δCF275W,F336W,F435W cumulative and the kernel-density distributions of the studied binaries are illustrated with magenta lines in panels d and e, respectively, whereas the corresponding distributions for the simulated binaries that provide the best fit with the observations are coloured aqua. The gray and black lines correspond to the cumulative and the kernel-density distributions of 1P and 2P binaries alone, while the dashed gray lines represent the same distributions for mixed binaries. The solid and the dotted black lines plotted in panel a are the MS fiducial line and the fiducial of equal-luminosity binaries, and the orange lines delimit the yellow shaded area of the CMD, which hosts the studied binaries. The blue lines in panels b and c correspond to the fiducials of 2P stars, and the solid and dotted red lines are the fiducial lines of 1P stars and the fiducial lines of equal-luminosity 1P binaries, respectively. |
| In the text | |
|
Fig. 7 Panel a: reproduction of the mF814W vs. (mF336W – mF814W)-0.40 (mF606W – mF814W) pseudo-CMD of stars in the central field plotted in Fig. 5. Panel b: mF814W vs. CF336W,F435W,F814W pseudo-CMDs. Panel c: Verticalized mF814W vs. δCF336W,F435W,F814W diagram for the MS-MS binaries. The binaries in panel a are represented with magenta triangles in panels a, b, and c. The red and blue lines superimposed in panel b are the fiducials of 1P and 2Pδ stars, respectively, while the corresponding fiducial lines of equal-luminosity binaries are represented with dotted lines in panels b and c. Panels d and e: Cumulative and kernel-density δCF33eW,F435W,F814W distributions, respectively, for the observed binaries (solid magenta lines), for the simulated binaries that provide the best match with the observations (solid aqua lines), 1P binaries (solid grey lines), mixed binaries (dashed grey lines), and 2P binaries (solid black lines). |
| In the text | |
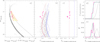 |
Fig. 8 Same as Fig. 7 but for stars in the outer field. |
| In the text | |
|
Fig. 9 Simulated ChMs for upper-MS stars of 47 Tucanae. Crimson, orange, and teal indicate 1P, 2Pβ, and 2Pɛ binaries, respectively. The triangles, crosses, and circles indicate the binaries with mass ratios q > 0.8, 0.6 < q < 0.8, and q < 0.6, respectively. |
| In the text | |
|
Fig. 10 ChMs for stars in the central field (left panels) and in the outer field (right panels). The binaries selected in Figs. 3a, 6a, 7a, and 8a are represented with large magenta triangles. The remaining candidate binaries are plotted with black circles. The dashed red lines separate the bulk of single 1P and 2P stars, which are located below and above the lines, respectively. The pink points show simulated 1P binaries. |
| In the text | |
|
Fig. 11 mF814W vs. mF275W – mF814W CMD (left) and mF814W vs. CF275W,F343N,F435W pseudo-CMD (middle) of stars in the central field zoomed in around the RGB. The solid aqua line plotted in the left panel is the fiducial line of the MS, SGB, and RGB. The dashed line represents the fiducial of equal-luminosity stars, and the fiducial line of binary systems composed of one MS turn-off star is plotted with the dot-dashed line. The probable RGB binaries, selected from the ΔF275W,F343N,F435W vs. |
| In the text | |
|
Fig. 12 Top: fractions of 1P binaries (dots), 2P binaries (starred symbols), and mixed binaries (triangles) derived in this study against the logarithm of the radial distance from the centre of 47 Tucanae. Bottom: fraction of 2P stars as a function of radial distance, in logarithm scale, from the literature (Milone et al. 2017; Dondoglio et al. 2021; Marino et al. 2024a; Mehta et al. 2025). The vertical dotted, dashed, and dashed- dotted lines mark the core, half-light, and tidal radius, respectively, from the 2010 edition of the Harris (1996) catalogue. |
| In the text | |
Current usage metrics show cumulative count of Article Views (full-text article views including HTML views, PDF and ePub downloads, according to the available data) and Abstracts Views on Vision4Press platform.
Data correspond to usage on the plateform after 2015. The current usage metrics is available 48-96 hours after online publication and is updated daily on week days.
Initial download of the metrics may take a while.