Fig. 4
Download original image
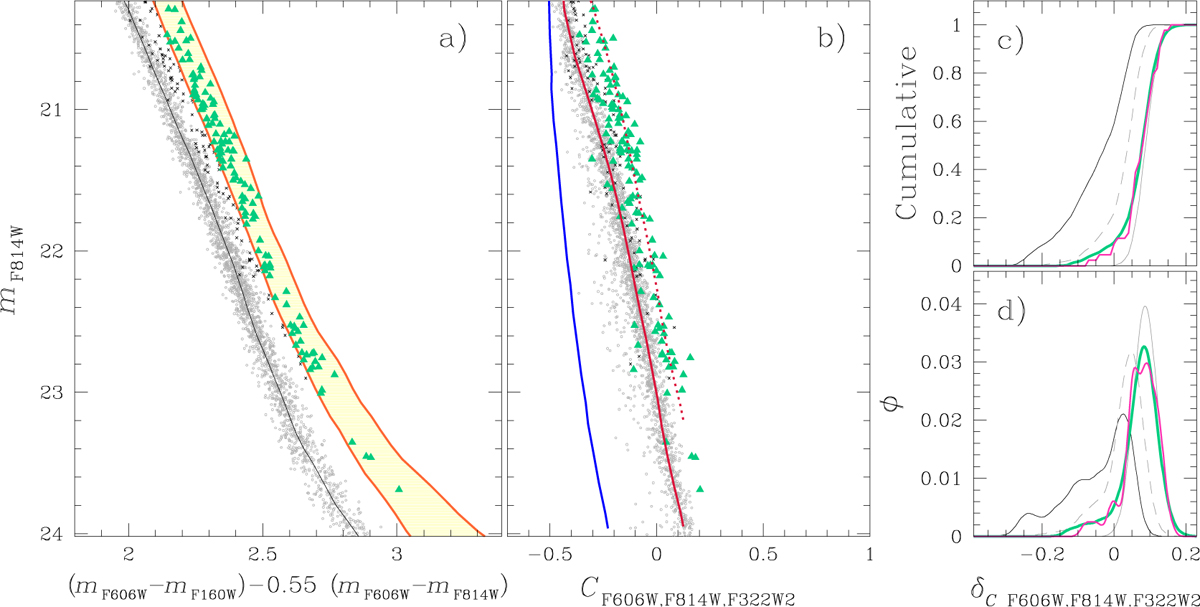
Simulated mF814W vs. (mF606W – mF160W)-0.55(mF606W – mF814W) (panel a) and mF814W vs. CF606W,F814W,F322W2 (panel b) pseudo-CMDs. The adopted fractions of 1P, 2P, and mixed binaries provide the best fit with the observations. The selected binaries, which are located within the yellow shaded area of the panel a diagram, are marked with aqua triangles and the remaining binaries with black symbols. For clarity, the number of plotted simulated binaries is three times larger than the number of observed binaries. The lines plotted in panels a and b reproduce the fiducial lines that we defined in Fig. 3. Panels c and d compare the δCF606W,F814W,F322W2 cumulative and the kernel density distributions, respectively, for the observed binaries (magenta lines) and the best-fit simulations (aqua lines). For completeness, we show the distributions of 1P binaries (solid grey lines), 2P binaries (solid black lines), and mixed binaries (dashed grey lines).
Current usage metrics show cumulative count of Article Views (full-text article views including HTML views, PDF and ePub downloads, according to the available data) and Abstracts Views on Vision4Press platform.
Data correspond to usage on the plateform after 2015. The current usage metrics is available 48-96 hours after online publication and is updated daily on week days.
Initial download of the metrics may take a while.