Fig. 7
Download original image
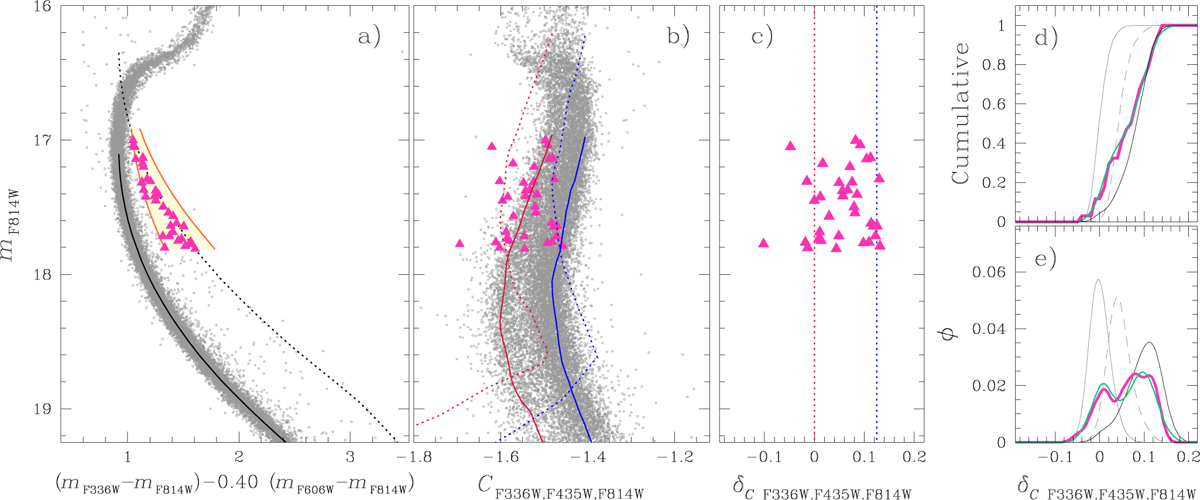
Panel a: reproduction of the mF814W vs. (mF336W – mF814W)-0.40 (mF606W – mF814W) pseudo-CMD of stars in the central field plotted in Fig. 5. Panel b: mF814W vs. CF336W,F435W,F814W pseudo-CMDs. Panel c: Verticalized mF814W vs. δCF336W,F435W,F814W diagram for the MS-MS binaries. The binaries in panel a are represented with magenta triangles in panels a, b, and c. The red and blue lines superimposed in panel b are the fiducials of 1P and 2Pδ stars, respectively, while the corresponding fiducial lines of equal-luminosity binaries are represented with dotted lines in panels b and c. Panels d and e: Cumulative and kernel-density δCF33eW,F435W,F814W distributions, respectively, for the observed binaries (solid magenta lines), for the simulated binaries that provide the best match with the observations (solid aqua lines), 1P binaries (solid grey lines), mixed binaries (dashed grey lines), and 2P binaries (solid black lines).
Current usage metrics show cumulative count of Article Views (full-text article views including HTML views, PDF and ePub downloads, according to the available data) and Abstracts Views on Vision4Press platform.
Data correspond to usage on the plateform after 2015. The current usage metrics is available 48-96 hours after online publication and is updated daily on week days.
Initial download of the metrics may take a while.