Fig. 6
Download original image
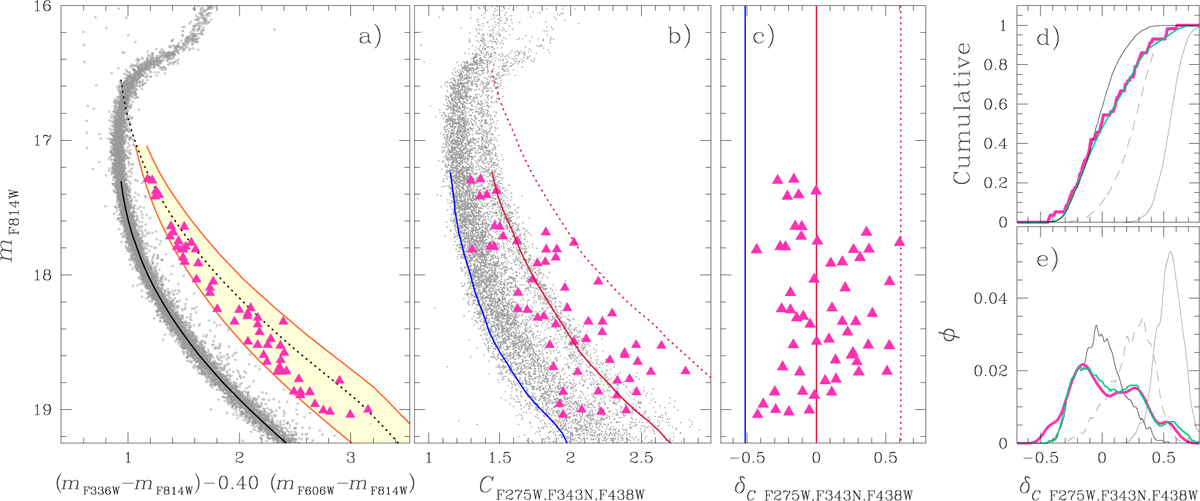
mF814W vs. (mF336W — mF814W)-0.40 (mF606W — mF814W) (panel a) and mF814W vs. CF275W,F343N,F438W (panel b) pseudo-CMDs of stars in the central field. Panel c: verticalized mF814W vs. δCF275W,F36W,F438W diagrams for the MS-MS binaries that we show in panel a and represent with magenta triangles in panels a, b, and c. The δCF275W,F336W,F435W cumulative and the kernel-density distributions of the studied binaries are illustrated with magenta lines in panels d and e, respectively, whereas the corresponding distributions for the simulated binaries that provide the best fit with the observations are coloured aqua. The gray and black lines correspond to the cumulative and the kernel-density distributions of 1P and 2P binaries alone, while the dashed gray lines represent the same distributions for mixed binaries. The solid and the dotted black lines plotted in panel a are the MS fiducial line and the fiducial of equal-luminosity binaries, and the orange lines delimit the yellow shaded area of the CMD, which hosts the studied binaries. The blue lines in panels b and c correspond to the fiducials of 2P stars, and the solid and dotted red lines are the fiducial lines of 1P stars and the fiducial lines of equal-luminosity 1P binaries, respectively.
Current usage metrics show cumulative count of Article Views (full-text article views including HTML views, PDF and ePub downloads, according to the available data) and Abstracts Views on Vision4Press platform.
Data correspond to usage on the plateform after 2015. The current usage metrics is available 48-96 hours after online publication and is updated daily on week days.
Initial download of the metrics may take a while.