| Issue |
A&A
Volume 691, November 2024
|
|
|---|---|---|
| Article Number | A251 | |
| Number of page(s) | 8 | |
| Section | Extragalactic astronomy | |
| DOI | https://doi.org/10.1051/0004-6361/202451696 | |
| Published online | 19 November 2024 | |
Extreme ionizing properties of a metal-poor, MUV ≃ −12 star complex in the first gigayear⋆
1
INAF – OAS, Osservatorio di Astrofisica e Scienza dello Spazio di Bologna, Via Gobetti 93/3, I-40129 Bologna, Italy
2
INAF – Osservatorio Astronomico di Roma, Via Frascati 33, 00078 Monteporzio Catone, Rome, Italy
3
Dipartimento di Fisica, Università degli Studi di Milano, Via Celoria 16, I-20133 Milano, Italy
4
INAF Osservatorio Astronomico di Padova, Vicolo dell’Osservatorio 5, 35122 Padova, Italy
5
Department of Physics and Astronomy, University of Missouri, Columbia, MO 65211, USA
6
NSF’s National Optical-Infrared Astronomy Research Laboratory, 950 N. Cherry Ave., Tucson, AZ 85719, USA
7
Department of Astronomy, Oskar Klein Centre, Stockholm University, AlbaNova University Centre, SE-106 91 Stockholm, Sweden
8
Department of Astronomy, University of Maryland, College Park 20742, USA
9
Dipartimento di Fisica e Scienze della Terra, Università degli Studi di Ferrara, Via Saragat 1, I-44122 Ferrara, Italy
10
INAF – IASF Milano, Via A. Corti 12, I-20133 Milano, Italy
11
University of Ljubljana, Department of Mathematics and Physics, Jadranska ulica 19, SI-1000 Ljubljana, Slovenia
12
Department of Physics and Astronomy, University of California Davis, 1 Shields Avenue, Davis, CA 95616, USA
13
Jodrell Bank Centre for Astrophysics, Alan Turing Building, University of Manchester, Oxford Road, Manchester M13 9PL, UK
14
Dipartimento di Fisica e Astronomia, Università degli Studi di Padova, Vicolo dell’Osservatorio 3, I-35122 Padova, Italy
15
Max Planck Institut für Astrophysik, Karl-Schwarzschild-Straße 1, D-85748 Garching bei München, Germany
16
NRC Herzberg, 5071 West Saanich Rd, Victoria BC V9E 2E7, Canada
17
European Southern Observatory, Alonso de Córdova 3107, Casilla 19, Santiago 19001, Chile
18
Dipartimento di Fisica “E.R. Caianiello”, Università Degli Studi di Salerno, Via Giovanni Paolo II, I-84084 Fisciano (SA), Italy
19
INAF – Osservatorio Astronomico di Capodimonte, Via Moiariello 16, I-80131 Napoli, Italy
20
Cosmic Dawn Center (DAWN), Copenhagen, Denmark
21
Niels Bohr Institute, University of Copenhagen, Jagtvej 128, 2200 Copenhagen N, Denmark
22
Centro de Astrobiología (CAB), CSIC-INTA, Ctra. de Ajalvir km 4, Torrejòn de Ardoz, E-28850 Madrid, Spain
23
Department of Astronomy/Steward Observatory, University of Arizona, 933 N. Cherry Avenue, Tucson, AZ 85721, USA
24
Space Telescope Science Institute (STScI), 3700 San Martin Drive, Baltimore, MD 21218, USA
25
Astrophysics Science Division, NASA Goddard Space Flight Center, 8800 Greenbelt Road, Greenbelt, MD 20771, USA
26
Center for Research and Exploration in Space Science and Technology II, Department of Physics, Catholic University of America, 620 Michigan Ave N.E., Washington, DC 20064, USA
27
International Centre for Radio Astronomy Research (ICRAR) and the International Space Centre (ISC), The University of Western Australia, M468, 35 Stirling Highway, Crawley, WA 6009, Australia
28
School of Earth and Space Exploration, Arizona State University, Tempe, AZ 85287-1404, USA
29
School of Earth and Space Exploration, Arizona State University, Tempe, AZ 85287-6004, USA
⋆⋆ Corresponding author; eros.vanzella@inaf.it
Received:
29
July
2024
Accepted:
23
September
2024
We report the serendipitous discovery of a faint (MUV > −12.2), low-metallicity (Z ∼ 0.02 Z⊙) ionizing source, dubbed T2c, with a spectroscopic redshift of z = 6.146. T2c is part of a larger structure amplified by the Hubble Frontier Field galaxy cluster MACSJ0416 and was observed with the James Webb Space Telescope (JWST) NIRSpec integral field unit. Stacking the short-wavelength NIRCam data reveals no stellar continuum detection down to a magnitude limit of mUV ≃ 31.0 (3σ). However, prominent Hβ, [O III]λλ4959, 5007, and Hα emissions are detected, with equivalent widths exceeding 200 Å, 800 Å, and 1300 Å (3σ), respectively. The corresponding intrinsic (magnification-corrected ×23 ± 3) ultraviolet and optical rest-frame magnitudes exceed 34.4 and 33.9 (corresponding to MUV and Mopt fainter than −12.2 and −12.8 at λrest ∼ 2000 Å and ∼5000 Å, respectively), suggesting a stellar mass lower than a few 104 M⊙ under an instantaneous burst scenario. The inferred ionizing photon production efficiency (ξion) is high: ξion ≳ 26.08(25.86) 3(5)σ, assuming no dust attenuation and no Lyman continuum leakage. This indicates the presence of massive stars despite the low mass of the object. The very poor sampling of the initial mass function in such a low-mass star-forming complex suggests that the formation of very massive stars might be favored in very low-metallicity environments. T2c is surrounded by Balmer and weak oxygen emission on a spatial scale of a few hundred parsecs, after correcting for lensing effects. This system resembles a H II region potentially powered by currently undetected, extremely efficient, low-metallicity star complexes or clusters. We propose that massive O-type stars populate these low-mass, low-metallicity, high-redshift satellites, likely observed in an early and short formation phase, and contribute to the ionization of the surrounding medium.
Key words: gravitational lensing: strong / HII regions / galaxies: high-redshift / galaxies: star clusters: general / galaxies: star formation
© The Authors 2024
 Open Access article, published by EDP Sciences, under the terms of the Creative Commons Attribution License (https://creativecommons.org/licenses/by/4.0), which permits unrestricted use, distribution, and reproduction in any medium, provided the original work is properly cited.
This article is published in open access under the Subscribe to Open model. Subscribe to A&A to support open access publication.
1. Introduction
In a scenario in which star formation is the dominant route for cosmic hydrogen reionization (z > 5), the role of stellar clusters in high-z galaxies becomes crucial (Adamo et al. 2024, see also Katz & Ricotti 2013; He et al. 2020; Renzini 2017; Mowla et al. 2024). Massive O-type stars (the stellar ionizers) are mainly forged in stellar clusters (e.g., Gvaramadze et al. 2012; Crowther et al. 2016; Stephens et al. 2017), especially in the most massive ones, which more effectively populate the high-mass tail of the stellar initial mass function (IMF; e.g., Fumagalli et al. 2011), implying a high ionizing photon production efficiency (ξion). The production rate of ionizing photons per monochromatic ultraviolet luminosity around 1500 Å is defined as ![$ \xi_{\mathrm{ion}}=\frac{Q_{\mathrm{H^o}}}{L_{\mathrm{UV}}}~[\mathrm{s}^{-1}/\mathrm{erg~s}^{-1}~\mathrm{Hz}^{-1}] $](/articles/aa/full_html/2024/11/aa51696-24/aa51696-24-eq1.gif) , where QHo[s−1]=1.36 × 10¹² LHα/(1-fesc) [erg/s] and fesc is the fraction of escaping ionizing radiation; the quantities involved can also be dust-attenuated (e.g., Emami et al. 2020). Very massive stars (VMSs) with masses greater than 100 M⊙ are now becoming a key ingredient in stellar evolution and atmosphere models when reproducing and/or predicting the ultraviolet properties and the ionizing photon production efficiency of star-forming galaxies (e.g., Schaerer et al. 2024).
, where QHo[s−1]=1.36 × 10¹² LHα/(1-fesc) [erg/s] and fesc is the fraction of escaping ionizing radiation; the quantities involved can also be dust-attenuated (e.g., Emami et al. 2020). Very massive stars (VMSs) with masses greater than 100 M⊙ are now becoming a key ingredient in stellar evolution and atmosphere models when reproducing and/or predicting the ultraviolet properties and the ionizing photon production efficiency of star-forming galaxies (e.g., Schaerer et al. 2024).
Assuming a Kroupa stellar IMF, stellar clusters less massive than a few 104 M⊙ are expected to show modest ξion values: log(ξion[Hz erg−1]) < 25 (Stanway & Eldridge 2023; see also Fumagalli et al. 2011). From this perspective, the reionization process likely starts within the natal regions of stellar clusters, where the short-lived massive stars produce the bulk of ionizing photons. Knowing the fraction of the ionizing radiation that escapes into the intergalactic medium (fesc) and the ξion, one can compute the total photon rate at which a given galaxy population ionizes the intergalactic medium (IGM; Schaerer et al. 2016; Robertson et al. 2015). The higher the ξion, the lower the fesc value that can be accommodated to sustain reionization; the ξion is modulated by the integrated contribution from an arbitrarily faint population of sources (e.g., Atek et al. 2024; Simmonds et al. 2024; Harshan et al. 2024). Though still not conclusive, the identification of faint sources at z ≳ 6 that show high log(ξion)=25.85 ± 0.05 suggests that a modest value of fesc = 5% would be enough to reionize the Universe if this ξion is assumed valid for the whole faint population (Atek et al. 2024, see also Muñoz et al. 2024).
The ξion positively correlates with the specific star formation rate (sSFR; e.g., Castellano et al. 2023), which in turn correlates with the equivalent widths (EWs) of the optical lines [O III]λλ4959, 5007 and Hα (e.g., Tang et al. 2023; Caputi et al. 2024). Recent findings based on James Webb Space Telescope (JWST) observations confirm there is a higher frequency of such strong optical emitters in galaxies in the reionization era at z > 5 − 6 compared to cosmic noon and the local Universe (Endsley et al. 2021, 2023; Matthee et al. 2023; Boyett et al. 2024). Endsley et al. (2023) also observe a slightly decreasing strength, albeit with a large scatter, of the optical emission lines on average toward low-UV luminosity galaxies.
Overall, there are (indirect) empirical pieces of evidence suggesting that star cluster formation was more vigorous in the early Universe when galaxies were denser than today (i.e., when there was more star formation per unit area, ΣSFR, Morishita et al. 2024; Ormerod et al. 2024; Matharu et al. 2024; Reddy et al. 2023a, 2023b), possibly indicating a higher gas pressure in the interstellar medium, which eventually favors the formation of star clusters (Elmegreen 2018, see also Adamo et al. 2015, 2020; Kruijssen 2012). The brightest and most massive star clusters are now promptly identified in high-redshift lensed surveys whenever the angular resolution, both instrumental and aided by lensing, is sufficiently high. Such a high spatial resolution was only achieved in the pre-JWST era by Hubble (Vanzella et al. 2017a, 2017b, 2019; Vanzella et al. 2022a; Calura et al. 2021). More recently, JWST has dramatically improved our ability to find and resolve individual star clusters (Adamo et al. 2024; Vanzella et al. 2022b, 2023a; Claeyssens et al. 2022; Adamo et al. 2023; Mowla et al. 2024).
The behavior of ξion in the low-luminosity and metallicity domains at high redshifts is still under investigation, and it remains unclear below which luminosity level it begins to dim, if at all. Identifying ultra-faint sources is also challenging at z ≳ 6 in the lensed fields, requiring relatively high magnification values (μ > 10 − 20). Once achieved, the gain at low luminosities and the enhanced spatial contrast enable the identification of stellar clusters and eventually significantly low-metallicity conditions (e.g., Vanzella et al. 2023b; Venditti et al. 2023). In this work, we report on the serendipitous discovery of a remarkably strong yet extremely faint ionizing source in a poorly explored low-luminosity domain in the reionization epoch.
Throughout this paper, we assume a flat cosmology with ΩM = 0.3, ΩΛ = 0.7, and H0 = 70 km s−1 Mpc−1. All magnitudes are given in the AB system (Oke & Gunn 1983): mAB = 23.9 − 2.5log(fν/μJy).
2. JWST observations
2.1. JWST NIRSpec/IFU
JWST/NIRSpec integral field unit (IFU) observations (PI Vanzella, cycle 1, prog. id 1908) were performed on October 16–17, 2022, and August 27 − 31, 2023, and consisted of five pointings targeting strongly lensed dwarfs and candidate globular cluster precursors at z = 6.14 (Messa et al. 2024, M24 hereafter) and a candidate population III stellar complex at redshift z = 6.63 (Vanzella et al. 2020, 2023b). In particular, four out of the five pointings covered a lensed structure of tiny star-forming regions embedded in Lyα nebulae at z = 6.14 (Vanzella et al. 2019, 2021; Calura et al. 2021) for a total integration time of ≃18 h on target. Here we present initial results from one of these four pointings, focusing on the target T2 (see Fig. 1).
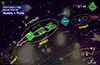 |
Fig. 1. Schematic view of the NIRSpec IFU pointings targeting lensed dwarfs and proto-globulars at z = 6.14 (transparent green boxes) and a candidate population III star complex at z = 6.63, dubbed LAP1 (Vanzella et al. 2023b) (transparent cyan box). Each square represents the IFU field of view of 3′′ × 3′′, with the white contours outlining the VLT/MUSE Lyα emission at z = 6.14 at 2, 4, 6, and 8σ (Vanzella et al. 2021). The darker green box marks the NIRSpec pointing on source T2 discussed in this work. The background color image is the release 2023-146, which combines Hubble and JWST imaging (from the PEARLS team). The dotted ellipses (Image1 and Image3) mark the two multiple images of the most magnified region, which is marked with the solid ellipse (Image2). |
Data were reduced following the same procedures described in M24. Briefly, we used the STScI pipeline (v1.14.0 and 1230.pmap, Bushouse et al. 2023) and elaborated the intermediate products of stage 2 by performing customized cleaning on the eight partial cubes and combining them into the final cleaned cube. This post-processing included background subtraction, the removal of outliers and detector defects, and the computation of the error spectrum. In addition, cross-checks on the flux calibration were performed using JWST NIRCam photometry on sources lying in the same field of view (see the next section). The detected sources (through their emission lines) in the reduced, post-processed, and collapsed data cube were aligned with their JWST/NIRCam counterparts by applying a rigid shift to the right ascension and declination.
2.2. JWST NIRCam
JWST/NIRCam observations were acquired in 2022 and 2023 as part of two guaranteed time observation programs: the CAnadian NIRISS Unbiased Cluster Survey, CANUCS (PID 1208, Willott et al. 2022), and the Prime Extragalactic Areas for Reionization and Lensing Science, PEARLS (PID 1176, Windhorst et al. 2023). The galaxy cluster MACS J0416 was observed in eight NIRCam filters during both programs, covering the spectral range 0.8 μm to 5 μm (F090W, F115W, F150W, F200W, F277W, F356W, F410M, and F444W), and combined as described in M24. Specifically, the data reduction was performed by following the prescriptions given in Yan et al. (2023), which start from the default JWST pipeline (Bushouse et al. 2023). The final integration time of the stacked images is ≃17 000 seconds per filter, corresponding to 5-σ magnitude limits for point sources of 30.1, 30.0, 30.1, and 30.3 (adopting 0.1′′ diameter aperture) in the F090W, F115W, F150W, and F200W short wavelength (SW) bands and 30.7, 30.8, 30.1, and 30.4 (0.2′′ diameter aperture) in the F277W, F356W, F410M, and F444W long wavelength (LW) bands. The SW and LW images were produced on a grid of 20(40) milliarcseconds per pixel.
3. Results
3.1. A serendipitous, extremely faint, and low-metallicity source at z=6.146
Figure 1 shows the JWST/NIRSpec IFU pointing designed to target a portion of the Lyα arc and the source dubbed T2, as part of a larger system at z = 6.14 (Vanzella et al. 2019 and M24). T2 is detected in all NIRCam bands and shows clear photometric excess due to Hβ + [O III]λλ4959, 5007 (F356W, green in the red-green-blue rendering) and Hα (F444W, red in the red-green-blue rendering). This is seen in Fig. 2, which also shows the location of an unexpected emitter that lies in the same NIRSpec/IFU field of view and comes from an object at a physical distance of ≃200 pc from T2. This object, dubbed T2c, is not detected in deep JWST/NIRCam SWs. The T2 complex will be discussed in more detail in a forthcoming work. Here we state only that T2 shows de-lensed ultraviolet and optical magnitudes mUV = 30.76 and mopt = 31.47, corresponding to MUV = −15.97 ± 0.15 and Mopt = −15.26 ± 0.13, respectively, with Hα and [O III]λ5007 EWs of 907(±70) Å and 736(±60) Å. Magnifications and errors are reported in Table 1. From the R3 index (= [O III]λ5007/Hβ) and the calibration curves of Nakajima et al. (2023), we derive a metallicity of 5% solar1, whereas from the Hα luminosity and the ultraviolet flux we have log10(ξion)=25.39 ± 0.05 (see Table 1, in which the uncertainties are also reported).
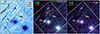 |
Fig. 2. Overview of the JWST/NIRSpec IFU pointing on T2. Left panel: Stacked JWST/NIRCam F115W + F150W + F200W image overlaid with the NIRSpec IFU footprint, the location of T2 and the nearby JWST-UV-dark T2c emitter, and the VLT/MUSE Lyα contours at 2, 4, and 6 sigma as part of the giant Lyα arc (red lines). Middle and rightmost panels: Color composite image highlights the boost produced by Hβ + [O III]λλ4959, 5007 in the green channel (middle) and the presence of Hα in the red channel (right). The thin white contours in the middle and rightmost panels outline the same black contours shown in the leftmost panel: the T2c source with its tails. |
Observed and derived properties of the T2 family.
If the source T2 – which is among the weakest currently probed at this redshift – belongs to the category of significantly low-luminosity objects (e.g., Atek et al. 2024), this would mean that T2c is extreme in terms of both its luminosity and production of ionizing photons. Two main facts emerge about T2c:
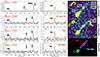 |
Fig. 3. Extracted NIRSpec spectra of T2, T2c and the surrounding regions. The left and central columns show the one-dimensional NIRSpec spectra (gray line) extracted from the masks shown in the bottom-right panel of the rightmost column and labeled T2, T2c, and T2c-tails (where T2c + T2c-tails corresponds to the “full region T2c”). The green lines indicate the 1-sigma spectra, and the red lines indicate the Gaussian fits of the emission lines. On the right, from top to bottom, are the NIRSpec [O III]λλ4959, 5007 image, the Hα NIRSpec image, and the masks used to extract the one-dimensional spectra. |
(1) T2c is not detected in the stacked SW image (F115W+F150W+F200W, probing λ ≃ 2000 Å), down to a 3σ limit magnitude of > 31.1, derived from the r.m.s. map in the (red) region shown in Fig. 3 (see also Appendix A). A similar lower limit is inferred from the optical continuum at λ ≃ 5700 Å, probed by the F410M medium-band filter (see also Table 1). At the given magnification (×23), these two limits correspond to MUV > −12.2 and Mopt > −12.8. Despite relatively large uncertainties, the inferred Hα/Hβ ratio is consistent with the value of 2.86 predicted by case B recombination theory (Osterbrock & Ferland 2006). This suggests negligible dust attenuation, as this ratio is further supported by the presence of the Lyα-emitting region in which the sources are embedded.
(2) From the NIRSpec/IFU datacube, a nucleated [O III]λλ4959, 5007 emission surrounded by emitting Hα and weak oxygen ([O III]λλ4959, 5007) is detected on T2c. We defined three regions, shown in Fig. 3 (bottom right): a peaked emission (T2c), two tails (T2c-tails), and the combination of the two (full-T2c-region). The one-dimensional spectra extracted from these regions are presented in Fig. 3. The R3 index and calibrations of Nakajima et al. (2023) place the metallicity of T2c at ∼2 − 3% solar in high ionization conditions. A similar value is inferred for T2c-tails. The spectral properties are listed in Table 1.
3.2. Imaging and limits on size
It is worth noting that T2c is detected in the NIRCam LW bands. In particular, a green spot appears on the color image shown in Fig. 2, corresponding to magnitude of 30.40 ± 0.12 in F356W; it is undetected in the blue (F227W) and red (F410M) channels. The NIRSpec flux of the emission lines Hβ + [O III]λλ4959, 5007 in the same filter suggests a magnitude of 30.54, implying that the detection of T2c in F356W is fully compatible with the measured line emission inferred from NIRSpec data. The emission appears unresolved in the observations of both instruments. Similarly, the measured Hα flux from NIRSpec corresponds to a magnitude of 30.60 in F444W, which at the given depth makes T2c barely detected in the NIRCam/F444W band (S/N ≃2).
The ultraviolet stellar continuum of T2c and the surrounding region is not detected; therefore, information about its morphology is not available. However, the unresolved [O III] emission detected by NIRCam/F356W (at S/N = 9) implies a size smaller than the point spread function (PSF) full width half maximum (< 0.15′′), which, along the tangential shear, corresponds to a radius of < 25 pc when we consider the PSF’s half width at half maximum. Under the assumption that the [O III] emission traces the stellar component, and given its compactness, it is plausible that the dominant source of the ionizing radiation is a star cluster, or a group of clusters, confined within a few tens of parsecs. Such star complexes might power a H II region, shaping what we call the T2c-tails. Additional undetected ionizing sources may also contribute to the ionization of the T2c-tails. They are possibly indirectly traced by very weak [O III] emission, also detected in the T2c-tails (at S/N ∼ 3; see Fig. 3, T2c-tails spectrum).
3.3. A very efficient ionizer
Adopting an instantaneous burst scenario, the large EW(Hα) of T2c (> 1300 Å rest frame) implies a very young age of a few megayears. The observed absolute magnitude (MUV ≳ −12.22 at 3σ) translates to a stellar mass lower than 2 × 10⁴ M⊙ (adopting Starburst99 models at the closest metallicity of the source, Leitherer et al. 2014) and assuming negligible dust attenuation. T2c is growing rapidly and has been observed in the very early phase of formation (less than a few megayears), with a Hα-based star formation rate of 0.032 M⊙ yr−1 (Kennicutt & Evans 2012), which implies a sSFR ≳ 1000 Gyr−1. Despite the low stellar mass, the ionizing photon production efficiency is remarkably high: log10(ξion)≳26.08(25.86) at 3(5)-sigma (assuming no escaped ionizing photons and negligible dust attenuation). Such a large ξion implies that massive stars are present in a still rapidly growing source, likely observed in a rare phase of evolution (Stanway & Eldridge 2023). The low metallicity of T2c supports the inferred large ξion values, although ξion increases slightly, by ∼0.1 dex, when metallicity decreases from solar to 1/100 solar (Raiter et al. 2010). It is worth noting that similar properties, though for two-magnitude brighter (and slightly more massive, 105 − 7 M⊙) galaxies, are reported by Izotov et al. (2024) for a sample of the nine most highly metal-deficient compact star-forming galaxies known at z ≃ 0.1 (effective radii of a few tens of parsecs in the ultraviolet). The Izotov sample is reported in Fig. 4 and shows a relatively large ξion: log(ξion)=25.45 − 25.81.
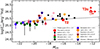 |
Fig. 4. Collection of ionizing photon production efficiency measurements as a function of the absolute ultraviolet magnitude. The sources studied in this work extend to the lowest luminosity limits and have been observed in their bursty phase. The data were retrieved from Emami et al. (2020), Castellano et al. (2023), Izotov et al. (2024), Bouwens et al. (2016), Shivaei et al. (2018), Harshan et al. (2024), Lam et al. (2019), Atek et al. (2024), Álvarez-Márquez et al. (2024), and Fujimoto et al. (2024), and the linear fit (solid line) from the work of Prieto-Lyon et al. (2023). The open and solid symbols from Harshan et al. (2024) refer to NIRCam- and NIRSpec-based measurements, respectively. T2c is indicated at the 3 (filled red circle) and 5 (red dotted circle) sigma lower limits. |
Interestingly, the high value of ξion observed in T2c suggests a dominant contribution from VMSs to both the ultraviolet ionizing and non-ionizing emission (Schaerer et al. 2024). Considering the low luminosity and stellar mass of this system, it appears that VMS formation may have been favored in this particular environment. The likelihood of a star-forming complex with the stellar mass of T2c exhibiting log(ξion)> 25.8 is exceedingly low (see Fig. 5 of Stanway & Eldridge 2023). One key factor potentially influencing the IMF and favoring the formation of VMSs is the low metallicity inferred for T2c. A lower-metallicity environment may promote a top-heavy IMF, thereby increasing the likelihood of more massive stars being formed (e.g., Klessen & Glover 2023; Prgomet et al. 2022; Maseda et al. 2020; Gennaro et al. 2018). However, the underlying mechanism responsible for the unusually high ξion in T2c remains unclear.
Another important implication of T2c’s high ionizing efficiency is the potential role of such faint star-forming pockets in the cosmic reionization process. Although direct measurements of the escape fraction of ionizing radiation from these faint sources are not available, the combination of a high ξion and the possibly significant number density of such sources suggests that they could substantially contribute to the ionizing photon budget. This is especially relevant when integrating ultraviolet luminosity functions down to faint magnitudes, as in the case of T2c (e.g., Cain et al. 2024; Bosman & Davies 2024). It is noteworthy that T2c is part of a larger system comprising multiple star-forming regions and star clusters, many of which are embedded within a Lyα nebula and likely contribute to its ionization (Messa et al. 2024). T2c, with de-lensed mUV > 34, is separated from the neighboring source T2 by 200 pc, corresponding to 35 milliarcseconds in the source plane. T2, with de-lensed mUV = 30.8, is further separated by 0.4 arcseconds (2 kpc in the source plane) from the main peak of the Lyα arc, which hosts another structured, brighter, star-forming complex, D1-T1 (with a total de-lensed mUV ≃ 28.90, Messa et al. 2024). Without the aid of gravitational lensing, such faint and clustered sources would have been missed or barely detected. This implies that typical Lyα emitters at high redshifts likely include similar faint and clustered ionizing sources, like T2 and T2c, which are often undetectable due to the limited angular resolution and depth of non-lensed fields. The analysis in this work highlights their critical contribution to local Lyα halos and, potentially, to the ionizing background if their ionizing radiation escapes into the IGM.
Notably, the lower limit on log(ξion) of close to 26 is rather challenging to reproduce for stellar evolution models except for population III stars or complexes dominated by VMSs only (see Schaerer et al. 2024, also Raiter et al. 2010). Another option that might explain such a large ξion is the pure nebular emission in the case of a spatially resolved H II region; this would mean that T2c is just fluorescing gas illuminated by ionizing radiation emitted by, for instance, nearby source T2. This scenario would be disfavored if the stellar continuum were detected in T2c. In the present case, however, the detection of the ultraviolet continuum seems to be inconclusive and at the very limit of the current depth (Appendix A). A combination of the two – fluorescence and in situ star formation – might also be possible. An additional caveat relates to possible differential magnification. If the two regions emitting ultraviolet radiation and Hα were different sizes, then ξion would be lens-model-dependent. However, the case of a stellar component intrinsically smaller than the Hα region would increase ξion, with the UV part being more magnified than the Hα region (e.g., Vanzella et al. 2020). In this work, we assumed that the magnification factor does not enter into the computation of ξion (i.e., it is the same for the stellar continuum and line emission). Finally, dust attenuation might also decrease ξion (assuming fesc = 0). For example, an AUV = 0.4 would decrease the value by 0.16 dex; however, as discussed above, we do not have a clear indication of the presence of dust attenuation on T2c. In the case of ongoing in situ star formation, the real nature of T2c in terms of underlying stellar populations remains unclear. Overall, the system shows very efficient ionizing properties.
4. Final remarks
As part of a study characterizing a wider lensed structure at z = 6.14, we discovered prominent Hα and modest oxygen emissions in a strongly lensed source, dubbed T2c, located approximately 200 parsecs from a brighter target (T2, MUV ≃ −16). A H II region of ∼200 pc size is likely powered by T2c (which is continuum-undetected) along with possible surrounding star-forming complexes, which are also currently undetected in deep JWST/NIRCam imaging probing the ultraviolet rest frame (MUV ≳ −12.22; for more details, see Table 1). In general, T2c and its local environment show extremely high ionizing photon production efficiencies, log10(ξion)≳26 at 3σ, values that approach the maximum expected at the given metallicity (e.g., Fig. 1 of Raiter et al. 2010). Our results can be summarized as follows:
(1) JWST/NIRSpec observations reveal the power of blind IFU spectroscopy, which in this case has serendipitously confirmed a super-faint (MUV ≳ −12.22), low-stellar mass, and low-metallicity star complex at z = 6.146, dubbed T2c.
(2) A significantly high ξion is associated with T2c, suggesting the presence of massive O-type stars in a remarkably low-stellar-mass object of ≲104 M⊙. In such a low-mass regime, poor sampling of the IMF at high stellar masses makes the detection of such powerful ionizers statistically rare However, numerical works (e.g., the review by Klessen & Glover 2023) find that the formation of VMSs might be favored in very low-metallicity environments. Hence, stochastic IMF sampling might not be sufficient to explain the ξion values observed in such low-mass regions, and changes in the physics of star formation might become important in such low-metallicity regimes. When comparing T2c to the most metal-poor galaxies observed in the local Universe (e.g., Izotov et al. 2024), it remains unclear whether T2c-like objects exist locally (e.g., see also Lee et al. 2009).
(3) Faint ionizing and metal-poor sources (2–3% Z⊙) emerge around brighter objects, suggesting that star formation can occur in very low-metallicity gas conditions near already chemically evolved regions. These faint clustered sources likely contribute to the ionization of the local medium, eventually sustaining extended Lyα nebulae (e.g., Mas-Ribas & Dijkstra 2016). This provides promising prospects for detecting pristine stars when gravitational lensing enhances spatial contrast. For example, the T2-T2c system is separated by approximately 35 milliarcseconds in the source plane (about the native pixel size of NIRCam, 31 milliarcseconds), making studying such sources challenging without lensing.
Finally, it is worth emphasizing that a systematic search for extremely low-luminosity and metal-poor sources like T2c at these redshifts is observationally challenging. Such efforts require blind integral field spectroscopy, starting from the surroundings of relatively bright and metal-poor systems (e.g., Venditti et al. 2023, 2024). Strong gravitational lensing significantly enhances the detection capability by increasing the depth (beyond magnitude 31) and spatial contrast (to a few tens of parsecs) through the amplification factor. This approach will enable the exploration of star-forming modes in very low-mass regimes, potentially reaching a very low metallicity at typical star cluster scales (parsecs). To mitigate the modest field of view of NIRSpec (3′′ × 3′′) while keeping a blind approach, deep NIRCam Wide Field Slitless Spectroscopy (WFSS) and/or deep NIRCam intermediate-band imaging will be crucial for isolating and probing rare star formation episodes under pristine conditions. While WFSS would require tens of hours of integration time to achieve the observed line fluxes reported here (a few 10−19 cgs; Table 1) and has limited spectral coverage, deep intermediate-band NIRCam imaging provides a more promising and effective method for characterizing the interplay between prominent and deficient line emissions (e.g., Withers et al. 2023). However, it would necessitate subsequent spectroscopic follow-up.
Acknowledgments
We thank the anonymous referee for the careful reading and constructive comments. This work is based on observations made with the NASA/ESA/CSA James Webb Space Telescope (JWST) and Hubble Space Telescope (HST). These observations are associated with JWST GO program n.1908 (PI E. Vanzella), GTO n.1208 (CANUCS, PI C. Willot) and GTO n.1176 (PEARLS, PI R. Windhorst). We acknowledge financial support through grants PRIN-MIUR 2017WSCC32 and 2020SKSTHZ. MM acknowledges support from INAF Minigrant “The Big-Data era of cluster lensing”. MC acknowledges support from the INAF Mini-grant “Reionization and Fundamental Cosmology with High-Redshift Galaxies”. EV and MM acknowledge financial support through grants PRIN-MIUR 2020SKSTHZ, the INAF GO Grant 2022 “The revolution is around the corner: JWST will probe globular cluster precursors and Population III stellar clusters at cosmic dawn,” and by the European Union – NextGenerationEU within PRIN 2022 project n.20229YBSAN – Globular clusters in cosmological simulations and lensed fields: from their birth to the present epoch. RAW acknowledges support from NASA JWST Interdisciplinary Scientist grants NAG5-12460, NNX14AN10G, and 80NSSC18K0200 from GSFC. AA acknowledges support by the Swedish research council Vetenskapsrådet (2021-05559). MB and GR acknowledge support from the Slovenian national research agency ARRS through grant N1-0238. KIC acknowledges funding from the Netherlands Research School for Astronomy (NOVA) and the Dutch Research Council (NWO) through the award of the Vici Grant VI.C.212.036. FL acknowledges support from the INAF 2023 mini-grant “Exploiting the powerful capabilities of JWST/NIRSpec to unveil the distant Universe”. MG thanks the Max Planck Society for support through the Max Planck Research Group. This research has used NASA’s Astrophysics Data System, QFitsView, and SAOImageDS9, developed by Smithsonian Astrophysical Observatory. Additionally, this work made use of the following open-source packages for Python, and we are thankful to the developers of: Matplotlib (Hunter 2007), MPDAF (Piqueras et al. 2019), Numpy (van der Walt et al. 2011).
References
- Adamo, A., Kruijssen, J. M. D., Bastian, N., Silva-Villa, E., & Ryon, J. 2015, MNRAS, 452, 246 [NASA ADS] [CrossRef] [Google Scholar]
- Adamo, A., Hollyhead, K., Messa, M., et al. 2020, MNRAS, 499, 3267 [Google Scholar]
- Adamo, A., Usher, C., Pfeffer, J., & Claeyssens, A. 2023, MNRAS, 525, L6 [NASA ADS] [CrossRef] [Google Scholar]
- Adamo, A., Bradley, L. D., Vanzella, E., et al. 2024, Nature, 632, 513 [NASA ADS] [CrossRef] [Google Scholar]
- Álvarez-Márquez, J., Colina, L., Crespo Gómez, A., et al. 2024, A&A, 686, A85 [NASA ADS] [CrossRef] [EDP Sciences] [Google Scholar]
- Asplund, M., Grevesse, N., Sauval, A. J., & Scott, P. 2009, ARA&A, 47, 481 [NASA ADS] [CrossRef] [Google Scholar]
- Atek, H., Labbé, I., Furtak, L. J., et al. 2024, Nature, 626, 975 [NASA ADS] [CrossRef] [Google Scholar]
- Bergamini, P., Grillo, C., Rosati, P., et al. 2023, A&A, 674, A79 [NASA ADS] [CrossRef] [EDP Sciences] [Google Scholar]
- Bosman, S. E. I., & Davies, F. B. 2024, A&A, 690, A391 [NASA ADS] [CrossRef] [EDP Sciences] [Google Scholar]
- Bouwens, R. J., Smit, R., Labbé, I., et al. 2016, ApJ, 831, 176 [Google Scholar]
- Boyett, K., Bunker, A. J., Curtis-Lake, E., et al. 2024, ArXiv e-prints [arXiv:2401.16934] [Google Scholar]
- Bushouse, H., Eisenhamer, J., Dencheva, N., et al. 2023, JWST Calibration Pipeline [Google Scholar]
- Cain, C., Lopez, G., D’Aloisio, A., et al. 2024, ApJ, submitted [arXiv:2409.02989] [Google Scholar]
- Calura, F., Vanzella, E., Carniani, S., et al. 2021, MNRAS, 500, 3083 [Google Scholar]
- Caputi, K. I., Rinaldi, P., Iani, E., et al. 2024, ApJ, 969, 159 [NASA ADS] [CrossRef] [Google Scholar]
- Castellano, M., Belfiori, D., Pentericci, L., et al. 2023, A&A, 675, A121 [NASA ADS] [CrossRef] [EDP Sciences] [Google Scholar]
- Claeyssens, A., Adamo, A., Richard, J., et al. 2022, MNRAS, 520, 2180 [Google Scholar]
- Crowther, P. A., Caballero-Nieves, S. M., Bostroem, K. A., et al. 2016, MNRAS, 458, 624 [Google Scholar]
- Elmegreen, B. G. 2018, ApJ, 869, 119 [NASA ADS] [CrossRef] [Google Scholar]
- Emami, N., Siana, B., Alavi, A., et al. 2020, ApJ, 895, 116 [NASA ADS] [CrossRef] [Google Scholar]
- Endsley, R., Stark, D. P., Chevallard, J., & Charlot, S. 2021, MNRAS, 500, 5229 [Google Scholar]
- Endsley, R., Stark, D. P., Whitler, L., et al. 2023, MNRAS, 524, 2312 [NASA ADS] [CrossRef] [Google Scholar]
- Fujimoto, S., Ouchi, M., Kohno, K., et al. 2024, ArXiv e-prints [arXiv:2402.18543] [Google Scholar]
- Fumagalli, M., da Silva, R. L., & Krumholz, M. R. 2011, ApJ, 741, L26 [NASA ADS] [CrossRef] [Google Scholar]
- Gennaro, M., Tchernyshyov, K., Brown, T. M., et al. 2018, ApJ, 855, 20 [NASA ADS] [CrossRef] [Google Scholar]
- Gvaramadze, V. V., Weidner, C., Kroupa, P., & Pflamm-Altenburg, J. 2012, MNRAS, 424, 3037 [NASA ADS] [CrossRef] [Google Scholar]
- Harshan, A., Bradač, M., Abraham, R., et al. 2024, MNRAS, 532, 1112 [NASA ADS] [CrossRef] [Google Scholar]
- He, C.-C., Ricotti, M., & Geen, S. 2020, MNRAS, 492, 4858 [Google Scholar]
- Hunter, J. D. 2007, Comput. Sci. Eng., 9, 90 [NASA ADS] [CrossRef] [Google Scholar]
- Izotov, Y. I., Thuan, T. X., Guseva, N. G., et al. 2024, MNRAS, 527, 281 [Google Scholar]
- Katz, H., & Ricotti, M. 2013, MNRAS, 432, 3250 [Google Scholar]
- Kennicutt, R. C., & Evans, N. J. 2012, ARA&A, 50, 531 [NASA ADS] [CrossRef] [Google Scholar]
- Klessen, R. S., & Glover, S. C. O. 2023, ARA&A, 61, 65 [NASA ADS] [CrossRef] [Google Scholar]
- Kruijssen, J. M. D. 2012, MNRAS, 426, 3008 [Google Scholar]
- Lam, D., Bouwens, R. J., Labbé, I., et al. 2019, A&A, 627, A164 [NASA ADS] [CrossRef] [EDP Sciences] [Google Scholar]
- Lee, J. C., Gil de Paz, A., Tremonti, C., et al. 2009, ApJ, 706, 599 [NASA ADS] [CrossRef] [Google Scholar]
- Leitherer, C., Ekström, S., Meynet, G., et al. 2014, ApJS, 212, 14 [Google Scholar]
- Maseda, M. V., Bacon, R., Lam, D., et al. 2020, MNRAS, 493, 5120 [Google Scholar]
- Mas-Ribas, L., & Dijkstra, M. 2016, ApJ, 822, 84 [Google Scholar]
- Matharu, J., Nelson, E. J., Brammer, G., et al. 2024, A&A, 690, A64 [NASA ADS] [CrossRef] [EDP Sciences] [Google Scholar]
- Matthee, J., Mackenzie, R., Simcoe, R. A., et al. 2023, ApJ, 950, 67 [NASA ADS] [CrossRef] [Google Scholar]
- Messa, M., Vanzella, E., Loiacono, F., et al. 2024, A&A, submitted [Google Scholar]
- Morishita, T., Stiavelli, M., Chary, R.-R., et al. 2024, ApJ, 963, 9 [NASA ADS] [CrossRef] [Google Scholar]
- Mowla, L., Iyer, K., Asada, Y., et al. 2024, ArXiv e-prints [arXiv:2402.08696] [Google Scholar]
- Muñoz, J. B., Mirocha, J., Chisholm, J., Furlanetto, S. R., & Mason, C. 2024, MNRAS, 535, L37 [CrossRef] [Google Scholar]
- Nakajima, K., Ouchi, M., Isobe, Y., et al. 2023, ApJS, 269, 33 [NASA ADS] [CrossRef] [Google Scholar]
- Oke, J. B., & Gunn, J. E. 1983, ApJ, 266, 713 [NASA ADS] [CrossRef] [Google Scholar]
- Ormerod, K., Conselice, C. J., Adams, N. J., et al. 2024, MNRAS, 527, 6110 [Google Scholar]
- Osterbrock, D. E., & Ferland, G. J. 2006, Astrophysics of Gaseous Nebulae and Active Galactic Nuclei [Google Scholar]
- Piqueras, L., Conseil, S., Shepherd, M., et al. 2019, ASP Conf. Ser., 521, 545 [Google Scholar]
- Prgomet, M., Rey, M. P., Andersson, E. P., et al. 2022, MNRAS, 513, 2326 [CrossRef] [Google Scholar]
- Prieto-Lyon, G., Strait, V., Mason, C. A., et al. 2023, A&A, 672, A186 [NASA ADS] [CrossRef] [EDP Sciences] [Google Scholar]
- Raiter, A., Schaerer, D., & Fosbury, R. A. E. 2010, A&A, 523, A64 [NASA ADS] [CrossRef] [EDP Sciences] [Google Scholar]
- Reddy, N. A., Sanders, R. L., Shapley, A. E., et al. 2023a, ApJ, 951, 56 [NASA ADS] [CrossRef] [Google Scholar]
- Reddy, N. A., Topping, M. W., Sanders, R. L., Shapley, A. E., & Brammer, G. 2023b, ApJ, 952, 167 [CrossRef] [Google Scholar]
- Renzini, A. 2017, MNRAS, 469, L63 [Google Scholar]
- Robertson, B. E., Ellis, R. S., Furlanetto, S. R., & Dunlop, J. S. 2015, ApJ, 802, L19 [Google Scholar]
- Schaerer, D., Izotov, Y. I., Verhamme, A., et al. 2016, A&A, 591, L8 [NASA ADS] [CrossRef] [EDP Sciences] [Google Scholar]
- Schaerer, D., Guibert, J., Marques-Chaves, R., & Martins, F. 2024, A&A, submitted [Google Scholar]
- Shivaei, I., Reddy, N. A., Siana, B., et al. 2018, ApJ, 855, 42 [Google Scholar]
- Simmonds, C., Tacchella, S., Hainline, K., et al. 2024, MNRAS, 527, 6139 [Google Scholar]
- Stanway, E. R., & Eldridge, J. J. 2023, MNRAS, 522, 4430 [NASA ADS] [CrossRef] [Google Scholar]
- Stephens, I. W., Gouliermis, D., Looney, L. W., et al. 2017, ApJ, 834, 94 [Google Scholar]
- Tang, M., Stark, D. P., Chen, Z., et al. 2023, MNRAS, 526, 1657 [NASA ADS] [CrossRef] [Google Scholar]
- van der Walt, S., Colbert, S. C., & Varoquaux, G. 2011, Comput. Sci. Eng., 13, 22 [Google Scholar]
- Vanzella, E., Calura, F., Meneghetti, M., et al. 2017a, MNRAS, 467, 4304 [Google Scholar]
- Vanzella, E., Castellano, M., Meneghetti, M., et al. 2017b, ApJ, 842, 47 [Google Scholar]
- Vanzella, E., Calura, F., Meneghetti, M., et al. 2019, MNRAS, 483, 3618 [Google Scholar]
- Vanzella, E., Meneghetti, M., Caminha, G. B., et al. 2020, MNRAS, 494, L81 [Google Scholar]
- Vanzella, E., Caminha, G. B., Rosati, P., et al. 2021, A&A, 646, A57 [EDP Sciences] [Google Scholar]
- Vanzella, E., Castellano, M., Bergamini, P., et al. 2022a, A&A, 659, A2 [NASA ADS] [CrossRef] [EDP Sciences] [Google Scholar]
- Vanzella, E., Castellano, M., Bergamini, P., et al. 2022b, ApJ, 940, L53 [NASA ADS] [CrossRef] [Google Scholar]
- Vanzella, E., Claeyssens, A., Welch, B., et al. 2023a, ApJ, 945, 53 [NASA ADS] [CrossRef] [Google Scholar]
- Vanzella, E., Loiacono, F., Bergamini, P., et al. 2023b, A&A, 678, A173 [NASA ADS] [CrossRef] [EDP Sciences] [Google Scholar]
- Venditti, A., Graziani, L., Schneider, R., et al. 2023, MNRAS, 522, 3809 [NASA ADS] [CrossRef] [Google Scholar]
- Venditti, A., Bromm, V., Finkelstein, S. L., et al. 2024, ApJ, 973, L12 [NASA ADS] [CrossRef] [Google Scholar]
- Willott, C. J., Doyon, R., Albert, L., et al. 2022, PASP, 134, 025002 [CrossRef] [Google Scholar]
- Windhorst, R. A., Cohen, S. H., Jansen, R. A., et al. 2023, AJ, 165, 13 [NASA ADS] [CrossRef] [Google Scholar]
- Withers, S., Muzzin, A., Ravindranath, S., et al. 2023, ApJ, 958, L14 [NASA ADS] [CrossRef] [Google Scholar]
- Yan, H., Ma, Z., Sun, B., et al. 2023, ApJS, 269, 43 [NASA ADS] [CrossRef] [Google Scholar]
Appendix A: Barely detectable T2c
Figure A.1 shows the JWST/NIRCam imaging centered on T2 and T2c. As already discussed in the main text T2c is detected in the bands enclosing emission lines, while it appears extremely faint or undetected in the other bands. In particular, after subtracting the local background, there is a formal 3.4 sigma detection at the position of T2c in the stacked F115W+F150W+F200W image, corresponding to magnitude ≃32 in a circular aperture of 0.1″ diameter. It suggests a possible ultraviolet continuum detection, which is affected by severe uncertainties. For this reason, we consider a more conservative limit derived within an aperture of 0.4″ diameter, which mimics the NIRSpec aperture used (0.3″×0.3″) to extract the line fluxes from T2c. Such an aperture provides a lower limit of ultraviolet magnitude (λ ≃ 2000Å rest frame) ≳31 at 3-sigma and is the value adopted in the main text. The F356W and F444W LW bands include the optical lines Hβ+[O III]λλ4959, 5007 and Hα, respectively, which are also observed with NIRSpec and account for the detections in the same bands (as reported in Fig. A). A possible signal is also present in F277W, which might include [O II]λ3727, 3729 or Ne III]λ3869 lines; however, such lines are not covered by NIRSpec, and it remains unclear what their contribution is.
 |
Fig. A.1. JWST/NIRCam thumbnails of the region covering T2 and T2c. The black circle shows the 0.4″ diameter aperture compatible with the aperture used on NIRSpec (red square in Fig. 3). T2c is detected in the bands enclosing rest frame optical emission lines (confirmed with NIRSpec) and appears extremely faint in the other bands (see Table 1). The sum of F356W and F444W provides the detection of T2c with the higher significance (≃10σ) as the result of line boosting by Hβ, [O III]λλ4959, 5007 and Hα. On top are reported the most prominent lines and/or rest frame continuum expected in the corresponding bands. The leftmost image has been slightly smoothed, adopting Gaussian with σ = 0.5 pixel. |
All Tables
All Figures
|
Fig. 1. Schematic view of the NIRSpec IFU pointings targeting lensed dwarfs and proto-globulars at z = 6.14 (transparent green boxes) and a candidate population III star complex at z = 6.63, dubbed LAP1 (Vanzella et al. 2023b) (transparent cyan box). Each square represents the IFU field of view of 3′′ × 3′′, with the white contours outlining the VLT/MUSE Lyα emission at z = 6.14 at 2, 4, 6, and 8σ (Vanzella et al. 2021). The darker green box marks the NIRSpec pointing on source T2 discussed in this work. The background color image is the release 2023-146, which combines Hubble and JWST imaging (from the PEARLS team). The dotted ellipses (Image1 and Image3) mark the two multiple images of the most magnified region, which is marked with the solid ellipse (Image2). |
| In the text | |
|
Fig. 2. Overview of the JWST/NIRSpec IFU pointing on T2. Left panel: Stacked JWST/NIRCam F115W + F150W + F200W image overlaid with the NIRSpec IFU footprint, the location of T2 and the nearby JWST-UV-dark T2c emitter, and the VLT/MUSE Lyα contours at 2, 4, and 6 sigma as part of the giant Lyα arc (red lines). Middle and rightmost panels: Color composite image highlights the boost produced by Hβ + [O III]λλ4959, 5007 in the green channel (middle) and the presence of Hα in the red channel (right). The thin white contours in the middle and rightmost panels outline the same black contours shown in the leftmost panel: the T2c source with its tails. |
| In the text | |
|
Fig. 3. Extracted NIRSpec spectra of T2, T2c and the surrounding regions. The left and central columns show the one-dimensional NIRSpec spectra (gray line) extracted from the masks shown in the bottom-right panel of the rightmost column and labeled T2, T2c, and T2c-tails (where T2c + T2c-tails corresponds to the “full region T2c”). The green lines indicate the 1-sigma spectra, and the red lines indicate the Gaussian fits of the emission lines. On the right, from top to bottom, are the NIRSpec [O III]λλ4959, 5007 image, the Hα NIRSpec image, and the masks used to extract the one-dimensional spectra. |
| In the text | |
|
Fig. 4. Collection of ionizing photon production efficiency measurements as a function of the absolute ultraviolet magnitude. The sources studied in this work extend to the lowest luminosity limits and have been observed in their bursty phase. The data were retrieved from Emami et al. (2020), Castellano et al. (2023), Izotov et al. (2024), Bouwens et al. (2016), Shivaei et al. (2018), Harshan et al. (2024), Lam et al. (2019), Atek et al. (2024), Álvarez-Márquez et al. (2024), and Fujimoto et al. (2024), and the linear fit (solid line) from the work of Prieto-Lyon et al. (2023). The open and solid symbols from Harshan et al. (2024) refer to NIRCam- and NIRSpec-based measurements, respectively. T2c is indicated at the 3 (filled red circle) and 5 (red dotted circle) sigma lower limits. |
| In the text | |
|
Fig. A.1. JWST/NIRCam thumbnails of the region covering T2 and T2c. The black circle shows the 0.4″ diameter aperture compatible with the aperture used on NIRSpec (red square in Fig. 3). T2c is detected in the bands enclosing rest frame optical emission lines (confirmed with NIRSpec) and appears extremely faint in the other bands (see Table 1). The sum of F356W and F444W provides the detection of T2c with the higher significance (≃10σ) as the result of line boosting by Hβ, [O III]λλ4959, 5007 and Hα. On top are reported the most prominent lines and/or rest frame continuum expected in the corresponding bands. The leftmost image has been slightly smoothed, adopting Gaussian with σ = 0.5 pixel. |
| In the text | |
Current usage metrics show cumulative count of Article Views (full-text article views including HTML views, PDF and ePub downloads, according to the available data) and Abstracts Views on Vision4Press platform.
Data correspond to usage on the plateform after 2015. The current usage metrics is available 48-96 hours after online publication and is updated daily on week days.
Initial download of the metrics may take a while.