Fig. 2.
Download original image
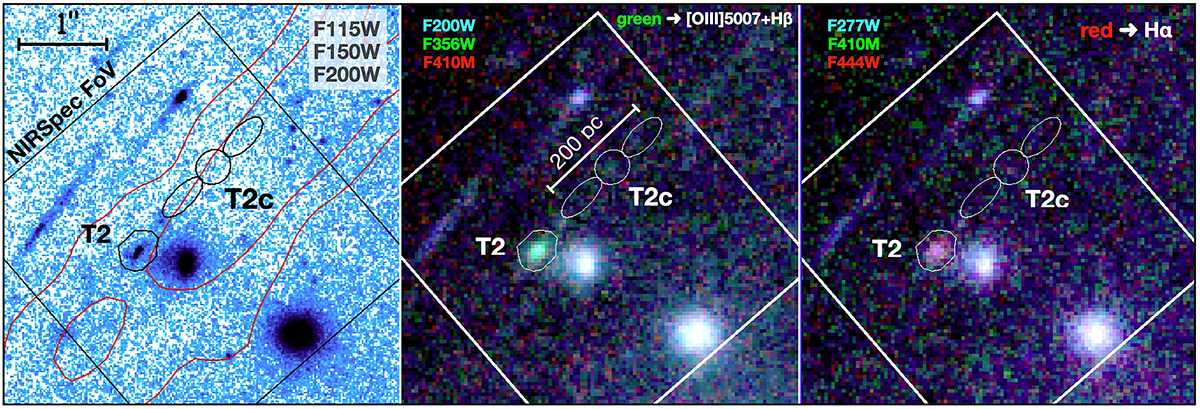
Overview of the JWST/NIRSpec IFU pointing on T2. Left panel: Stacked JWST/NIRCam F115W + F150W + F200W image overlaid with the NIRSpec IFU footprint, the location of T2 and the nearby JWST-UV-dark T2c emitter, and the VLT/MUSE Lyα contours at 2, 4, and 6 sigma as part of the giant Lyα arc (red lines). Middle and rightmost panels: Color composite image highlights the boost produced by Hβ + [O III]λλ4959, 5007 in the green channel (middle) and the presence of Hα in the red channel (right). The thin white contours in the middle and rightmost panels outline the same black contours shown in the leftmost panel: the T2c source with its tails.
Current usage metrics show cumulative count of Article Views (full-text article views including HTML views, PDF and ePub downloads, according to the available data) and Abstracts Views on Vision4Press platform.
Data correspond to usage on the plateform after 2015. The current usage metrics is available 48-96 hours after online publication and is updated daily on week days.
Initial download of the metrics may take a while.