Fig. 3.
Download original image
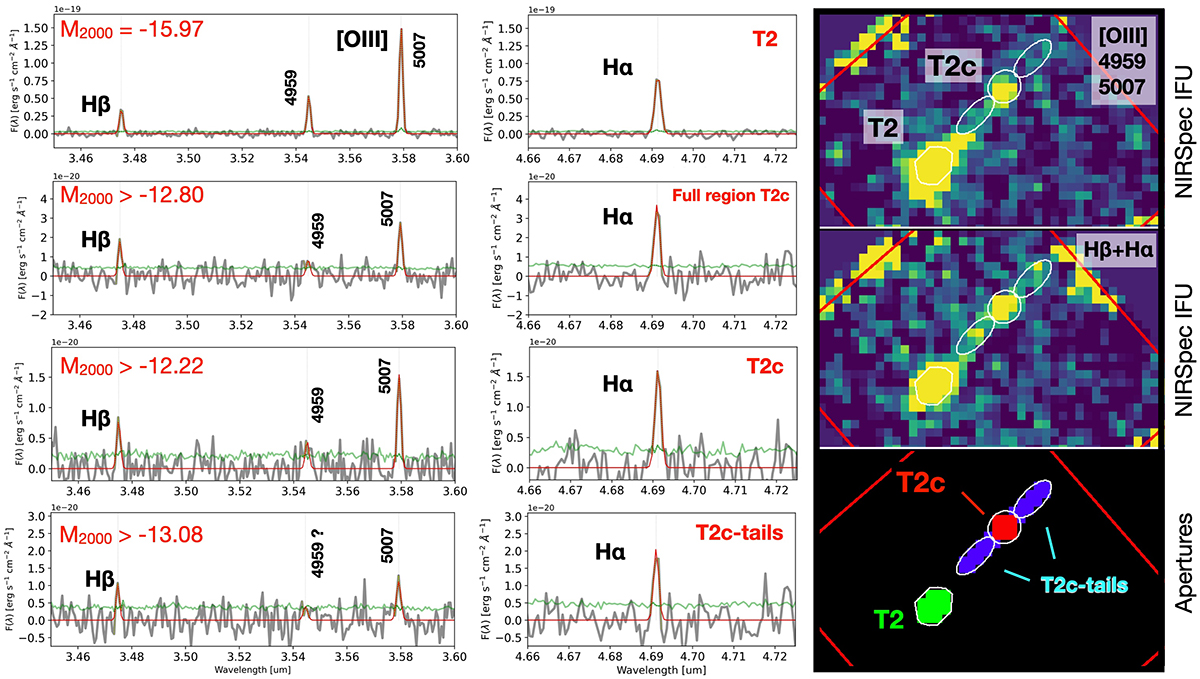
Extracted NIRSpec spectra of T2, T2c and the surrounding regions. The left and central columns show the one-dimensional NIRSpec spectra (gray line) extracted from the masks shown in the bottom-right panel of the rightmost column and labeled T2, T2c, and T2c-tails (where T2c + T2c-tails corresponds to the “full region T2c”). The green lines indicate the 1-sigma spectra, and the red lines indicate the Gaussian fits of the emission lines. On the right, from top to bottom, are the NIRSpec [O III]λλ4959, 5007 image, the Hα NIRSpec image, and the masks used to extract the one-dimensional spectra.
Current usage metrics show cumulative count of Article Views (full-text article views including HTML views, PDF and ePub downloads, according to the available data) and Abstracts Views on Vision4Press platform.
Data correspond to usage on the plateform after 2015. The current usage metrics is available 48-96 hours after online publication and is updated daily on week days.
Initial download of the metrics may take a while.