| Issue |
A&A
Volume 691, November 2024
|
|
|---|---|---|
| Article Number | A32 | |
| Number of page(s) | 15 | |
| Section | Planets and planetary systems | |
| DOI | https://doi.org/10.1051/0004-6361/202451633 | |
| Published online | 25 October 2024 | |
How external photoevaporation changes the chemical composition of the inner disc
1
Makerere University,
PO Box 7062
Kampala,
Uganda
2
HailNumbers Education Foundation,
PO Box 151972,
Kampala,
Uganda
3
University College Cork,
College Rd,
Cork
T12 K8AF,
Ireland
4
Max Planck Institute for Astronomy (MPIA),
Königstuhl 17,
69117
Heidelberg,
Germany
★ Corresponding author; This email address is being protected from spambots. You need JavaScript enabled to view it.
Received:
23
July
2024
Accepted:
11
September
2024
Abstract
Stars mostly form in cluster environments, where neighbouring stars can have an influence on the evolution of the newly formed protoplanetary discs. Besides gravitational interactions, external photoevaporation can also shape protoplanetary discs. Depending on the strength of external photo-evaporation, discs may be destroyed within 1–2 Myrs, or more gradually, depending on whether the external photo-evaporation field is stronger or weaker, respectively. We used the chemcomp code, which includes a viscous disc evolution model including pebble drift and evaporation to calculate the chemical composition of protoplanetary discs. We extended this code to include external photoevaporation following the FRIED grid. Before external photoevaporation becomes efficient, the disc follows a purely viscous disc evolution, where the C/O ratio in the inner disc initially decreases due to inwardly drifting and evaporating water ice pebbles. Over time, the C/O ratio increases again as water vapour is accreted onto the star and carbon-rich gas gradually migrates inwards. However, once external photo-evaporation commences, the outer disc begins to get dispersed. During this process, the inner disc’s chemical evolution still follows the evolution of a purely viscous disc because the majority of the pebbles have already drifted inwards on timescales shorter than 1 Myr. At low viscosity, the inner disc’s C/O ratio remains sub-solar until the disc is dispersed through external photoevaporation. At a high viscosity, the inner disc’s composition can reach super-solar values in C/O, because the water vapour is accreted onto the star faster and carbon rich gas from the outer disc can move inwards faster as well, as long as the disc can survive a few Myrs. In both cases, there is no visible difference in terms of the chemical composition of the inner disc compared to a purely viscous model, due to the rapid inward drift of pebbles that sets the chemical composition of the disc. Thus, our model predicts that the inner disc chemistry would be similar between discs that are subject to external photoevaporation and discs that are isolated and experience no external photo-evaporation. This finding is in line with observations of protoplanetary discs with JWST.
Key words: protoplanetary disks
© The Authors 2024
 Open Access article, published by EDP Sciences, under the terms of the Creative Commons Attribution License (https://creativecommons.org/licenses/by/4.0), which permits unrestricted use, distribution, and reproduction in any medium, provided the original work is properly cited.
This article is published in open access under the Subscribe to Open model. This email address is being protected from spambots. You need JavaScript enabled to view it. to support open access publication.
1 Introduction
Planets form in protoplanetary discs, where planetary formation crucially depends on the different disc parameters such as temperature, density, and viscosity (e.g. Safronov 1972; Chiang & Goldreich 1997; Savvidou & Bitsch 2023). It is therefore essential to understand the evolution and structure of discs in the first place. Protoplanetary discs are composed primarily of hydrogen and helium, with a small fraction of dust grains that can grow into mm-cm sized pebbles (e.g. Weidenschilling & Cuzzi 1993; Blum & Wurm 2008), which are the first building blocks of planetesimals and planets (Johansen et al. 2014).
These small mm-cm sized pebbles then start to drift inwards due to gas-drag effects (e.g. Weidenschilling 1977; Brauer et al. 2008). As the pebbles move towards the inner disc regions, the disc environment heats up and these pebbles can eventually evaporate and release their volatiles into the gas phase of the disc (e.g. Ros & Johansen 2013; Piso et al. 2015; Booth et al. 2017; Schneider & Bitsch 2021b; Estrada & Cuzzi 2022; Kalyaan et al. 2023).
The released volatile vapour is then accreted onto the central star on a viscous timescale. Due to the velocity difference between the inwardly drifting pebbles and the gas (e.g. Brauer et al. 2008), a large enhancement of volatile vapour interior to evaporation fronts can be created (e.g. Schneider & Bitsch 2021b; Mah et al. 2023; Kalyaan et al. 2023). This volatile enhancement of the inner disc has important consequences for the composition of growing planets (e.g. Schneider & Bitsch 2021a; Bitsch et al. 2022). Additionally, this process also indicates that the disc’s chemical composition is not static over time (e.g. Mollière et al. 2022).
The inward drift of pebbles that enriches the inner discs with volatiles can be influenced by pressure perturbations in the outer disc (e.g. Bitsch et al. 2021; Kalyaan et al. 2021; Lienert et al. 2024; Mah et al. 2024), which stop the inward flux of pebbles. Theoretical predictions indicate that inner discs with bumps and gaps should be relatively volatile poor (especially in respect to water), while smooth discs should be water rich in the inner regions. Observationally, this trend seems to hold (e.g. Banzatti et al. 2023; Gasman et al. 2023; Perotti et al. 2023), indicating that the disc structure is of the utmost importance in setting the inner disc chemistry.
Pressure perturbations in the outer disc can be caused by growing planets (e.g. Paardekooper & Mellema 2006; Pinilla et al. 2012; Lambrechts et al. 2014; Bitsch et al. 2018; Ataiee et al. 2018), ice line effects (e.g. Pinilla et al. 2017; Müller et al. 2021), or also by photo-evaporation (e.g. Ercolano et al. 2008; Owen et al. 2012; Picogna et al. 2019; Lienert et al. 2024). Photoevaporation is a process where high-energy radiation from either the central star or external sources accelerates the particles of the disc and removes them from their bound orbits to allow for them to escape into space (see Pascucci et al. (2022) for a review). This process is fundamentally different compared to gap opening by giant planets, where part of the gas can still pass its orbit (e.g. D’Angelo & Lubow 2008; Bergez-Casalou et al. 2020), resulting in carbon-rich material that can eventually make it to the inner disc, in contrast to gaps opened by photo-evaporation, where outer material can not make it to the inner disc any longer, resulting in low C/O ratios (Lienert et al. 2024).
Stars are not born in isolation, but rather in star-forming regions (e.g. Lada & Lada 2003; Fatuzzo & Adams 2008; Winter et al. 2020; Ginski et al. 2024). Consequently, their discs are subject to several factors that can complicate their evolution, such as background heating (Ndugu et al. 2018), stellar encounters (Ndugu et al. 2022), and external photo-evaporation (Haworth & Clarke 2019; Pascucci et al. 2022; Winter et al. 2020). External photo-evaporation is caused by surrounding massive stars that emit ultraviolet (UV) radiation (e.g. Henney & Arthur 1998; Henney & O’Dell 1999).
In the past, we have studied how internal photo-evaporation (Ercolano et al. 2008; Picogna et al. 2019; Sellek et al. 2020) influences the disc’s composition (Lienert et al. 2024). Here, we want to expand on this approach by studying the effects of external photo-evaporation on the structure, evolution, and composition of protoplanetary discs. External photo-evaporation mainly affects the outer disc regions (Sellek et al. 2020) by slowly eating away at them. However, the outer disc regions harbour the pebble reservoir of the disc, and its evaporation might hinder the efficient inward drift of pebbles and might thus prevent the formation of planets (e.g. Haworth et al. 2023; Qiao et al. 2023), that is, if photo-evaporation acts fast enough. In order to model external evaporation, we make use of the FRIED grid (Haworth et al. 2023), which gives simple recipes to include external photo-evaporation into viscous disc evolution models without the need to run detailed simulations.
To achieve our objectives, we employ the chemcomp tool, a one-dimensional, semi-analytical model that simulates the evolution of protoplanetary discs and the initial stages of planet formation (Schneider & Bitsch 2021a). This tool integrates the effects of viscous evolution, pebble drift, and evaporation, allowing us to study the chemical composition of the disc. By examining the variations in the gas surface densities, the ratios of key elements such as carbon, oxygen, and nitrogen over time, we aim to understand the potential impact of external photo-evaporation on the disc’s composition and consequently on planet formation and the implications for their eventual composition.
Our study is organized as follows. Section 2 outlines the methods used, including the chemcomp model and the parameters employed in our simulations. Furthermore, we show how we can include external photo-evaporation. Section 3 presents our results, highlighting the effects of external photo-evaporation on the disc’s structure and chemical composition. In Sect. 4, we compare our results to previous studies of photo-evaporation and to disc observations, setting the stage for future research perspectives. We also discuss the broader implications of our findings for the process of planet formation and the characteristics of the resulting planetary systems, followed by a summary of our findings in Sect. 5.
2 Methods
To study the effects of external photo-evaporation on the chemical composition of inner discs, we extended the chemcomp code (Schneider & Bitsch 2021a). This is a one-dimensional semi-analytical model that simulates the viscous evolution of protoplanetary discs and how planets can form in them. In particular, the viscous evolution is modelled using the α-viscosity (Lynden-Bell & Pringle 1974; Shakura & Sunyaev 1973) approach. Furthermore, the code models the growth and inward drift of particles using the method of Birnstiel et al. (2012), while simultaneously tracking the composition of the growing grains and how their evaporation at evaporation fronts changes the volatile composition of the gas and solids (Schneider & Bitsch 2021a). The initial chemical abundances are listed in Appendix A and are the same as in our previous works (Schneider & Bitsch 2021a; Schneider & Bitsch 2021b; Bitsch et al. 2022). We do not include changes of the chemical compositions due to chemical reactions, as the chemical reaction timescale is normally longer than the pebble drift timescale (e.g. Booth & Ilee 2019). chemcomp also includes a planet formation model, which we do not use in this work, as we are focussed on the disc’s evolution. The base version of the code (without the herein discussed additions of external photo-evaporation) is publicly available (Schneider & Bitsch 2023). In the following, we recap the important ingredients to our model and more details can be found in Schneider & Bitsch (2021a).
2.1 Viscous evolution
The viscosity is given by
 (1)
(1)
where α is a dimensionless factor describing the strength of the turbulence, cs is the isothermal sound speed, and  is the Keplerian angular frequency. Here, r is the orbital distance, G the gravitational constant, and M★ the stellar mass, which we set to be the solar mass throughout this work. The speed of sound can be linked to the mid-plane temperature of the disc. The temperature is calculated from an equilibrium between viscous and stellar heating with radiative cooling. In our model, it does not evolve in time for simplicity and, thus, it is calculated only at the initialization of the simulation. As viscous heating scales with the disc’s surface density, discs with a higher surface density have higher temperature, resulting in evaporation fronts that are located further away from the star within the inner region where viscous heating dominates.
The time evolution of the gas surface density in our disc is given by the viscous disc equation, which can be derived from the conservation of mass and angular momentum (Pringle 1981; Armitage 2013):
![Mathematical equation: ${{\partial {\Sigma _{{\rm{gas}},{\rm{Y}}}}} \over {\partial t}} - {3 \over r}{\partial \over {\partial r}}\left[ {\sqrt r {\partial \over {\partial r}}\left( {\sqrt r v{\Sigma _{{\rm{gas}},{\rm{Y}}}}} \right)} \right] = {\dot \Sigma _{\rm{Y}}} - {\dot \Sigma _{{\rm{ext}}}},$](/articles/aa/full_html/2024/11/aa51633-24/aa51633-24-eq3.png) (2)
(2)
where ∑gas,Y is the gas surface density of the molecular species Y and  is the source term of the molecular species Y, as given in Table A.1. It originates from the evaporation and condensation of pebbles and is given by
 (3)
(3)
Here,  and
and  are the evaporation and condensation source terms of species Y, originating from the evaporation and condensation of volatiles of species Y at the respective ice line, rice, Y. The term
  on the right hand side of the Eq. (3) describes the mass loss through external photo-evaporation, discussed below.
In Fig. 1, we show the evolution of gas surface density and its corresponding carbon to oxygen ratio in a viscous disc without external photo-evaporation. The parameters used for this simulations are shown in Table 1. The low viscosity results in a very slow evolution of the disc’s surface density. In Appendix A.2, we show the detailed C/H, O/H, and N/H evolution of this disc.
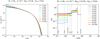 |
Fig. 1 Nominal gas surface density (left panel) and the nominal carbon to oxygen fraction (right panel) as a function of disc radius for a viscous disc evolution, as given in Eq. (2). The simulations here represent the parameters outlined in Table 1, matching our standard simulations. The time evolution is shown in colour, from black, which corresponds to 0 Myr, to dark red, which corresponds to 10 Myr. |
Parameters used in this study.
2.2 Disc lifetime and external photo-evaporation
When a viscous disc is subject to external photo-evaporation, an additional term,  , describing the photo-evaporative gas surface density loss rate, is subtracted from the right-hand-side of the disc’s viscous equation (Eq. (2)). In this study, we focus on external photo-evaporation (Haworth et al. 2023) and explore how this affects the chemical composition of inner discs in order to be complementary to our previous study, which focused on the effects of internal photo-evaporation by X-rays on the disc’s chemical composition (Lienert et al. 2024). Our aim is to understand how the different evaporation mechanisms influence the composition of inner discs.
To simulate external photo-evaporation, we made use of the publicly available FRIED grid (Haworth et al. 2023). The FRIED grid originates from extensive simulations investigating how external photo-evaporation affects the mass loss rates of discs. The grid spans a wider range of model parameters, including disc size (1–500 AU), disc mass, strength of the ambient UV field (10–104G0), and stellar masses (0.05–1.9 M⊙). We use linear interpolation to calculate the mass loss rates for our specific disc properties. Within the range of the disc properties analysed, the estimated mass loss rates span from 10−8 to 10−5 solar masses per Myr.
As the disc is dispersed away from the outer regions, one needs to define the outer edge of the disc. This is given by the transition from the optically thick to the optically thin medium, corresponding to the location of the maximum mass loss rate given by the FRIED grid (Sellek et al. 2020). We assumed a uniform mass loss rate of the outer 10% of the disc’s radius, in line with Haworth & Clarke (2019). The external photo-evaporation rate is then given by
 (4)
(4)
where βext = 0.9, Redge is the outer edge of the gas disc, and Ṁext is the mass loss rate given by the FRIED grid. A smoothing term of βextRedge was applied to avoid numerical difficulties. Throughout this paper, we employ a UV field strength of 104G0, aiming at exploring the effects of an extremely effective photo-evaporation field on various disc parameters and their interplay. If the UV field strength is very low, we expect no changes in the disc’s evolution (Qiao et al. 2023), as we also show in Sect. 3.2.
2.3 Pebble drift and evaporation
Protoplanetary discs are composed of gas and dust grains. Initially, we assume that the dust grains in the disc are of micrometer size, similar as in the ISM. These particles can then grow to mm-cm sized pebbles due to coagulation (e.g. Brauer et al. 2008) or condensation (e.g. Ros & Johansen 2013; Schneider & Bitsch 2021b; Mousis et al. 2022; Estrada & Cuzzi 2022) at evaporation fronts. The maximal grain size is restrained by drift and fragmentation of colliding grains. The outcome of grain collisions depends on the collision properties (e.g. Güttler et al. 2010), where the outcome is primarily determined by the velocities at which grains collide. In simulations, a so-called fragmentation velocity is typically set to give the maximal velocities that grains can collide with to still grow, especially as higher velocities would result in fragmentation. Overall, these fragmentation velocities are between 1 and 10 ms−1 (e.g. Gundlach & Blum 2014; Musiolik & Wurm 2019). Here, we use a constant fragmentation velocity of 5 ms−1.
The radial motion of the dust grains within the disc is characterized by the radial dust velocity, uZ, as described by the following equation:
 (5)
(5)
where St denotes the Stokes number of a particle (which is proportional to the particle’s size), and ugas and ∆υ represent the gas velocity and its azimuthal speed difference, respectively. The latter is defined as:
 (6)
(6)
where υK = ΩKr is the Keplerian velocity, P is the gas pressure, and Hgas is the gas scale height.
Here, we adopt the simple two-population approach (Birnstiel et al. 2012), which divides the dust population into two size regimes, related to small and large grains. The dust is then advected with the average velocity of the two size regimes combined. Consequently, pressure perturbations that can stop the inward flux of particles will be perfect pebble traps in this model, whereas in reality, smaller dust grains can diffuse through the pressure bumps (e.g. Weber et al. 2018; Drążkowska et al. 2019; Stammler et al. 2023), depending on the pebble size and disc turbulence levels (e.g. Ataiee et al. 2018; Bitsch et al. 2018); we note that this implementation requires more detailed models. However, here we study the cases of smooth discs without pressure perturbations, justifying the simple approach.
Consequently, as the pebbles start growing, they decouple from the gas and begin to drift inwards with velocities much larger than the gas velocity (e.g. Weidenschilling 1977; Brauer et al. 2008), resulting in the decay of the pebble flux within 1–2 Myr (see Appendix A.3). As the pebbles drift inwards, they move towards hotter disc regions, where they can eventually evaporate, as we discuss below.
2.4 Chemical composition
We followed the assumption that the initial composition of the disc mirrors the composition of the host star, where we use solar compositions as starting values (see Appendix A). Towards the inner disc regions, the temperature increase allows for the evaporation of first volatiles (e.g. H2O, CO2, NH3, CH4, CO), followed by the more refractory components.
In our approach, we assume that molecules of a species Y and of a given composition can exist either as solids (or ices) or in gaseous form, depending on their evaporation or condensation temperature. The mid-plane temperature that equals the molecules’ evaporation temperature marks the evaporation line for that species (see Table A.1). The evaporation of inwardly drifting pebbles is supposed to happen within 0.001 AU inwards of the evaporation front, while the re-condensation of outwards diffusing vapour depends on the efficiency that vapour sticking on already existing grains (see Schneider & Bitsch (2021a) for more details). This effect can cause spikes in the pebble surface density distribution at ice lines, which depend also on the disc’s viscosity (e.g. Schneider & Bitsch 2021b; Estrada et al. 2022) and determines the outward transport of vapour.
As the pebbles drift inwards and evaporate, they can enrich the inner disc with volatile vapour due to the velocity differences between fast inwardly moving pebbles and the slow gas transport. This effect can lead to large enrichment to super-solar values of volatiles in the inner disc region (e.g. Schneider & Bitsch 2021b; Bitsch & Mah 2023; Kalyaan et al. 2023; Mah et al. 2023). Generally, low-viscosity discs are enriched to larger values (e.g. Mah et al. 2023; Bitsch & Mah 2023) due to the larger pebbles that allow for a faster inwards motion and the slower gas transport, determined by the disc’s viscosity.
We then calculate the elemental ration between two species X1 and X2 as follows,
 (7)
(7)
where  and
and  are the mass fractions and
  and
and  are the atomic masses of the respective elements. This approach is used to calculate the C/O ratio and is the same as in our previous works.
2.5 Initial parameters
The stellar parameters in our simulations are fixed to solar mass and solar luminosity, for simplicity. As we have aimed to study the importance of the disc parameters on external photo-evaporation, we chose to vary them. In particular, we used α parameters with values of 10−4, 3 × 10⁻⁴, 10−3, and disc masses of either 0.01 or 0.1 solar masses, with radii of either 75 or 150 AU. In addition, we test three different starting times for external photo-evaporation (0, 1, and 3 Myr after initialisation). For all simulations, we use a dust-to-gas ratio of 2%. Our simulation set-up thus follows the set-up of Lienert et al. (2024), allowing for an easy comparison to the simulations with internal X-ray driven photo-evaporation.
For the initialization of our simulations, we used the analytical solution (without the photo-evaporation source term) found by Lynden-Bell & Pringle (1974) with an exponential decay at large distances. This is the same starting condition as in our previous works.
3 Results
3.1 Chemical evolution
The initial C/O ratio of the disc is set by our initial partitioning model, which describes how the volatiles are distributed in the disc (see Appendix A). The C/O ratio changes at the different evaporation fronts and initial resembles the distribution as in Öberg et al. (2011) with a few extra chemical species. As time goes on, pebbles drift inwards and evaporate, changing the disc’s C/O ratio (Fig. 1). Initially, the C/O ratio in the inner disc drops and becomes highly sub-stellar, due to the evaporation of water ice particles. It is only after 6-7 Myr (due to the low viscosity) that the C/O ratio becomes super-stellar again, due to the removal of oxygen rich material by accretion onto the star, as well as by the inward flux of carbon rich materials on the longer viscous timescales (Mah et al. 2023; Mah et al. 2024). External photo-evaporation will cut this process short. In the following discussion, the focus is on the details of the inner disc regions interior to the water ice evaporation front.
As in the pure viscous case, the C/O ratio initially in the disc drops due to the evaporation of inwardly drifting water ice (Fig. 2). Over time (as for the purely viscous case), the C/O ratio increases slowly, but it never reaches super-solar values; this is because the disc is dispersed by photo-evaporation after ~1.5 Myr, or even earlier for low viscosities, preventing a significant change of the disc’s C/O ratio before disc dissipation. For higher viscosities (α = 10−3), the C/O ratio reaches roughly stellar values before the disc is dispersed. This is caused by the faster inward transportation of water vapour onto the star as well as by the inward transport of carbon rich gas (see Mah et al. 2023; Mah et al. 2024) by the larger viscosity.
If external photo-evaporation becomes more efficient at later times (e.g. 1 or 3 Myr; see Figs. 3 and 4), the disc’s C/O ratio can evolve longer as in the purely viscous case, giving rise to larger C/O ratios in the inner disc. As long as the external photo-evaporation is not active, the disc’s evolution follows the purely viscous case (see Fig. 1). Generally speaking, a later start of external photo-evaporation results in a C/O ratio evolution more similar to the purely viscous case. It is only once external photo-evaporation acts, the C/O ratio deviates from the purely viscous case. This implies for a relatively late starting time of external photo-evaporation of 3 Myr that the inner disc regions can already become super-solar in C/O for high viscosity. However, this remains unachievable for the low viscosity discs, because of the longer evolution time.
Figure 5 shows the variation in the ratios of carbon to hydrogen (C/H), oxygen to hydrogen (O/H), and nitrogen to hydrogen (N/H) over time in a protoplanetary disc that experiences external photo-evaporation after 1 Myr of its evolutionary timescale. The disc has a mass (Mdisc) of 0.1 solar masses, a radius (Rdisc) of 75 AU, and a viscosity parameter (α) of 10−4. We show in Fig. A.4 the chemical evolution of a purely viscous discs for comparison.
The left panel of Fig. 5 shows the changes in the C/H ratio over the disc life time. The C/H ratio in the disc increases at the various evaporation fronts that contain carbon-bearing species. This is indicated by the sharp spikes in the distributions just interior to the evaporation fronts. The height of the spikes is determined by the overall abundances of the corresponding volatile ice. With time, the gas then slowly moves inwards, increasing the C/H ratio interior to the evaporation fronts. The inner disc’s C/H ratio is then determined by the evaporation of inwardly drifting and evaporating CO2 ice particles, reaching super-stellar levels before disc dissipation.
The middle panel of Fig. 5 depicts the O/H ratio. Again a change in the disc’s O/H ratio is determined by the evaporation of oxygen rich volatiles. As water ice is the most abundant oxygen carrying volatile, the jump in the disc’s O/H ratio is largest at the water evaporation front. In fact the O/H ratio increases to about a factor of 20–30 interior to the water ice line. In combination with the C/H ratio that increased to around two times the stellar value, the disc’s C/O ratio decreased to about  of its original value (see Fig. 1). Due to the low viscosity, the disc remains oxygen rich in the inner regions until the end of the disc’s lifetime.
The right panel of Fig. 5 shows the N/H ratio evolution as function of time. Here, only N2 and NH3 carry nitrogen, resulting in only two evaporation fronts, where the N/H ratio increases. Interior the NH3 evaporation front, the nitrogen content can increase to a few times the stellar value, in line with the composition of Jupiter (see Schneider & Bitsch 2021b). Again, the inner disc remains enriched in nitrogen until the end of the disc’s lifetime.
It is very clear that the chemical evolution of the disc first proceeds as in the nominal purely viscous case with rapid inwardly drifting pebbles that evaporate at ice lines and then enrich the disc with vapour. After the external photo-evaporation starts to act, the disc’s outer radius is cut in relatively short times, preventing any further inwardly drift of pebbles and vapour.
Consequently, the inner disc’s composition remains relatively unchanged until the disc dissipates completely. This explains the similar inner disc composition observed in both isolated and externally photoevaporated discs (see Figs. 5 and A.4) for comparison).
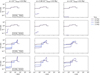 |
Fig. 2 Carbon to oxygen ratio of the protoplanetary discs as a function of time, corresponding to the disc profile shown in Fig. A.1, with an onset of external photo-evaporation at t = 0. |
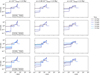 |
Fig. 3 Carbon to oxygen ratio of the protoplanetary discs as a function of time and radius, corresponding to the disc profiles shown in Fig. A.2, with an onset of external photo-evaporation at t = 1 Myr. |
3.2 Change in the photoevaporative strength
We show in Fig. 6 the evolution of discs subject to external photo-evaporation starting at 1 Myr. These scenarios involve a lower external field strength of 103G0, 102G0, and 10G0, which are factors of 10, 100 and 1000, respectively lower than those discussed in Sect. 3.1. The disc’s viscosity is α = 10−4, while the disc radius is 75 AU and the disc’s mass is 0.1 solar masses, corresponding to our nominal disc case. The figures give the gas surface density evolution (top) and the evolution of the C/O ratio (bottom).
Due to the lower strength of external photo-evaporation, the overall evolution is slower compared to the nominal cases with higher external photo-evaporation rate. The lower external photo-evaporation rates essentially prolong the disc’s lifetime by about 1 Myr (Fig. 6–left plot), and beyond 7.5 Myr (Fig. 6–center and right plots), compared to the nominal case. This leads to complete disc dissipation after 3.5 Myrs (Fig. 6, left plot) or a disc survival beyond 10 Myrs (Fig. 6, center and right plots, similarly to the purely viscous case. This confirms that at lower external photo-evaporation, the lifetimes for discs are similar to those without external photo-evaporation.
The evolution of the disc’s C/O ratio is similar to our previous simulations. The only difference is that the longer disc lifetime allows for a greater increase in the C/O ratio in the inner disc, as there is more time available for the water vapour to be accreted onto the star and for carbon enhanced gas to move inwards. The overall values before external photo-evaporations starts are in agreement with the purely viscous evolution (Fig. 1), as before.
A low external photo-evaporation rate essentially has no influence on the chemical composition of the inner disc (see Fig 7). In Fig 7, we present the ratios of the disc C/O ratio for our three different external photo-evaporation rates for disc regions until 40 AU. This plot illustrates that the C/O ratio in the inner disc is unaffected by the external photo-evaporation rate, as long as the disc is not losing mass in an effective manner. There is however difference in the outer disc chemistry for stronger UV environments (particularly around 20 AU and at disc times of around 2.5 Myr and later), where photo-evaporation becomes efficient and starts to disrupt the disc (see Fig. 7).
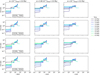 |
Fig. 4 Carbon to oxygen ratio of the protoplanetary discs as a function of time, corresponding to the disc profile shown in Fig. A.3, with an onset of external photo-evaporation at t=3 Myr. |
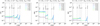 |
Fig. 5 Different element ratios in the gas phase as a function of disc radius and time for a viscous disc with external photo-evaporation begining after 1 Myr. The element ratios feature a disc with a viscosity of 1e-4, disc mass of 0.1 M⊙, and disc radius of 75 au. Left: C/H, middle: O/H, right: N/H. Color coding shows the time evolution. |
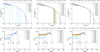 |
Fig. 6 Gas surface density (top) and C/O ratio (bottom) for external photo-evaporation strengths of 103G0 (left), 102G0 (center), and 10G0 (right), for discs with external photo-evaporation beginning at 1 Myr. |
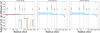 |
Fig. 7 Comparison of C/O ratios across different UV environments as depicted in Fig 6 but for the disc regions until 40 AU. Left, middle, and right panels illustrate C/O ratio comparisons between UV environments of 10 G0 and 100 G0, 10 G0 and 1000 G0, and 100 G0 and 1000 G0, respectively. |
4 Discussion
As the protoplanetary disc evolves, small dust grains coalesce into pebbles and migrate inwards. The growth of these grains correlates with the orbital period; hence, grains in the outer regions of the disc require more time to develop. Larger discs can therefore sustain a pebble flux into their central regions for extended periods (Bitsch & Mah 2023). However, this process is moderated by external photo-evaporation, which truncates the disc’s outer parts, diminishing the influx of pebbles to the inner regions and potentially stunting planetary formation (Qiao et al. 2023). Our simulations confirm these previous results, as long as the external photo-evaporation rate disperses the disc within the first Myr. If external photo-evaporation acts later, planets could still form, as long as the embryos can start to accrete early (e.g. Savvidou & Bitsch 2023, 2024 and Appendix A.3). However, these planets might then be hindered in their gas accretion phase and remain Neptune-sized cores. Planets that form in the inner regions of the disc are expected to have similar chemical compositions as in the purely viscous case, since the chemical evolution of the disc remains similar to the purely viscous disc evolution. Thus, the external photo-evaporation only sets the lifetime of the disc and when the planet would stop growing, but without altering the planetary composition, thereby justifying the approach taken in previous studies, where the disc is evaporated ad hoc (e.g. Bitsch et al. 2022).
On the other hand, internal photo-evaporation similarly plays a critical role by inducing gaps within protoplanetary discs. These gaps disrupt the homogeneous distribution of gas and dust, with gas diffusing into the gaps subsequently swept away by photoevaporative winds. Furthermore, substructures within the disc might reflect gap-opening processes1 that act as dust traps, potentially explaining the redistribution of dust particles throughout the disc (Gárate et al. 2024). These processes effectively block the inwardly drift of gas and pebbles, complicating the attainment of solar or super-solar carbon-to-oxygen (C/O) ratios in the inner disc regions (Lienert et al. 2024). Our results are aligned with this perspective, pinpointing how both external and internal photo-evaporation uniformly influence the chemical composition of the inner disc, despite their different underlying mechanisms.
Recent observations by Díaz-Berríos et al. (2024) identified CO isotopologues in various protoplanetary discs. These findings indicate that the discs, featuring moderately irradiated environments, showed no substantial differences in CO abundances between isolated and irradiated settings. The study suggests that the observed chemical similarities are likely due to variations in stellar mass rather than the influence of external far-ultraviolet (FUV) radiation. This also indicates that the discs are located at distances where the massive Trapezium stars have minimal impact on their chemical compositions.
On the other hand, Ramírez-Tannus et al. (2023) studied a disc in the NGC 6357 region, where extreme UV environments from close-by numerous massive OB stars are present. Studying a young disc (age < 1 Myr) in this region, Ramírez-Tannus et al. (2023) find no significant difference in the chemical composition of the inner disc regions compared to more isolated discs that also show a significant water excess (e.g. Perotti et al. 2023; Grant et al. 2023; Banzatti et al. 2023). Our simulations clearly show that external photo-evaporation, even when it has dispersed the very outer disc regions away, still does not substantially influence the inner disc’s composition, as the pebbles already have a few 100 kyrs-1 Myr to drift inwards and enrich the disc with vapour, maintaining a low C/O ratio, before the onset of external photo-evaporation. Furthermore, our model implies that a low viscosity is needed, as larger viscosities (e.g.α = 10−3) would result in an already close to solar C/O ratio, before external photo-evaporation becomes efficient.
Given these insights, our findings suggest important implications for future observations aimed at observing chemical abundances in highly irradiated (and non-irradiated) regions of inner discs. Our model predicts that the C/O ratio in these inner discs should be low (as long as the viscosity is low) when the discs are young. Consequently, we would expect larger C/O ratios for older discs. On the other hand, the C/O ratio of the inner disc region can be influenced by outer pressure perturbations (Mah et al. 2024), demonstrating the need to get a full picture of the disc’s structure and composition to constrain its evolution.
5 Conclusions
In this study, we have conducted 1D semi-analytical simulations of protoplanetary discs irradiated by external far-ultraviolet (FUV) radiation, focusing on systems hosted by solar-like stars.
Our model incorporates both pebble drift and the effects of pebble evaporation. We compare the results of our simulations with external photo-evaporation to a purely viscous case.
Our findings demonstrate that external photo-evaporation exerts a profound influence on the evolution of protoplanetary discs, in line with previous studies (e.g. Qiao et al. 2023). Specifically, external photo-evaporation truncates the outer regions of the disc, effectively halting the influx of pebbles and thereby impeding the formation of planetary cores within the inner disc, as long as external photo-evaporation starts to act early. If external photo-evaporation becomes efficient only after 1-2 Myr, the majority of the pebbles have already drifted inwards (see Appendix A.3), giving rise to efficient planet formation (e.g. Savvidou & Bitsch 2023). On the other hand, low-mass discs are dissipated by external photo-evaporation as soon as it starts, destroying all hope for planet formation. However, such low-mass discs would have had trouble forming giant planets in the first place (e.g. Savvidou & Bitsch 2023).
The inner disc composition is driven by inwardly drifting and evaporating pebbles. As the pebbles grow quickly and move inwards on short timescales, they can enrich the inner disc already very early on (see also Mah et al. 2024), resulting in sub-solar C/O ratios with super-solar water contents. Over time, this sub-solar C/O ratio increases due to the accretion of water vapour onto the star and inwardly moving carbon rich gas. Once external photo-evaporation starts to act, the inner disc chemistry continues to evolve as in the viscous case, because the enriched gas in the inner few AU is not influenced by the removal of material at a few 10 AUs. As external photo-evaporation continues, the whole disc is eventually dispersed away.
In our model, the discs remain sub-solar in their C/O ratio for a few Myr, similar to the purely viscous case, before external photo-evaporation removes the disc. In this case, our model predicts that inner discs would have a low C/O ratio and a high water content, even when subject to external photo-evaporation, which is in line with observations (Ramírez-Tannus et al. 2023).
On the other hand, higher viscosities could allow for larger C/O ratios in the inner disc region, because the water vapour is accreted onto the star on shorter timescales and carbon-rich material can make its way inwards at a faster rate. Nevertheless, the chemical evolution is again very similar to a purely viscous disc, even after external photo-evaporation commences. This implies that the influence of external photo-evaporation on the composition of planets residing in the inner discs might be minimal. Furthermore, we predict that there should be no difference in the chemical compositions of discs that are subject to external photo-evaporation, compared to discs that are in low-radiation environments (i.e. isolated environments), where external photo-evaporation plays only a minor role. This approach will be testable with future JWST observations (e.g. Ramírez-Tannus et al. 2023).
Acknowledgements
We thank Maria-Claudia Ramirez-Tannus for the helpful discussions. We also thank the anonymous referee whose comments substantially improved this paper. N.N. acknowledges the financial support of Max-Planck Africa Mobility Grant that helped to set up this research collaboration.
Appendix A Additional information
A.1 Gas surface density evolution
In Fig. 1 (left panel), the results of the nominal simulation is illustrated, showing evolution of disc’s gas surface density over a span of 10 Myr, in the absence of external photo-evaporation. The figure shows the natural dispersal mechanisms inherent to the disc’s evolution, providing a fundamental baseline for our understanding of disc dynamics prior to considering the impact of external photoevaporative processes-the central focus of this paper.
Starting with scenarios of intense photo-evaporation, exposing the disc to such conditions from as early as 0 Myr (without any protective shielding) generally results in a significant truncation of the disc at early stages. This observation is consistent with pioneering studies on shielding protoplanetary discs against external photo-evaporation (Qiao et al. 2022). The extent of this impact, while dependent on specific disc parameters, is considerable in most cases. For instance, a disc with 0.1 M⊙ and an initial radius of 75 AU within viscous environment of α = 10−4 is reduced to approximately 0.5 AU radius after just 1.5 Myr, indicating a 99 % reduction in the disc radius and its capacity to harbor planetary building materials (Fig. A.1). The smaller mass discs of our sample 0.01 M⊙ are basically dispersed immediately, because of the high evaporation rates and their low mass.
For higher viscosities, the picture is not changed significantly. In fact, the disc’s life times are reduced, compared to the low viscosity simulations, because the higher viscosity allows for a faster viscous evolution of the inner disc not touched upon by external photo-evaporation.
Increasing the shielding time from photo-evaporation reduces the destructive effects of photo-evaporation on the disc profile. For example, with photo-evaporation now beginning at 1 Myr, the disc with 0.1 M⊙ can now survive until 2.5 Myr (third row and first column plot of Fig. A.2). With shielding increased further to 3 Myr, the disc can survive even favorably until 4 Myr (third row and first column plot of Fig. 4). Essentially, the disc’s lifetime is increased by the delayed start of the external photo-evaporation.
As external photo-evaporation acts from the outside inwards, discs with a higher surface density harbor a longer lifetime. This can be seen by comparing the 0.1 M⊙ discs with 75 and 150 AU characteristic radius. The smaller disc harbors a higher gas surface density and thus survives longer against external photo-evaporation.
Therefore, the disc mass sets the lifetime against the external photo-evaporation. Low mass disc with 0.01 M⊙ are dispersed immediately, while higher mass discs can survive longer. This change in the disc’s life time has important consequences for the chemical evolution of the inner disc regions, as well as on the formation of planets in the inner disc regions, which can be hindered if external photo-evaporation is too efficient (Qiao et al. 2023) and starts early. On the other hand, as giant planets form early (Savvidou & Bitsch 2023), a delayed external photo-evaporation by 1 Myr might not prevent the formation of planets, but might just reduce their final mass acquired by gas accretion.
A.2 Chemical evolution of purely viscous disc
We show in Fig. A.4, the chemical evolution of a purely viscous disc corresponding to the disc shown in Fig. 1. In particular, we show C/H, O/H, and N/H evolution as function of time. This allows for a comparison of the chemical evolution to the disc subject to external photo-evaporation.
As the pebbles drift inwards, they evaporate at their corresponding evaporation lines, enriching the disc with their vapour. The relative increase in the C/H, O/H, and N/H with respect to the initial value is governed by the abundance of the corresponding volatile molecules. For example, the increase in carbon at the CH4 evaporation front is larger compared to the increase at the CO2 evaporation front, because the total abundance of CH4 is larger than the total abundance of CO2 (see table A.1). For oxygen, obviously the jump at the water evaporation front is largest.
Once pebbles start to evaporate, the disc is enriched first closest to the evaporation front. With time the enrichment in vapour slowly moves inwards with the gas, smoothing out the enrichment, resulting in a nearly horizontal enrichment of the disc interior to evaporation fronts in the inner disc. In the outer disc, this effect takes longer, as the distance between the evaporation fronts is larger. With larger viscosity, this effect happens faster, as explained in Mah et al. (2023).
A.3 Pebble flux evolution
We show in Fig. A.5 the time evolution of the pebble flux in the inner disc (at r=0.5 AU) for a purely viscous disc and for discs where the external photo-evaporation starts at 0, 1 and 3 Myr. The discs all feature an α viscosity parameter of 10−4 and have an initial disc radius of 75 AU with a mass of 0.1 solar masses, corresponding to the standard disc featured in Fig. 1.
Within the first few 10s of kyrs, there is no difference in the pebble flux between the different models. However, at around 100kyr, the pebble flux in the disc where external photo-evaporation starts to act at t=0, increases compared to the purely viscous case. This is related to the fact that the outer disc loses gas density, resulting in an increase in the Stokes numbers of the particles in the outer disc which consequently drift inwards faster, enhancing the pebble flux. Consequently, this enlarged pebble flux depletes the outer disc of pebbles and the pebble flux is then reduced compared to the pure viscous case after around 150kyrs. The pebble flux then steadily declines as the outer disc starts to be evaporated away. At around 1.5 Myr, a steep decrease in the pebble flux is observed, due the fact that the whole disc is slowly removed by photo-evaporation.
The discs where external photo-evaporation starts at 1 or 3 Myr, show a similar behaviour. Shortly after the external photo-evaporation starts, an increase in the pebble flux can be observed. This is again related to the larger Stokes number of the particles in the outer disc that then start to drift inwards effectively. However, again, once these pebbles have drifted inwards, the pebble flux declines and rapidly falls off around 1.5 Myr after the external photo-evaporation starts to be efficient. This is related - as described above - to the loss of material that rapidly drifted inwards due to mass loss of the disc.
Generally speaking, the pebble flux is the same in the purely viscous case and in discs with external photo-evaporation, until external photo-evaporation becomes efficient. Consequently, as discussed in the main paper, the inner disc composition driven by inwardly drifting and evaporating pebbles, is similar in these cases. On the other hand, the more rapid inward flux of pebbles might be hindering the formation of planets, because a larger pebble flux does not linearly translate into a faster growth of planets, especially when the planetary embryos are still small (e.g. Lambrechts & Johansen 2014; Bitsch et al. 2015; Qiao et al. 2023. However, if external photo-evaporation just starts after 1 Myr of evolution, the planets could have already formed (Savvidou & Bitsch 2023), where we expect that external photo-evaporation would just set the final mass of gas giants rather than preventing their formation in general.
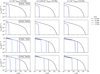 |
Fig. A.1 Gas surface density for a viscous disc with external photo-evaporation from neighbouring stars. The gas surface density is shown as a function of disc radius and time. A variety of parameter configurations is used for this study: Along the x-axis of this figure, α is varied from α = 10−4 to α = 10−2, whereas on the y-axis, different sets of disc masses and radii are used, as indicated in the panels. The colour coding gives the time evolution. The discs with 0.01 solar masses are dispersed by external photo-evaporation within the first 0.5 Myr and thus show now evolution in the plot. |
A.4 Model parameters
We show in this section the input parameters for our chemical composition model. In table A.l we show the partitioning of the different elements into molecules and solids, while table A.2 shows the initial elemental abundances used in our work.
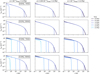 |
Fig. A.2 Same as Fig. A.1, but the onset of the external photo-evaporation time has been set 1.0 Myr. Note: the disc evolution time is about 1 Myr longer, because the later onset of external photo-evaporation allows for a longer disc life time. |
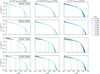 |
Fig. A.3 Same as Fig. A.1, but with an onset of external photo-evaporation after 3 Myr. Consequently, the disc survives longer compared to the previous models. |
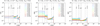 |
Fig. A.4 Different element ratios in the gas phase as a function of disc radius and time for a viscous disc without external photo-evaporation (see Fig. 1) The element ratios feature disc with viscosity of 1e-4, disc mass of 0.1 M⊙, and disc radius of 75 au. Left: C/H, middle: O/H, right: N/H. The color coding shows the time evolution. |
 |
Fig. A.5 Pebble flux at disc radial location of 0.5 AU for our nominal disc and discs with external photo-evaporation beginning at 0, 1 and 3 Myr, respectively. |
Condensation temperatures and volume mixing ratios of the chemical species in our model.
Number ratios of the elements used in our model, corresponding to the abundance of element X relative to hydrogen in the solar photosphere (Asplund et al. 2009).
References
- Armitage, P. J. 2013, Astrophysics of Planet Formation (Cambridge: Cambridge University Press) [Google Scholar]
- Asplund, M., Grevesse, N., Sauval, A. J., & Scott, P. 2009, ARA&A, 47, 481 [NASA ADS] [CrossRef] [Google Scholar]
- Ataiee, S., Baruteau, C., Alibert, Y., & Benz, W. 2018, A&A, 615, A110 [NASA ADS] [CrossRef] [EDP Sciences] [Google Scholar]
- Banzatti, A., Pontoppidan, K. M., Carr, J. S., et al. 2023, ApJ, 957, L22 [NASA ADS] [CrossRef] [Google Scholar]
- Bergez-Casalou, C., Bitsch, B., Pierens, A., Crida, A., & Raymond, S. N. 2020, A&A, 643, A133 [NASA ADS] [CrossRef] [EDP Sciences] [Google Scholar]
- Birnstiel, T., Klahr, H., & Ercolano, B. 2012, A&A, 539, A148 [NASA ADS] [CrossRef] [EDP Sciences] [Google Scholar]
- Bitsch, B., & Battistini, C. 2020, A&A, 633, A10 [NASA ADS] [CrossRef] [EDP Sciences] [Google Scholar]
- Bitsch, B., & Mah, J. 2023, A&A, 679, A11 [NASA ADS] [CrossRef] [EDP Sciences] [Google Scholar]
- Bitsch, B., Lambrechts, M., & Johansen, A. 2015, A&A, 582, A112 [NASA ADS] [CrossRef] [EDP Sciences] [Google Scholar]
- Bitsch, B., Morbidelli, A., Johansen, A., et al. 2018, A&A, 612, A30 [NASA ADS] [CrossRef] [EDP Sciences] [Google Scholar]
- Bitsch, B., Raymond, S. N., Buchhave, L. A., et al. 2021, A&A, 649, L5 [NASA ADS] [CrossRef] [EDP Sciences] [Google Scholar]
- Bitsch, B., Schneider, A. D., & Kreidberg, L. 2022, A&A, 665, A138 [NASA ADS] [CrossRef] [EDP Sciences] [Google Scholar]
- Blum, J., & Wurm, G. 2008, ARA&A, 46, 21 [Google Scholar]
- Booth, R. A., & Ilee, J. D. 2019, MNRAS, 487, 3998 [CrossRef] [Google Scholar]
- Booth, R. A., Clarke, C. J., Madhusudhan, N., & Ilee, J. D. 2017, MNRAS, 469, 3994 [Google Scholar]
- Brauer, F., Dullemond, C. P., & Henning, Th. 2008, A&A, 480, 859 [NASA ADS] [CrossRef] [EDP Sciences] [Google Scholar]
- Chiang, E. I., & Goldreich, P. 1997, ApJ, 490, 368 [Google Scholar]
- D’Angelo, G., & Lubow, S. H. 2008, ApJ, 685, 560 [CrossRef] [Google Scholar]
- Díaz-Berríos, J. K., Guzmán, V. V., Walsh, C., et al. 2024, arXiv e-prints [arXiv:2405.00615] [Google Scholar]
- Drazkowska, J., Li, S., Birnstiel, T., Stammler, S. M., & Li, H. 2019, ApJ, 885, 91 [CrossRef] [Google Scholar]
- Ercolano, B., Drake, J. J., Raymond, J. C., & Clarke, C. C. 2008, ApJ, 688, 398 [Google Scholar]
- Estrada, P. R., & Cuzzi, J. N. 2022, ApJ, 936, 40 [NASA ADS] [CrossRef] [Google Scholar]
- Estrada, P. R., Cuzzi, J. N., & Umurhan, O. M. 2022, ApJ, 936, 42 [NASA ADS] [CrossRef] [Google Scholar]
- Fatuzzo, M., & Adams, F. C. 2008, ApJ, 675, 1361 [NASA ADS] [CrossRef] [Google Scholar]
- Gárate, M., Pinilla, P., Haworth, T. J., & Facchini, S. 2024, A&A, 681, A84 [NASA ADS] [CrossRef] [EDP Sciences] [Google Scholar]
- Gasman, D., Van Dishoeck, E. F., Grant, S. L., et al. 2023, A&A, 679, A117 [NASA ADS] [CrossRef] [EDP Sciences] [Google Scholar]
- Ginski, C., Garufi, A., Benisty, M., et al. 2024, A&A, 685, A52 [NASA ADS] [CrossRef] [EDP Sciences] [Google Scholar]
- Grant, S. L., Van Dishoeck, E. F., Tabone, B., et al. 2023, ApJ, 947, L6 [NASA ADS] [CrossRef] [Google Scholar]
- Gundlach, B., & Blum, J. 2014, ApJ, 798, 34 [NASA ADS] [CrossRef] [Google Scholar]
- Güttler, C., Blum, J., Zsom, A., Ormel, C. W., & Dullemond, C. P. 2010, A&A, 513, A56 [Google Scholar]
- Haworth, T. J., & Clarke, C. J. 2019, MNRAS, 485, 3895 [NASA ADS] [CrossRef] [Google Scholar]
- Haworth, T. J., Coleman, G. A. L., Qiao, L., Sellek, A. D., & Askari, K. 2023, MNRAS, 526, 4315 [NASA ADS] [CrossRef] [Google Scholar]
- Henney, W. J., & Arthur, S. J. 1998, AJ, 116, 322 [NASA ADS] [CrossRef] [Google Scholar]
- Henney, W. J., & O’Dell, C. R. 1999, AJ, 118, 2350 [CrossRef] [Google Scholar]
- Johansen, A., Blum, J., Tanaka, H., et al. 2014, in Protostars and Planets VI, eds. H. Beuther, R. S. Klessen, C. P. Dullemond, & T. Henning (Tucson: University of Arizona Press), 547 [Google Scholar]
- Kalyaan, A., Pinilla, P., Krijt, S., Mulders, G. D., & Banzatti, A. 2021, ApJ, 921, 84 [CrossRef] [Google Scholar]
- Kalyaan, A., Pinilla, P., Krijt, S., et al. 2023, ApJ, 954, 66 [NASA ADS] [CrossRef] [Google Scholar]
- Lada, C. J., & Lada, E. A. 2003, ARA&A, 41, 57 [Google Scholar]
- Lambrechts, M., & Johansen, A. 2014, A&A, 572, A107 [NASA ADS] [CrossRef] [EDP Sciences] [Google Scholar]
- Lambrechts, M., Johansen, A., & Morbidelli, A. 2014, A&A, 572, A35 [NASA ADS] [CrossRef] [EDP Sciences] [Google Scholar]
- Lienert, J. L., Bitsch, B., & Henning, Th. 2024, A&A, in press, https://doi.org/10.1051/0004-6361/202348798 [NASA ADS] [CrossRef] [EDP Sciences] [Google Scholar]
- Lodders, K. 2003, ApJ, 591, 1220 [Google Scholar]
- Lynden-Bell, D., & Pringle, J. E. 1974, MNRAS, 168, 603 [Google Scholar]
- Madhusudhan, N., Knutson, H., Fortney, J. J., & Barman, T. 2014, in Protostars and Planets VI (Tucson: University of Arizona Press) [Google Scholar]
- Mah, J., Bitsch, B., Pascucci, I., & Henning, T. 2023, A&A, 677, L7 [CrossRef] [EDP Sciences] [Google Scholar]
- Mah, J., Savvidou, S., & Bitsch, B. 2024, A&A, 686, L17 [NASA ADS] [CrossRef] [EDP Sciences] [Google Scholar]
- Mollière, P., Molyarova, T., Bitsch, B., et al. 2022, ApJ, 934, 74 [CrossRef] [Google Scholar]
- Mousis, O., Marboeuf, U., Lunine, J. I., et al. 2009, ApJ, 696, 1348 [NASA ADS] [CrossRef] [Google Scholar]
- Mousis, O., Atkinson, D. H., & Ice Giants team 2022, EGU General Assembly 2022, EGU22-13077 [NASA ADS] [Google Scholar]
- Müller, J., Savvidou, S., & Bitsch, B. 2021, A&A, 650, A185 [Google Scholar]
- Musiolik, G., & Wurm, G. 2019, ApJ, 873, 58 [NASA ADS] [CrossRef] [Google Scholar]
- Ndugu, N., Bitsch, B., & Jurua, E. 2018, MNRAS, 474, 886 [Google Scholar]
- Ndugu, N., Bitsch, B., & Jurua, E. 2019, MNRAS, 488, 3625 [CrossRef] [Google Scholar]
- Ndugu, N., Abedigamba, O. P., & Andama, G. 2022, MNRAS, 512, 861 [NASA ADS] [CrossRef] [Google Scholar]
- Öberg, K. I., Murray-Clay, R., & Bergin, E. A. 2011, ApJ, 743, L16 [Google Scholar]
- Owen, J. E., Clarke, C. J., & Ercolano, B. 2012, MNRAS, 422, 1880 [Google Scholar]
- Paardekooper, S.-J., & Mellema, G. 2006, A&A, 453, 1129 [CrossRef] [EDP Sciences] [Google Scholar]
- Pascucci, I., Cabrit, S., Edwards, S., et al. 2022 [Google Scholar]
- Perotti, G., Christiaens, V., Henning, Th., et al. 2023, Nature, 620, 516 [NASA ADS] [CrossRef] [Google Scholar]
- Picogna, G., Ercolano, B., Owen, J. E., & Weber, M. L. 2019, MNRAS, 487, 691 [Google Scholar]
- Pinilla, P., Birnstiel, T., Ricci, L., et al. 2012, A&A, 538, A114 [NASA ADS] [CrossRef] [EDP Sciences] [Google Scholar]
- Pinilla, P., Pohl, A., Stammler, S. M., & Birnstiel, T. 2017, ApJ, 845, 68 [Google Scholar]
- Piso, A.-M. A., Öberg, K. I., Birnstiel, T., & Murray-Clay, R. A. 2015, ApJ, 815, 109 [Google Scholar]
- Pringle, J. E. 1981, ARA&A, 19, 137 [NASA ADS] [CrossRef] [Google Scholar]
- Qiao, L., Haworth, T. J., Sellek, A. D., & Ali, A. A. 2022, MNRAS, 512, 3788 [NASA ADS] [CrossRef] [Google Scholar]
- Qiao, L., Coleman, G. A. L., & Haworth, T. J. 2023, MNRAS, 522, 1939 [NASA ADS] [CrossRef] [Google Scholar]
- Ramírez-Tannus, M. C., Bik, A., Cuijpers, L., et al. 2023, ApJ, 958, L30 [CrossRef] [Google Scholar]
- Ros, K., & Johansen, A. 2013, A&A, 552, A137 [NASA ADS] [CrossRef] [EDP Sciences] [Google Scholar]
- Safronov, V. S. 1972, Evolution of the Protoplanetary Cloud and Formation of the Earth and Planets (Jerusalem (Israel): Israel Program for Scientific Translations, Keter Publishing House) [Google Scholar]
- Savvidou, S., & Bitsch, B. 2023, A&A, 679, A42 [NASA ADS] [CrossRef] [EDP Sciences] [Google Scholar]
- Savvidou, S., & Bitsch, B. 2024, A&A, submitted [arXiv:2407.08533] [NASA ADS] [CrossRef] [EDP Sciences] [Google Scholar]
- Schneider, A. D., & Bitsch, B. 2021a, A&A, 654, A71 [Google Scholar]
- Schneider, A. D., & Bitsch, B. 2021b, A&A, 654, A72 [NASA ADS] [CrossRef] [EDP Sciences] [Google Scholar]
- Schneider, A. D., & Bitsch, B. 2023, arXiv e-prints [arXiv:2401.15686] [Google Scholar]
- Sellek, A. D., Booth, R. A., & Clarke, C. J. 2020, MNRAS, 492, 1279 [NASA ADS] [CrossRef] [Google Scholar]
- Shakura, N. I., & Sunyaev, R. A. 1973, A&A, 24, 337 [NASA ADS] [Google Scholar]
- Stammler, S. M., Lichtenberg, T., Draz kowska, J., & Birnstiel, T. 2023, A&A, 670, L5 [NASA ADS] [CrossRef] [EDP Sciences] [Google Scholar]
- Tzouvanou, A., Bitsch, B., & Pichierri, G. 2023, A&A, 677, A82 [NASA ADS] [CrossRef] [EDP Sciences] [Google Scholar]
- Weber, P., Benítez-Llambay, P., Gressel, O., Krapp, L., & Pessah, M. E. 2018, ApJ, 854, 153 [NASA ADS] [CrossRef] [Google Scholar]
- Weidenschilling, S. J. 1977, MNRAS, 180, 57 [Google Scholar]
- Weidenschilling, S. J., & Cuzzi, J. N. 1993, in Protostars and Planets III, eds. E. H. Levy, & J. I. Lunine (Tucson: University of Arizona Press), 1031 [Google Scholar]
- Winter, A. J., Kruijssen, J. M. D., Longmore, S. N., & Chevance, M. 2020, Nature, 586, 528 [Google Scholar]
We remind the reader that not all substructures in discs correspond to gaps caused by growing planets-other physical processes may also be at play. For a detailed discussion, see Ndugu et al. (2019) or Tzouvanou et al. (2023).
All Tables
Condensation temperatures and volume mixing ratios of the chemical species in our model.
Number ratios of the elements used in our model, corresponding to the abundance of element X relative to hydrogen in the solar photosphere (Asplund et al. 2009).
All Figures
|
Fig. 1 Nominal gas surface density (left panel) and the nominal carbon to oxygen fraction (right panel) as a function of disc radius for a viscous disc evolution, as given in Eq. (2). The simulations here represent the parameters outlined in Table 1, matching our standard simulations. The time evolution is shown in colour, from black, which corresponds to 0 Myr, to dark red, which corresponds to 10 Myr. |
| In the text | |
|
Fig. 2 Carbon to oxygen ratio of the protoplanetary discs as a function of time, corresponding to the disc profile shown in Fig. A.1, with an onset of external photo-evaporation at t = 0. |
| In the text | |
|
Fig. 3 Carbon to oxygen ratio of the protoplanetary discs as a function of time and radius, corresponding to the disc profiles shown in Fig. A.2, with an onset of external photo-evaporation at t = 1 Myr. |
| In the text | |
|
Fig. 4 Carbon to oxygen ratio of the protoplanetary discs as a function of time, corresponding to the disc profile shown in Fig. A.3, with an onset of external photo-evaporation at t=3 Myr. |
| In the text | |
|
Fig. 5 Different element ratios in the gas phase as a function of disc radius and time for a viscous disc with external photo-evaporation begining after 1 Myr. The element ratios feature a disc with a viscosity of 1e-4, disc mass of 0.1 M⊙, and disc radius of 75 au. Left: C/H, middle: O/H, right: N/H. Color coding shows the time evolution. |
| In the text | |
|
Fig. 6 Gas surface density (top) and C/O ratio (bottom) for external photo-evaporation strengths of 103G0 (left), 102G0 (center), and 10G0 (right), for discs with external photo-evaporation beginning at 1 Myr. |
| In the text | |
|
Fig. 7 Comparison of C/O ratios across different UV environments as depicted in Fig 6 but for the disc regions until 40 AU. Left, middle, and right panels illustrate C/O ratio comparisons between UV environments of 10 G0 and 100 G0, 10 G0 and 1000 G0, and 100 G0 and 1000 G0, respectively. |
| In the text | |
|
Fig. A.1 Gas surface density for a viscous disc with external photo-evaporation from neighbouring stars. The gas surface density is shown as a function of disc radius and time. A variety of parameter configurations is used for this study: Along the x-axis of this figure, α is varied from α = 10−4 to α = 10−2, whereas on the y-axis, different sets of disc masses and radii are used, as indicated in the panels. The colour coding gives the time evolution. The discs with 0.01 solar masses are dispersed by external photo-evaporation within the first 0.5 Myr and thus show now evolution in the plot. |
| In the text | |
|
Fig. A.2 Same as Fig. A.1, but the onset of the external photo-evaporation time has been set 1.0 Myr. Note: the disc evolution time is about 1 Myr longer, because the later onset of external photo-evaporation allows for a longer disc life time. |
| In the text | |
|
Fig. A.3 Same as Fig. A.1, but with an onset of external photo-evaporation after 3 Myr. Consequently, the disc survives longer compared to the previous models. |
| In the text | |
|
Fig. A.4 Different element ratios in the gas phase as a function of disc radius and time for a viscous disc without external photo-evaporation (see Fig. 1) The element ratios feature disc with viscosity of 1e-4, disc mass of 0.1 M⊙, and disc radius of 75 au. Left: C/H, middle: O/H, right: N/H. The color coding shows the time evolution. |
| In the text | |
|
Fig. A.5 Pebble flux at disc radial location of 0.5 AU for our nominal disc and discs with external photo-evaporation beginning at 0, 1 and 3 Myr, respectively. |
| In the text | |
Current usage metrics show cumulative count of Article Views (full-text article views including HTML views, PDF and ePub downloads, according to the available data) and Abstracts Views on Vision4Press platform.
Data correspond to usage on the plateform after 2015. The current usage metrics is available 48-96 hours after online publication and is updated daily on week days.
Initial download of the metrics may take a while.