Open Access
Fig. 7
Download original image
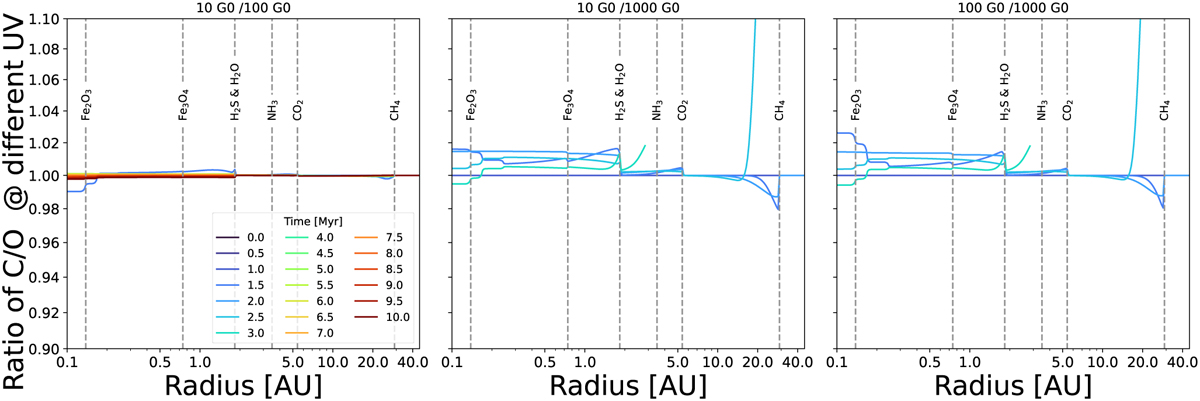
Comparison of C/O ratios across different UV environments as depicted in Fig 6 but for the disc regions until 40 AU. Left, middle, and right panels illustrate C/O ratio comparisons between UV environments of 10 G0 and 100 G0, 10 G0 and 1000 G0, and 100 G0 and 1000 G0, respectively.
Current usage metrics show cumulative count of Article Views (full-text article views including HTML views, PDF and ePub downloads, according to the available data) and Abstracts Views on Vision4Press platform.
Data correspond to usage on the plateform after 2015. The current usage metrics is available 48-96 hours after online publication and is updated daily on week days.
Initial download of the metrics may take a while.