| Issue |
A&A
Volume 691, November 2024
|
|
|---|---|---|
| Article Number | A126 | |
| Number of page(s) | 9 | |
| Section | Cosmology (including clusters of galaxies) | |
| DOI | https://doi.org/10.1051/0004-6361/202449483 | |
| Published online | 05 November 2024 | |
Beyond the Hellings–Downs curve: Non-Einsteinian gravitational waves in pulsar timing array correlations
1
Asia Pacific Center for Theoretical Physics,
Pohang
37673,
Republic of Korea
2
Institute of Physics, Academia Sinica,
Taipei
11529,
Taiwan
3
Institute of Astronomy and Astrophysics, Academia Sinica,
Taipei
11529,
Taiwan
★ Corresponding authors; reginald.bernardo@apctp.org, nkw@phys.sinica.edu.tw
Received:
4
February
2024
Accepted:
28
September
2024
Pulsar timing arrays (PTAs) have revealed galaxy-size gravitational waves (GWs) in the form of a stochastic gravitational wave background (SGWB), correlating the radio pulses emitted by millisecond pulsars. This discovery naturally leads to the question of the origin and the nature of the SGWB; the latter is synonymous to testing how quadrupolar the inter-pulsar spatial correlation is. In this paper, we investigate the nature of the SGWB by considering correlations beyond the Hellings–Downs (HD) curve of Einstein’s general relativity. We scrutinize the HD and non-Einsteinian GW correlations with the North American Nanohertz Observatory for Gravitational Waves and the Chinese PTA data, and find that both data sets allow a graviton mass of mg ≲ 1.04 × 10⁻²² eV/c2 and subluminal traveling waves. We discuss gravitational physics scenarios beyond general relativity that could host non-Einsteinian GW correlations in the SGWB and highlight the importance of the cosmic variance inherited from stochastic variations across realizations in interpreting PTA observations.
Key words: gravitation / gravitational waves / cosmology: observations / cosmology: theory
© The Authors 2024
 Open Access article, published by EDP Sciences, under the terms of the Creative Commons Attribution License (https://creativecommons.org/licenses/by/4.0), which permits unrestricted use, distribution, and reproduction in any medium, provided the original work is properly cited.
This article is published in open access under the Subscribe to Open model. Subscribe to A&A to support open access publication.
1 Introduction
The detection of the stochastic gravitational wave background (SGWB) by the pulsar timing array (PTA) astronomical community (Agazie et al. 2023b; Reardon et al. 2023; Antoniadis et al. 2023; Xu et al. 2023) is distinct in various ways from previous observations of gravitational waves (Abbott et al. 2023; Romano & Allen 2024). Conceptually, as the SGWB is light years in size, the PTAs have had to monitor millisecond pulsars over timescales of years to decades (Detweiler 1979; Romano & Cornish 2017; Burke-Spolaor et al. 2019; Pol et al. 2021) and overcome challenges related to sustaining such an illustrious effort to make a robust observation. This astronomical milestone most importantly shows that gravitational waves (GW) manifest the very feature that sets apart waves – ‘interference’ – to produce a galactic superposition that spatially correlates the time of arrival of radio pulses of millisecond pulsars. This correlation, embodied by the Hellings–Downs (HD) curve (Hellings & Downs 1983; Jenet & Romano 2015; Fig. 1), underlines a pronounced quadrupolar shape that distinguishes the presence of a gravitational wave background.
The resolution of this elusive signal is the culmination of decades of theoretical and experimental work in PTA science (Phinney 2001; Hobbs et al. 2010; Lee et al. 2010, 2011; Dai et al. 2012; Yunes & Siemens 2013; Gair et al. 2014; Vigeland & Vallisneri 2014; Lommen 2015; Vagnozzi 2021; Taylor 2021; Pol et al. 2022; Allen 2023; Bernardo & Ng 2022b, 2023b; Allen & Romano 2023; Allen et al. 2023). Now, the nanohertz GW window advances GW astronomy to its multiband era (Lasky et al. 2016; Bailes et al. 2021; Lambiase et al. 2023), making PTAs particularly valuable for GW and multimessenger science. But even in the nanohertz GW regime alone, since the observation of the HD curve, the focus of PTA science has shifted to understanding the source and nature of the SGWB.
Supermassive black hole binaries, or rather the nanohertz GWs they emit, would appear to be natural candidate sources of the SGWB (Rajagopal & Romani 1995; Jaffe & Backer 2003; Sesana et al. 2008; Ravi et al. 2015; Shannon et al. 2015; Mingarelli et al. 2017; Liu & Vigeland 2021; Arzoumanian et al. 2021b; Agazie et al. 2023a; Antoniadis et al. 2024b; Ellis et al. 2024b; Cannizzaro et al. 2024); however, the presently available data allow for more speculative and interesting possibilities, such as primodrial black holes, first-order phase transitions, and domain walls (Chen et al. 2020; Arzoumanian et al. 2021a; Xue et al. 2021; Moore & Vecchio 2021; Afzal et al. 2023; Antoniadis et al. 2024a; Vagnozzi 2023; Franciolini et al. 2024; Bai et al. 2023; Megias et al. 2023; Jiang et al. 2024; Zhang et al. 2023; Figueroa et al. 2024; Bian et al. 2024; Niu & Rahat 2023; Depta et al. 2023; Abe & Tada 2023; Servant & Simakachorn 2023; Ellis et al. 2024a; Bhaumik et al. 2023; Ahmed et al. 2024; Antusch et al. 2023; Aghaie et al. 2024; Konoplya & Zhidenko 2024; Basilakos et al. 2024a,b; Ben-Dayan et al. 2023; Ahmadvand et al. 2023; Choudhury et al. 2024). These different early-Universe, high-energy cosmological sources are distinguished by their frequency spectra. On the other hand, the gravitational nature of the SGWB is perceptible through the inter-pulsar spatial correlations (Chamberlin & Siemens 2012; Qin et al. 2019, 2021; Ng 2022; Chen et al. 2021; Liu & Ng 2022; Hu et al. 2022; Bernardo & Ng 2023d). The quadrupolar shape of the HD curve is inherited from the tensorial nature of the GW polarizations seen in ground-based GW observations. In this context, the HD curve can be viewed as a reference point for testing gravity in the nanohertz GW regime, where testable HD curve deviations can be as rich as the possible sources of the signal (Liang & Trodden 2021; Bernardo & Ng 2023c,a; Wu et al. 2023; Liang et al. 2023; Bernardo & Ng 2024).
To assess the feasibility of PTA measurements to constrain gravity, we performed an exhaustive phenomenological search for non-Einsteinian GWs (Table 1) using the North American Nanohertz Observatory for Gravitational Waves (NANOGrav; Agazie et al. 2023b) and Chinese PTA (CPTA; Xu et al. 2023) inter-pulsar correlation data, based on the physical premise that the HD correlation is a byproduct of general relativity (GR); with the alternative hypothesis being that observed departures from the HD curve suggest a nanohertz deviation from GR. In doing so, we take into account the mean of the expected correlation signal of the SGWB and its cosmic variance (CV). The theoretical uncertainty due to the stochasticity of the signal is a relatively recent consideration, first proposed a year ago by Allen 2023 regarding the HD correlation (Allen 2023) and was later extended to subluminal and non-Einsteinian GWs (Bernardo & Ng 2022b). As with cosmic microwave background (CMB) measurements, the CV of PTA correlation measurements of the SGWB provides an intrinsic allowance for uncertainty at large scales, regardless of experimental precision, and plays a key role in testing gravity.
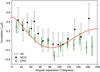 |
Fig. 1 Hellings–Downs curve. The HD curve (red line) with the NANOGrav (Agazie et al. 2023b) (black dots) and CPTA (Xu et al. 2023) (green crosses) inter-pulsar correlation samples shows compelling support for the SGWB in the galaxy. |
2 Results and discussion
Nanohertz GR deviations can originate from subluminal GW propagation and/or non-GR gravitational degrees of freedom. Subluminal GW propagation can, in turn, come from a massive graviton or from modification of the dispersion relation of GWs (Baskaran et al. 2008; Lee 2013); the latter may align better with an effective field theory point of view. This results in enhanced quadrupolar power compared to its luminal counterpart, which produces the HD correlation. (Mihaylov et al. 2020; Qin et al. 2021; Bernardo & Ng 2023d). In the same vein, non- Einsteinian GW polarizations are linked to scalar and vector gravitational degrees of freedom, which are related to alternative theories of gravity (Clifton et al. 2012; Joyce et al. 2015; Nojiri et al. 2017; Cornish et al. 2018; Kase & Tsujikawa 2019; Ferreira 2019; O’Beirne et al. 2019; Battista & De Falco 2021, 2022; Odintsov et al. 2023; Tasinato 2023). The uncertainty in GW and local constraints for such polarizations arises because nanohertz GWs propagate in dynamical galactic regions where screening mechanisms may not operate. More specifically, screening effects are typically accompanied by a quasi-static consideration (Hui et al. 2009; Wang et al. 2012; de Rham 2012; Brax et al. 2011; Ali et al. 2012; Andrews et al. 2013) that galactic long oscillatory GWs do not have to satisfy. Non-Einsteinian GW modes can be constrained through their nontrivial monopolar and dipolar correlation signals with specific values controlled by their propagation. The modeling of the non-HD correlation signals is described in more detail in Appendix A, relying on so-called harmonic analysis or a power-spectrum approach.
Our results are summarized in Table 1 and are discussed in the remainder of this paper. Each row in Table 1 corresponds to a row in Figs. 2–6, which illustrate the constrained parameter space for a fixed GW polarization and the best fit to the correlation data points. For subluminal tensor (T) and vector (V) GWs, the parameter is the GW speed, v, which is interpreted with a graviton mass. For the tensor-non-tensor GWs, an extra parameter r2 is relevant, where r is a phenomenological parameter that measures the amplitude ratio of the non-tensorial modes to the tensorial ones. In the figures, the error bars or bands show the 68% confidence limits, and the black dots and green crosses correspond to the NANOGrav and the CPTA data, respectively. The best-fit GW correlation curves are given as a red line or a red-shaded band representing the 1σ uncertainty due to the CV whenever the theoretical variance is included in the analysis. The HD curve (gray dashed) is presented in all the correlation plots for reference. In the presentation, we align with standard procedure for detecting spatial correlation in PTA data by by comparing the evidence for spatial correlation against a model with no spatial correlation. In addition, we present the Bayes factors of models with non-Einsteinian polarizations versus the Bayes factor of a model without non-Einsteinian polarization, that is, the HD curve.
We now continue our discussion based on the “Tensor” and “Vector” rows of Table 1, which refer to subluminal GWs. In this case, the gravitational distinction from the HD correlation is that the tensor GW polarizations move slower in vacuum compared to light. The constraints are presented in Fig. 2. These suggest that subluminal tensor GWs, v/c ≳ 0.4, are a viable alternative to the HD (v/c = 1) as the predominant contribution to the SGWB. This result means that the present correlation measurements allow a perfect quadrupole, Γab(ζ) ∝ cos(2ζ), to fit reasonably within the error bars. The underlying physical phenomenon here is that the GW correlation becomes more quadrupolar compared with the HD curve as GWs travel slower relative to light (Qin et al. 2021; Bernardo & Ng 2023d). It should be emphasized that the HD curve (v/c = 1) remains a perfectly viable model of the observed correlations. Our interpretation is that the results support this claim, and that the HD curve is simply a representation of a particular case where the GW is tensorial and luminal.
Figure 2 highlights that the constraints on the GW speed gradually tighten when the CV is considered in the parameter estimation (Allen 2023; Bernardo & Ng 2022b, 2023b). In addition, the results show that a joint analysis of the correlations improves the resulting constraints on gravity, in the sense that the constraints tighten when the data from both PTAs are included in the analysis. In this way, the tightest constraint v/c > 0.61 on the speed of nanohertz GWs can be derived when both the NANOGrav and CPTA correlation samples are taken into account. A lower bound to the GW speed translates to an upper bound to the graviton mass: mg ≲ 1.04 × 10⁻²² eV/c2. This shows that the HD curve (v/c = 1 or mg = 0) remains a compelling model of the observed SGWB, but that correlations due to subluminal tensor GWs (v/c < 1 or mg ≠ 0) also provide valuable information. It is worth noting that all the quadrupolar GW correlations are more prominent in the data compared with an uncorrelated process (columns 8-9 of Table 1 supports this). This is a testament to the presence of the SGWB, despite the attendant questions regarding its source and gravitational nature.
It should be pointed out that subluminal GW propagation in the nanohertz regime remains a perfectly viable astronomical and physical scenario to explain the SGWB, despite strong evidence for luminal GW propagation in the subkilohertz GW band. (de Rham & Melville 2018; Bernardo & Ng 2023a). Evidence for subluminal GW propagation can be found in the measured angular power spectrum of the SGWB (Agazie et al. 2023b). For luminal nanohertz GWs that form the HD curve, the multipolar profiles are structured in a specific pattern such that the quadrupole is followed by the octupole and so on, with specific relative contributions (Gair et al. 2014; Ng 2022). However, for subluminal GW propagation, the octupole and the higher moments become more suppressed, leading to a dominantly quadrupole corelation profile (Qin et al. 2021; Bernardo & Ng 2023d). Direct measurements of the first few power spectrum coefficients could help to distinguish between the HD and subluminal GWs in future data (Nay et al. 2024). An achievement to look forward to in PTA science are CV-precise measurements of the correlation power spectrum or the two- point function (Bernardo & Ng 2024), following in the footsteps of CMB measurements.
Tensor GWs are not unique in their ability to produce a quadrupolar spatial correlation. Vector GWs feature a dominant quadrupole and higher moments, but are mostly characterized by their nonvanishing dipolar power, distinguishing them from tensor GWs (Qin et al. 2021; Bernardo & Ng 2023d). The discussion of vector GWs, however, should be viewed from an exclusively phenomenological standpoint; for one, because there are few known astrophysical or cosmological mechanisms that would produce lone vector GWs (Wu et al. 2023; Bernardo & Ng 2023a). Vector modes are furthermore easily diluted by cosmic expansion. With that in mind, we discuss the phenomenological constraints obtained on vector GWs and the observed correlation of timing residuals of millisecond pulsars (Table 1 “Vector” subrows and Fig. 3).
Results show that vector GWs are a good phenomenological model for the observed spatial correlation for the following reasons. As opposed to the case for tensor modes, the data are able to place upper and lower bounds on the GW speed; the upper bound owing to the known divergence of the vector GW correlations in the luminal and infinite distance limit (Arzoumanian et al. 2021b; Qin et al. 2021; Bernardo & Ng 2023d). This would translate to constraints on the graviton mass should vector GWs be interpreted within the framework of massive gravity (Bernardo & Ng 2023a; Wang & Zhao 2024). The vector GW constraints echo two results that were also realized with tensor GWs: the impact of the CV and a joint analysis in narrowing down the parameter space. A subtle point is that vector GW correlations happen to have a slightly higher evidence compared with their tensor counterparts. This apparent contradiction with an earlier result using the NANOGrav 12.5 years data (Bernardo & Ng 2023a) can be attributed to the fact that the present measurements now compellingly show a quadrupolar correlation pattern that was previously hidden because of larger uncertainties.
Once again, as there are no realizable physical processes to produce vector GWs, regardless of the quality of the fit, we can only offer a phenomenological interpretation of the measured quadrupolar spatial correlation. Nevertheless, vector GWs offer a promising way to showcase the scientific value of PTA cosmology by ruling out vector GWs in future analyses.
The weak field in regions of the galaxy where nanohertz GWs are able to oscillate and superpose is crucial for the formation of the SGWB. This same characteristic is what allows the waves to interfere with one another, causing them to exhibit the expected light and dark fringes that leave observable traces in the radio signals of the galactic millisecond pulsars. As a result, it is physically possible that the HD curve and subluminal GWs can originate from lone tensor or vector modes. Likewise, the same logic allows for the possibility that the SGWB is a mixture of various gravitational components, a prospect that makes both the theory and phenomenology of the inter-pulsar correlation more exciting. Our next constraints focus on this scenario: considering the SGWB to be the result of a dominant tensor GW contribution with subdominant vector and scalar GW components.
A fair starting point for further investigation of the origin and nature of the SGWB is to recognize that the SGWB is quadrupo- lar, and therefore tensorial, and that the HD curve is a remarkable fit to the measured spatial correlation. We thus consider GW correlations produced by luminal tensor modes and subluminal vector (HD-V) or scalar (HD-ϕ) modes in the SGWB. The correlation model HD-ϕ could be realized in scalar-tensor theory with Gauss-Bonnet couplings constrained in the subkilohertz GW band (Kim et al. 2000; Kim & Lee 2001; Capuano et al. 2023). We suspect that an analogous vector-tensor theory (Aoki & Tsujikawa 2023) could form the basis of a HD-V model, that is, including luminal tensor and subluminal vector modes. In these mixed-nature SGWB scenarios, v describes the speed of the non-luminal modes and r2 is a phenomenological parameter that characterizes the fraction of non-tensorial modes in the SGWB. More specifically, as the mean and the variance of the correlation behave as two- and four-point functions of the GW amplitudes,  , respectively, it is possible to associate r with the amplitude of the non-tensorial modes relative to that of the tensorial ones (see Appendix A for details). Following the same context, we consider subluminal tensor and scalar modes with the same speed. Our resulting T-ϕ correlation model could be associated with massive gravity, where the modal speed is controlled by the graviton mass, assuming a negligible contribution from the vector modes. The constraints on these models are shown in the ‘HD-V’, ‘HD-ϕ’, and ‘T-ϕ’ rows of Table 1 and Figs. 4–6, and are discussed below.
Regarding additional vector GWs (HD-V), the correlation data sets are able to place upper bounds on the speed of vector modes and their fraction in the SGWB. In these cases, the best fits visually reproduce the mean and CV of the HD correlation when applied as shown in Fig. 4. This is realized in the constraints by the 68% confidence upper bounds to the fraction parameters of the vector GWs obtained in all of the cases. It is also interesting that when the CV is taken into account, the parameter constraints become slightly wider compared to when only lone tensor or vector GW is considered. Either way, the NANOGrav and CPTA joint analysis, which includes the CV, places an upper bound on the speed of the vector modes of v/c ≲ 0.56 and an upper bound on their fractional contribution to the SGWB of r2 < 0.28. The evidence of the HD-V correlation is lower compared with the scenarios when there are either only tensor or vector GWs in the SGWB. Nonetheless, the results suggest that more precise measurements of the interpulsar correlation due to the SGWB might be able to rule out this phenomenological model. This points out an interesting problem to be solved with future data.
Scalar modes superposing tensor modes in the SGWB highlights the need for further correlation data and the consideration of the CV (Figs. 5–6). In these cases, neither the individual PTA nor the joint analyses are able to provide constraints on the speeds of the scalar modes and tensor modes in the T-ϕ model. Furthermore, the resulting total non-tensorial amplitude shows an unconstrained dependency on whether or not the CV is considered. This is due to the dominant monopole contribution of the scalar modes, which manifests as a monopolar mean signal and a relatively wide but flat CV with respect to the mean. This consequently makes the HD-ϕ and the T-ϕ correlation models overfit NANOGrav’s measured correlations, particularly when the CV is considered. The overfitting is reflected in the pointwise significance ( ) of both models and is visually depicted by the quadrupolar belt in the second rows of Figs. 5 and 6. The quadrupolar mean is surrounded by a belt-like CV, which smoothly passes through the error bars. This can clearly be attributed to the monopolar power provided by the scalar modes (Qin et al. 2021; Bernardo & Ng 2023c,d, 2022b).
However, the tighter CPTA data, and by extension the joint analysis with the NANOGrav samples, lead to unreliable estimates of the phenomenological non-tensorial amplitude parameter. In particular, when the CPTA data are considered, the analysis returns an upper bound on the fraction of non-tensorial modes when the CV is not considered; otherwise, a lower bound is obtained when the CV is taken into account. This is contrary to the expectation that the CV should be considered and the scalar modes are subdominant to the tensor modes. In addition, no reliable information was obtained on the speeds of the subluminal scalar or tensor modes. These results merely point out the limitations of the present data and the importance of the CV for gravitational physics interpretations. This is especially true for forthcoming, more precise data sets, as illustrated by the factoring of the CPTA data in the above results.
Although constraints on non-Einsteinian GWs have already been obtained based on other observational probes, such as ground-based GW detectors (Isi & Weinstein 2017; Abbott et al. 2017, 2018), these constraints only strictly apply to a frequency band that is orders of magnitude above the cosmologically relevant nanohertz regime. Posing independent nanohertz GW constraints on such GW modes is without doubt a desirable PTA science objective that will complement the GW multiband picture.
Constraints on non-Einsteinian GW polarizations using NANOGrav (Agazie et al. 2023b) and Chinese PTA (Xu et al. 2023) data.
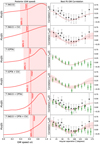 |
Fig. 2 Subluminal GWs. Left panel: constraints on the GW speed v for tensor modes using the NANOGrav (Agazie et al. 2023b) (black dots) and CPTA (Xu et al. 2023) (green crosses) correlations data. Right panel: best-fit correlation samples (red curve with 1σ bands) corresponding to the left panel. The HD curve (gray dashed line) is shown for reference. |
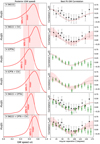 |
Fig. 3 Subluminal GWs. Left panel: constraints on the GW speed v for vector modes using the NANOGrav (Agazie et al. 2023b) (black dots) and CPTA (Xu et al. 2023) (crosses) correlations data. Right panel: best- fit correlation samples (red curve with 1σ bands) corresponding to the left panel. The HD curve (gray dashed) is shown for reference. |
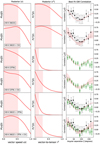 |
Fig. 4 HD-V. Constraints on the speed v (left) and vector-to-tensor fraction r2 (middle) for vector modes mixing with luminal GWs (HD) in the SGWB derived from NANOGrav (Agazie et al. 2023b) (black dots) and CPTA (Xu et al. 2023) (green crosses) correlation data. Right panel: best-fit correlation samples (red curve with 1σ bands) corresponding to the left and middle panels. The HD curve (gray dashed) is shown for reference. |
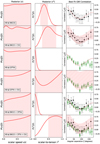 |
Fig. 5 HD-ϕ. Constraints on the (left) speed v and (middle) scalar-to- tensor fraction r2 for scalar modes mixing with luminal GWs (HD) in the SGWB using the NANOGrav (Agazie et al. 2023b) (black dots) and CPTA (Xu et al. 2023) (green crosses) correlation data. (right) Best-fit correlation samples (red curve with 1σ bands) corresponding to the left and middle panels. The HD curve (gray dashed) is shown for reference. |
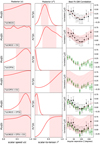 |
Fig. 6 T-ϕ. Constraints on the (left) GW speed v and (middle) scalar- to-tensor fraction r2 for scalar and tensor modes in the SGWB using the NANOGrav (Agazie et al. 2023b) (black dots) and CPTA (Xu et al. 2023) (green crosses) correlations data. (Right) Best-fit correlation samples (red curve with 1σ bands) corresponding to the left and middle panels. The HD curve (gray dashed) is shown for reference. |
3 Outlook
This paper celebrates the unwavering dedication of pulsar timing array collaborations and showcases the mostly behind- the-scenes science that led to the discovery of the stochastic gravitational wave background. The Hellings–Downs curve (Hellings & Downs 1983)– a theoretical prediction based on general relativity made about 40 years ago – remains a perfectly acceptable model of observed spatial correlations, even when set against the multitude of alternative models. This spectacular achievement can be added to the incredible scientific resume of general relativity (Taylor et al. 1979; van Straten et al. 2001; Bertotti et al. 2003; Ciufolini & Pavlis 2004; Valtonen et al. 2008; Reyes et al. 2010; Coleman Miller & Yunes 2019).
In conclusion, the profound quadrupolar correlation observed in the timing residuals of millisecond pulsars serves as unequivocal evidence of the existence of a stochastic gravitational wave background. However, understanding the nature of this correlation in a gravitational framework demands a comprehensive exploration of alternative correlation scenarios and their compatibility with data. In this context, the HD curve emerges as a crucial reference point for investigation, as supported by the Bayes factors in Table 1. Our results shed light on the tantalizing possibility that the observed inter-pulsar correlations harbor deviations from the HD curve, underscoring an intimate interplay between gravity and pulsar timing arrays.
The present work also brings to light several caveats that merit future consideration. The first among these is the reliance on published inter-pulsar correlation data points derived from different frequency bins. Our approach treats the uncertainty on the overall correlation measurement as indicative of alternative viable correlation models. While we anticipate that correlations resulting from relativistic degrees of freedom exhibit little sensitivity to frequency, further investigation into the dependencies related to both frequency and pulsar distances is needed. Considering future nanohertz gravity investigations, we propose direct measurements of the timing-residual two-point function be made with actual pulsar distances – though this would require significant computational power – or the power spectrum of the correlation. The latter avenue, facilitated by a likelihood in the power-spectrum multipoles, may allow a more natural categorization into frequency bins, thereby mitigating the principal limitation associated with angular correlations.
A related limitation due to the reliance on published spatial correlations data in Agazie et al. (2023b) and Xu et al. (2023) is that we cannot rigorously account for the fact that there are overlapping pulsars in both data sets. However, we have to wait until both data sets become public in order to assess the robustness of our joint analysis. Nonetheless, the spatial correlation is set apart from other sources of noise in PTAs by the number of pulsar pairs, which grows quadratically with the number of pulsars. This implies that the correction due to the overlapping pulsars in NG15 and CPTA is subdominant compared with the total number of pulsar pairs in the combined data set. We must content ourselves with this logic until the PTA data sets become publicly available.
The posterior shapes we find agree well with the results of other independent groups (Wang & Zhao 2024; Bi et al. 2024; Chen et al. 2024). Statistical factors, such as the size of the present data set and the model complexity, may contribute to explaining unusual posterior shapes. The results suggest that future work looking into alternative, possibly non-Gaussian likelihoods for constraining GW parameters with PTA data is merited.
Another caveat involves the assumption that cosmic variance accurately represents the theoretical uncertainty. This comes from the fact that cosmic variance can be realized only when a sufficiently large number of pulsars is observed and when the stochastic field comprising the GWB adheres precisely to a Gaussian distribution. Both of these conditions require rigorous testing. Encouragingly, the current NANOGrav data already exhibit experimental uncertainty comparable to the cosmic variance, suggesting that this trend may persist in future IPTA data. The Gaussianity hypothesis on the other hand is inherently linked to the source, such that if it were cosmological, then the stochastic field would most likely be Gaussian. But again, this hypothesis also remains to be further tested.
Acknowledgements
The authors thank Reinabelle Reyes for helpful comments on a preliminary draft. RCB is supported by an appointment to the JRG Program at the APCTP through the Science and Technology Promotion Fund and Lottery Fund of the Korean Government, and also by the Korean Local Governments in Gyeongsangbuk-do Province and Pohang City. RCB also acknowledges support from the NRF of Korea (Grant No. NRF-2022R1F1A1061590) funded by the Korean Government (MSIT). This work was supported in part by the National Science and Technology Council (NSTC) of Taiwan, Republic of China, under Grant No. MOST 112-2112-M-001-067. The authors also express special thanks to the Mainz Institute for Theoretical Physics (MITP) of the Cluster of Excellence PRISMA+ (Project ID 39083149), for its hospitality and support that enabled academic exchanges that partially reflected to the present work.
Appendix A Methods
We used the public code PTAfast (Bernardo & Ng 2022a) to generate the spatial correlation templates that we then compare with the observed inter-pulsar correlations of the NANOGrav (Agazie et al. 2023b) and the CPTA (Xu et al. 2023) collaborations.
PTAfast is based on the power spectrum approach, also often referred to as harmonic analysis, that recasts the GW stochastic correlation, γab (ζ), into a multipolar sum (Gair et al. 2014; Qin et al. 2019, 2021; Ng 2022; Bernardo & Ng 2023d; Liang et al. 2023; Nay et al. 2024):
 (A.1)
(A.1)
where the coefficients, Cl’s, are uniquely determined by the nature of the modes that enter the SGWB. In practice, the first few multipoles are referred to as the monopole (l = 0), dipole (l = 1), quadrupole (l = 2), octupole (l = 3) and quintupole (l = 4), with associated powers l(l + 1)Cl. Pictorially, depending on l, these multipoles contribute a l/2 turns in the range ζ ∈ [0, π]; monopole is flat/no turn (γab(ζ) = Constant), dipole has a half turn (γab (ζ) ∝ cos ζ), quadrupole has full turn (γab (ζ) ∝ cos(2ζ)), and so on. The cosmic variance of the stochastic signal admits a similarly simple power spectrum sum (Ng & Liu 1999; Allen 2023; Bernardo & Ng 2023c):
 (A.2)
(A.2)
This is a natural limit to precision for Gaussian fields such as the CMB.
Gravity shapes the Cl’s which are at its core a two point statistical correlation Cl ∝ ⟨rarb⟩ ∼ ⟨hahb⟩ where ri ’s are the timing residual of pulsar i induced by a passing gravitational wave hi (Bernardo & Ng 2023d, 2022b). These are put beautifully by two equations,
 (A.3)
(A.3)

where jl ( x)’s are the spherical Bessel functions, vph is the phase velocity, v is the GW speed, f is the GW frequency, D are the pulsar distances. The coefficients  and indices p, q, r are given in Table A.1, beautifully summarizing a decades’ theoretical work that went to the analysis of non-Einsteinian GW correlations.
PTAfast assumes v = vg = 1/vph which is valid whenever the massive dispersion relation, ω2 = k2 + µ2, holds in weak fields such as the tensor GWs in massive gravity and the scalar modes in Horndeski theory. Other theories can have a different relation, vg = vg(vph) , depending on their underlying dispersion relation (Liang et al. 2023).
For scalar GWs, the integration simplifies to zero for l ≥ 2 in the limit f D → ∞ (Qin et al. 2021; Bernardo & Ng 2023c). At distances characterizing the PTA millisecond pulsars, fD ∼ 𝒪 102–3 at f ∼ 𝒪(101–2) nanohertz, propagating scalars are thus distinguished by their monopole and dipole contributions. Vector GWs on the other hand are characterized by a dominant quadrupole and higher multipoles with the addition of a dipole. Tensor GWs are characterized by a quadrupole followed by suppressed higher moments. The Hellings–Downs correlation is a particular case of tensor modes in the infinite distance and luminal speed limit (Gair et al. 2014; Ng 2022),
 (A.5)
(A.5)
The correlation function γab (ζ) is normalized to the overlap reduction function GW templates, Γab(ζ), traditionally normalized with respect to the HD correlation as Γab(ζ) = 0.5γab(ζ)/γab(0)HD, so that  . These are straightforwardly calculated and returned by PTAfast.
To sample the parameter space of the correlation models, we utilize the nested sampler polychord (Handley et al. 2015a; Handley et al. 2015b) anchored in the cosmology community code Cobaya (Torrado & Lewis 2021) and analyze the statistical results using GetDist (Lewis 2019). We consider a Gaussian likelihood for the inter-pulsar correlations,
 (A.6)
(A.6)
where the correlations data are given as  . The cosmic variance are considered in the analysis as
  . The samplings are performed with flat priors for the correlation model parameters: the speed v ∈ [0, 1] and the non-tensor fraction r2 ∈ [0, 1].
For the tensor-non-tensor phenomenological correlation models (HD-V, HD-ϕ, and T-ϕ), we consider an effective overlap reduction function and cosmic variance,
 (A.7)
(A.7)

Recognizing that  are two- and four-point functions of the gravitational wave amplitude (Bernardo & Ng 2022b), the phenomenological parameter r2 could be associated with the fraction of non-tensorial modes in the superposition.
A physical way to realize this is by recognizing that the pulsar timing residual due to GW (at time t for a pulsar in the direction ê along the light of sight) can be written as a harmonic series,
 (A.9)
(A.9)
where the coefficients,
 (A.10)
embody the stochastic superposition of GWs of different frequencies f , directions k, and polarizations A (see Bernardo & Ng (2023d) for the full expression). Central to the point we wish to make is that the sum over polarizations can be broken down to
 (A.11)
where T and  stand for the tensor and non-tensorial polarization components of the GW superposition, respectively, and r is a constant manifested through non-tensorial GWs, e.g., r = 0 means that there are only tensorial GWs. Thus, provided that the SGWB is Gaussian and isotropic, i.e.,
 (A.12)
we see that in computation the two point function of the timing residuals of a pair of pulsars, 〈R (t, êa)R (t, êb)〉, the independence of power between tensorial and non-tensorial GW polarizations, manifested by the Kronecker delta,  , naturally leads to the spatial correlation (A.7) and (A.8) with the constant r appearing as the phenomenological quantity that we associated with non-tensorial modes.
Graviton masses are computed by inverting the massive dispersion relation and using the GW group speed v = dω/dk, leading to the approximate expression ![${m_{\rm{g}}} \simeq \left( {1.3105 \times {{10}^{ - 22}}{\rm{eV}}} \right) \times f\left[ {{\rm{y}}{{\rm{r}}^{ - 1}}} \right] \times \sqrt {1 - {\upsilon ^2}} $](/articles/aa/full_html/2024/11/aa49483-24/aa49483-24-eq36.png) for the nanohertz GW band.
for the nanohertz GW band.
Python notebooks and codes that were used to obtain the results of this work can be downloaded in the PTAfast repository.
References
- Abbott, B. P., Abbott, R., Abbott, T. D., et al. 2017, Phys. Rev. Lett., 119, 141101 [CrossRef] [Google Scholar]
- Abbott, B. P., Abbott, R., Abbott, T. D., et al. 2018, Phys. Rev. Lett., 120, 201102 [NASA ADS] [CrossRef] [Google Scholar]
- Abbott, R., Abbott, T. D., Acernese, F., et al. 2023, Phys. Rev. X, 13, 041039 [Google Scholar]
- Abe, K. T., & Tada, Y. 2023, Phys. Rev. D, 108, L101304 [NASA ADS] [CrossRef] [Google Scholar]
- Afzal, A., Agazie, G., Anumarlapudi, A., et al. 2023, ApJ, 951, L11 [NASA ADS] [CrossRef] [Google Scholar]
- Agazie, G., Anumarlapudi, A., Archibald, A., et al. 2023a, ApJ, 951, L50 [NASA ADS] [CrossRef] [Google Scholar]
- Agazie, G., Anumarlapudi, A., Archibald, A., et al. 2023b, ApJ, 951, L8 [NASA ADS] [CrossRef] [Google Scholar]
- Aghaie, M., Armando, G., Dondarini, A., & Panci, P. 2024, Phys. Rev. D, 109, 103030 [NASA ADS] [CrossRef] [Google Scholar]
- Ahmadvand, M., Bian, L., & Shakeri, S. 2023, Phys. Rev. D, 108, 115020 [NASA ADS] [CrossRef] [Google Scholar]
- Ahmed, W., Chowdhury, T. A., Nasri, S., & Saad, S. 2024, Phys. Rev. D, 109, 015008 [NASA ADS] [CrossRef] [Google Scholar]
- Ali, A., Gannouji, R., Hossain, M. W., & Sami, M. 2012, Phys. Lett. B, 718, 5 [NASA ADS] [CrossRef] [Google Scholar]
- Allen, B. 2023, Phys. Rev. D, 107, 043018 [NASA ADS] [CrossRef] [Google Scholar]
- Allen, B., & Romano, J. D. 2023, Phys. Rev. D, 108, 043026 [NASA ADS] [CrossRef] [Google Scholar]
- Allen, B., Dhurandhar, S., Gupta, Y., et al. 2023 arXiv e-prints [arXiv:2304.04767] [Google Scholar]
- Andrews, M., Chu, Y.-Z., & Trodden, M. 2013, Phys. Rev. D, 88, 084028 [CrossRef] [Google Scholar]
- Antoniadis, J., Arumugam, P., Arumugam, S., et al. 2023, A&A, 678, A50 [CrossRef] [EDP Sciences] [Google Scholar]
- Antoniadis, J., Arumugam, P., Arumugam, S., et al. 2024a, A&A, 685, A94 [NASA ADS] [CrossRef] [EDP Sciences] [Google Scholar]
- Antoniadis, J., Arumugam, P., Arumugam, S., et al. 2024b, A&A, 690, A118 [NASA ADS] [CrossRef] [EDP Sciences] [Google Scholar]
- Antusch, S., Hinze, K., Saad, S., & Steiner, J. 2023, Phys. Rev. D, 108, 095053 [NASA ADS] [CrossRef] [Google Scholar]
- Aoki, K., & Tsujikawa, S. 2023, Phys. Lett. B, 843, 138022 [NASA ADS] [CrossRef] [Google Scholar]
- Arzoumanian, Z., Baker, P. T., Blumer, H., et al. 2021a, Phys. Rev. Lett., 127, 251302 [NASA ADS] [CrossRef] [Google Scholar]
- Arzoumanian, Z., Baker, P. T., Blumer, H., et al. 2021b, ApJ, 923, L22 [NASA ADS] [CrossRef] [Google Scholar]
- Bai, Y., Chen, T.-K., & Korwar, M. 2023, JHEP, 12, 194 [CrossRef] [Google Scholar]
- Bailes, M., Berger, B. K., Brady, P. R., et al. 2021, Nat. Rev. Phys., 3, 344 [NASA ADS] [CrossRef] [Google Scholar]
- Basilakos, S., Nanopoulos, D. V., Papanikolaou, T., Saridakis, E. N., & Tzerefos, C. 2024a, Phys. Lett. B, 850, 138507 [NASA ADS] [CrossRef] [Google Scholar]
- Basilakos, S., Nanopoulos, D. V., Papanikolaou, T., Saridakis, E. N., & Tzerefos, C. 2024b, Phys. Lett. B, 849, 138446 [NASA ADS] [CrossRef] [Google Scholar]
- Baskaran, D., Polnarev, A. G., Pshirkov, M. S., & Postnov, K. A. 2008, Phys. Rev. D, 78, 044018 [NASA ADS] [CrossRef] [Google Scholar]
- Battista, E., & De Falco, V. 2021, Phys. Rev. D, 104, 084067 [NASA ADS] [CrossRef] [Google Scholar]
- Battista, E., & De Falco, V. 2022, Eur. Phys. J. C, 82, 628 [NASA ADS] [CrossRef] [Google Scholar]
- Ben-Dayan, I., Kumar, U., Thattarampilly, U., & Verma, A. 2023, Phys. Rev. D, 108, 103507 [NASA ADS] [CrossRef] [Google Scholar]
- Bernardo, R. C. & Ng, K.-W. 2022a, PTAfast: PTA correlations from stochastic gravitational wave background, Astrophysics Source Code Library [record ascl:2211.001] [Google Scholar]
- Bernardo, R. C., & Ng, K.-W. 2022b, JCAP, 11, 046 [CrossRef] [Google Scholar]
- Bernardo, R. C., & Ng, K.-W. 2023a, Phys. Rev. D, 107, L101502 [NASA ADS] [CrossRef] [Google Scholar]
- Bernardo, R. C., & Ng, K.-W. 2023b, JCAP, 08, 028 [CrossRef] [Google Scholar]
- Bernardo, R. C., & Ng, K.-W. 2023c, Phys. Lett. B, 841, 137939 [NASA ADS] [CrossRef] [Google Scholar]
- Bernardo, R. C., & Ng, K.-W. 2023d, Phys. Rev. D, 107, 044007 [NASA ADS] [CrossRef] [Google Scholar]
- Bernardo, R. C., & Ng, K.-W. 2024, Phys. Rev. D, 109, L101502 [NASA ADS] [CrossRef] [Google Scholar]
- Bertotti, B., Iess, L., & Tortora, P. 2003, Nature, 425, 374 [Google Scholar]
- Bhaumik, N., Jain, R. K., & Lewicki, M. 2023, Phys. Rev. D, 108, 123532 [NASA ADS] [CrossRef] [Google Scholar]
- Bi, Y.-C., Wu, Y.-M., Chen, Z.-C., & Huang, Q.-G. 2024, Phys. Rev. D, 109, L061101 [NASA ADS] [CrossRef] [Google Scholar]
- Bian, L., Ge, S., Shu, J., et al. 2024, Phys. Rev. D, 109, L101301 [NASA ADS] [CrossRef] [Google Scholar]
- Brax, P., Burrage, C., & Davis, A.-C. 2011, JCAP, 09, 020 [CrossRef] [Google Scholar]
- Burke-Spolaor, S., Taylor, S. R., Charisi, M., et al. 2019, A&AR, 27, 5 [NASA ADS] [CrossRef] [Google Scholar]
- Cannizzaro, E., Franciolini, G., & Pani, P. 2024, JCAP, 04, 056 [CrossRef] [Google Scholar]
- Capuano, L., Santoni, L., & Barausse, E. 2023, Phys. Rev. D, 108, 064058 [NASA ADS] [CrossRef] [Google Scholar]
- Chamberlin, S. J., & Siemens, X. 2012, Phys. Rev. D, 85, 082001 [NASA ADS] [CrossRef] [Google Scholar]
- Chen, Z.-C., Yuan, C., & Huang, Q.-G. 2020, Phys. Rev. Lett., 124, 251101 [NASA ADS] [CrossRef] [Google Scholar]
- Chen, Z.-C., Yuan, C., & Huang, Q.-G. 2021, Sci. China Phys. Mech. Astron., 64, 120412 [NASA ADS] [CrossRef] [Google Scholar]
- Chen, Z.-C., Li, J., Liu, L., & Yi, Z. 2024, Phys. Rev. D, 109, L101302 [NASA ADS] [CrossRef] [Google Scholar]
- Choudhury, S., Karde, A., Panda, S., & Sami, M. 2024, Nucl. Phys. B, 1007, 116678 [NASA ADS] [CrossRef] [Google Scholar]
- Ciufolini, I., & Pavlis, E. C. 2004, Nature, 431, 958 [NASA ADS] [CrossRef] [Google Scholar]
- Clifton, T., Ferreira, P. G., Padilla, A., & Skordis, C. 2012, Phys. Rept., 513, 1 [NASA ADS] [CrossRef] [Google Scholar]
- Coleman Miller, M., & Yunes, N. 2019, Nature, 568, 469 [NASA ADS] [CrossRef] [Google Scholar]
- Cornish, N. J., O’Beirne, L., Taylor, S. R., & Yunes, N. 2018, Phys. Rev. Lett., 120, 181101 [NASA ADS] [CrossRef] [Google Scholar]
- Dai, L., Kamionkowski, M., & Jeong, D. 2012, Phys. Rev. D, 86, 125013 [NASA ADS] [CrossRef] [Google Scholar]
- Depta, P. F., Schmidt-Hoberg, K., Schwaller, P., & Tasillo, C. 2023, arXiv eprints [arXiv:2306.17836] [Google Scholar]
- de Rham, C. 2012, Comptes Rend. Phys., 13, 666 [NASA ADS] [CrossRef] [Google Scholar]
- de Rham, C., & Melville, S. 2018, Phys. Rev. Lett., 121, 221101 [NASA ADS] [CrossRef] [Google Scholar]
- Detweiler, S. L. 1979, ApJ, 234, 1100 [NASA ADS] [CrossRef] [Google Scholar]
- Ellis, J., Fairbairn, M., Franciolini, G., et al. 2024a, Phys. Rev. D, 109, 023522 [NASA ADS] [CrossRef] [Google Scholar]
- Ellis, J., Fairbairn, M., Hütsi, G., et al. 2024b, Phys. Rev. D, 109, L021302 [NASA ADS] [CrossRef] [Google Scholar]
- Ferreira, P. G. 2019, ARA&A, 57, 335 [Google Scholar]
- Figueroa, D. G., Pieroni, M., Ricciardone, A., & Simakachorn, P. 2024, Phys. Rev. Lett., 132, 171002 [NASA ADS] [CrossRef] [Google Scholar]
- Franciolini, G., Racco, D., & Rompineve, F. 2024, Phys. Rev. Lett., 132, 081001 [NASA ADS] [CrossRef] [Google Scholar]
- Gair, J., Romano, J. D., Taylor, S., & Mingarelli, C. M. F. 2014, Phys. Rev. D, 90, 082001 [NASA ADS] [CrossRef] [Google Scholar]
- Handley, W. J., Hobson, M. P., & Lasenby, A. N. 2015a, MNRAS, 450, L61 [NASA ADS] [CrossRef] [Google Scholar]
- Handley, W. J., Hobson, M. P., & Lasenby, A. N. 2015b, MNRAS, 453, 4384 [Google Scholar]
- Hellings, R. W., & Downs, G. W. 1983, ApJ, 265, L39 [NASA ADS] [CrossRef] [Google Scholar]
- Hobbs, G., Archibald, A., Arzoumanian, Z., et al. 2010, Class. Quant. Grav., 27, 084013 [NASA ADS] [CrossRef] [Google Scholar]
- Hu, Y., Wang, P.-P., Tan, Y.-J., & Shao, C.-G. 2022, Phys. Rev. D, 106, 024005 [NASA ADS] [CrossRef] [Google Scholar]
- Hui, L., Nicolis, A., & Stubbs, C. 2009, Phys. Rev. D, 80, 104002 [NASA ADS] [CrossRef] [Google Scholar]
- Isi, M., & Weinstein, A. J. 2017 arXiv e-prints [arXiv:1710.03794] [Google Scholar]
- Jaffe, A. H., & Backer, D. C. 2003, ApJ, 583, 616 [NASA ADS] [CrossRef] [Google Scholar]
- Jenet, F. A., & Romano, J. D. 2015, Am. J. Phys., 83, 635 [NASA ADS] [CrossRef] [Google Scholar]
- Jiang, J.-Q., Cai, Y., Ye, G., & Piao, Y.-S. 2024, JCAP, 05, 004 [NASA ADS] [CrossRef] [Google Scholar]
- Joyce, A., Jain, B., Khoury, J., & Trodden, M. 2015, Phys. Rept., 568, 1 [NASA ADS] [CrossRef] [Google Scholar]
- Kase, R., & Tsujikawa, S. 2019, Int. J. Mod. Phys. D, 28, 1942005 [NASA ADS] [CrossRef] [Google Scholar]
- Kim, J. E., & Lee, H. M. 2001, Nucl. Phys. B, 602, 346 [NASA ADS] [CrossRef] [Google Scholar]
- Kim, J. E., Kyae, B., & Lee, H. M. 2000, Phys. Rev. D, 62, 045013 [NASA ADS] [CrossRef] [Google Scholar]
- Konoplya, R. A., & Zhidenko, A. 2024, Phys. Lett. B, 853, 138685 [NASA ADS] [CrossRef] [Google Scholar]
- Lambiase, G., Mastrototaro, L., & Visinelli, L. 2023, Phys. Rev. D, 108, 123028 [NASA ADS] [CrossRef] [Google Scholar]
- Lasky, P. D., Mingarelli, C. M. F., Smith, T. L., et al. 2016, Phys. Rev. X, 6, 011035 [NASA ADS] [Google Scholar]
- Lee, K. J. 2013, Class. Quant. Grav., 30, 224016 [NASA ADS] [CrossRef] [Google Scholar]
- Lee, K., Jenet, F. A., Price, R. H., Wex, N., & Kramer, M. 2010, ApJ, 722, 1589 [NASA ADS] [CrossRef] [Google Scholar]
- Lee, K. J., Wex, N., Kramer, M., et al. 2011, MNRAS, 414, 3251 [CrossRef] [Google Scholar]
- Lewis, A. 2019, arXiv e-prints [arXiv:1910.13970] [Google Scholar]
- Liang, Q., & Trodden, M. 2021, Phys. Rev. D, 104, 084052 [NASA ADS] [CrossRef] [Google Scholar]
- Liang, Q., Lin, M.-X., & Trodden, M. 2023, JCAP, 11, 042 [CrossRef] [Google Scholar]
- Liu, T., & Vigeland, S. J. 2021, ApJ, 921, 178 [NASA ADS] [CrossRef] [Google Scholar]
- Liu, G.-C., & Ng, K.-W. 2022, Phys. Rev. D, 106, 064004 [NASA ADS] [CrossRef] [Google Scholar]
- Lommen, A. N. 2015, Rept. Prog. Phys., 78, 124901 [NASA ADS] [CrossRef] [Google Scholar]
- Megias, E., Nardini, G., & Quiros, M. 2023, Phys. Rev. D, 108, 095017 [NASA ADS] [CrossRef] [Google Scholar]
- Mihaylov, D. P., Moore, C. J., Gair, J., Lasenby, A., & Gilmore, G. 2020, Phys. Rev. D, 101, 024038 [NASA ADS] [CrossRef] [Google Scholar]
- Mingarelli, C. M. F., Lazio, T. J. W., Sesana, A., et al. 2017, Nature Astron., 1, 886 [NASA ADS] [CrossRef] [Google Scholar]
- Moore, C. J., & Vecchio, A. 2021, Nature Astron., 5, 1268 [NASA ADS] [CrossRef] [Google Scholar]
- Nay, J., Boddy, K. K., Smith, T. L., & Mingarelli, C. M. F. 2024, Phys. Rev. D, 110, 044062 [NASA ADS] [CrossRef] [Google Scholar]
- Ng, K.-W. 2022, Phys. Rev. D, 106, 043505 [NASA ADS] [CrossRef] [Google Scholar]
- Ng, K.-W., & Liu, G.-C. 1999, Int. J. Mod. Phys. D, 8, 61 [CrossRef] [Google Scholar]
- Niu, X., & Rahat, M. H. 2023, Phys. Rev. D, 108, 115023 [NASA ADS] [CrossRef] [Google Scholar]
- Nojiri, S., Odintsov, S. D., & Oikonomou, V. K. 2017, Phys. Rept., 692, 1 [NASA ADS] [CrossRef] [Google Scholar]
- O’Beirne, L., Cornish, N. J., Vigeland, S. J., & Taylor, S. R. 2019, Phys. Rev. D, 99, 124039 [CrossRef] [Google Scholar]
- Odintsov, S. D., Oikonomou, V. K., Giannakoudi, I., Fronimos, F. P., & Lymperiadou, E. C. 2023, Symmetry, 15, 1701 [NASA ADS] [CrossRef] [Google Scholar]
- Phinney, E. S. 2001, arXiv e-prints [arXiv:astro-ph/0108028] [Google Scholar]
- Pol, N. S., Taylor, S. R., Kelley, L. Z., et al. 2021, ApJ, 911, L34 [NASA ADS] [CrossRef] [Google Scholar]
- Pol, N., Taylor, S. R., & Romano, J. D. 2022, ApJ, 940, 173 [NASA ADS] [CrossRef] [Google Scholar]
- Qin, W., Boddy, K. K., Kamionkowski, M., & Dai, L. 2019, Phys. Rev. D, 99, 063002 [CrossRef] [Google Scholar]
- Qin, W., Boddy, K. K., & Kamionkowski, M. 2021, Phys. Rev. D, 103, 024045 [NASA ADS] [CrossRef] [Google Scholar]
- Rajagopal, M., & Romani, R. W. 1995, ApJ, 446, 543 [NASA ADS] [CrossRef] [Google Scholar]
- Ravi, V., Wyithe, J. S. B., Shannon, R. M., & Hobbs, G. 2015, MNRAS, 447, 2772 [NASA ADS] [CrossRef] [Google Scholar]
- Reardon, D. J., Zic, A., Shannon, M., et al. 2023, ApJ, 951, L6 [NASA ADS] [CrossRef] [Google Scholar]
- Reyes, R., Mandelbaum, R., Seljak, U., et al. 2010, Nature, 464, 256 [Google Scholar]
- Romano, J. D., & Allen, B. 2024, Class. Quant. Grav., 41, 175008 [NASA ADS] [CrossRef] [Google Scholar]
- Romano, J. D., & Cornish, N. J. 2017, Living Rev. Rel., 20, 2 [NASA ADS] [CrossRef] [Google Scholar]
- Servant, G., & Simakachorn, P. 2023, Phys. Rev. D, 108, 123516 [NASA ADS] [CrossRef] [Google Scholar]
- Sesana, A., Vecchio, A., & Colacino, C. N. 2008, MNRAS, 390, 192 [NASA ADS] [CrossRef] [Google Scholar]
- Shannon, R. M., Ravi, V., Lentati, L. T., et al. 2015, Science, 349, 1522 [NASA ADS] [CrossRef] [Google Scholar]
- Tasinato, G. 2023, Phys. Rev. D, 108, 103521 [NASA ADS] [CrossRef] [Google Scholar]
- Taylor, S. R. 2021 arXiv e-prints [arXiv:2105.13270] [Google Scholar]
- Taylor, J. H., Fowler, L. A., & McCulloch, P. M. 1979, Nature, 277, 437 [NASA ADS] [CrossRef] [Google Scholar]
- Torrado, J., & Lewis, A. 2021, JCAP, 05, 057 [Google Scholar]
- Vagnozzi, S. 2021, MNRAS, 502, L11 [NASA ADS] [CrossRef] [Google Scholar]
- Vagnozzi, S. 2023, JHEAp, 39, 81 [NASA ADS] [Google Scholar]
- Valtonen, M. J., Lehto, H. J., Nilsson, K., et al. 2008, Nature, 452, 851 [Google Scholar]
- van Straten, W., Bailes, M., Britton, M. C., et al. 2001, Nature, 412, 158 [NASA ADS] [CrossRef] [Google Scholar]
- Vigeland, S. J., & Vallisneri, M. 2014, MNRAS, 440, 1446 [NASA ADS] [CrossRef] [Google Scholar]
- Wang, S., & Zhao, Z.-C. 2024, Phys. Rev. D, 109, L061502 [NASA ADS] [CrossRef] [Google Scholar]
- Wang, J., Hui, L., & Khoury, J. 2012, Phys. Rev. Lett., 109, 241301 [CrossRef] [Google Scholar]
- Wu, Y.-M., Chen, Z.-C., & Huang, Q.-G. 2023, Phys. Rev. D, 107, 042003 [NASA ADS] [CrossRef] [Google Scholar]
- Xue, X., Bian, L., Shu, J., et al. 2021, Phys. Rev. Lett., 127, 251303 [NASA ADS] [CrossRef] [Google Scholar]
- Xu, H., Chen, S., Guo, Y., et al. 2023, RA&A, 23, 075024 [Google Scholar]
- Yunes, N., & Siemens, X. 2013, Living Rev. Rel., 16, 9 [NASA ADS] [CrossRef] [Google Scholar]
- Zhang, Z., Cai, C., Su, Y.-H., et al. 2023, Phys. Rev. D, 108, 095037 [CrossRef] [Google Scholar]
All Tables
Constraints on non-Einsteinian GW polarizations using NANOGrav (Agazie et al. 2023b) and Chinese PTA (Xu et al. 2023) data.
All Figures
|
Fig. 1 Hellings–Downs curve. The HD curve (red line) with the NANOGrav (Agazie et al. 2023b) (black dots) and CPTA (Xu et al. 2023) (green crosses) inter-pulsar correlation samples shows compelling support for the SGWB in the galaxy. |
| In the text | |
|
Fig. 2 Subluminal GWs. Left panel: constraints on the GW speed v for tensor modes using the NANOGrav (Agazie et al. 2023b) (black dots) and CPTA (Xu et al. 2023) (green crosses) correlations data. Right panel: best-fit correlation samples (red curve with 1σ bands) corresponding to the left panel. The HD curve (gray dashed line) is shown for reference. |
| In the text | |
|
Fig. 3 Subluminal GWs. Left panel: constraints on the GW speed v for vector modes using the NANOGrav (Agazie et al. 2023b) (black dots) and CPTA (Xu et al. 2023) (crosses) correlations data. Right panel: best- fit correlation samples (red curve with 1σ bands) corresponding to the left panel. The HD curve (gray dashed) is shown for reference. |
| In the text | |
|
Fig. 4 HD-V. Constraints on the speed v (left) and vector-to-tensor fraction r2 (middle) for vector modes mixing with luminal GWs (HD) in the SGWB derived from NANOGrav (Agazie et al. 2023b) (black dots) and CPTA (Xu et al. 2023) (green crosses) correlation data. Right panel: best-fit correlation samples (red curve with 1σ bands) corresponding to the left and middle panels. The HD curve (gray dashed) is shown for reference. |
| In the text | |
|
Fig. 5 HD-ϕ. Constraints on the (left) speed v and (middle) scalar-to- tensor fraction r2 for scalar modes mixing with luminal GWs (HD) in the SGWB using the NANOGrav (Agazie et al. 2023b) (black dots) and CPTA (Xu et al. 2023) (green crosses) correlation data. (right) Best-fit correlation samples (red curve with 1σ bands) corresponding to the left and middle panels. The HD curve (gray dashed) is shown for reference. |
| In the text | |
|
Fig. 6 T-ϕ. Constraints on the (left) GW speed v and (middle) scalar- to-tensor fraction r2 for scalar and tensor modes in the SGWB using the NANOGrav (Agazie et al. 2023b) (black dots) and CPTA (Xu et al. 2023) (green crosses) correlations data. (Right) Best-fit correlation samples (red curve with 1σ bands) corresponding to the left and middle panels. The HD curve (gray dashed) is shown for reference. |
| In the text | |
Current usage metrics show cumulative count of Article Views (full-text article views including HTML views, PDF and ePub downloads, according to the available data) and Abstracts Views on Vision4Press platform.
Data correspond to usage on the plateform after 2015. The current usage metrics is available 48-96 hours after online publication and is updated daily on week days.
Initial download of the metrics may take a while.