Open Access
Fig. 1
Download original image
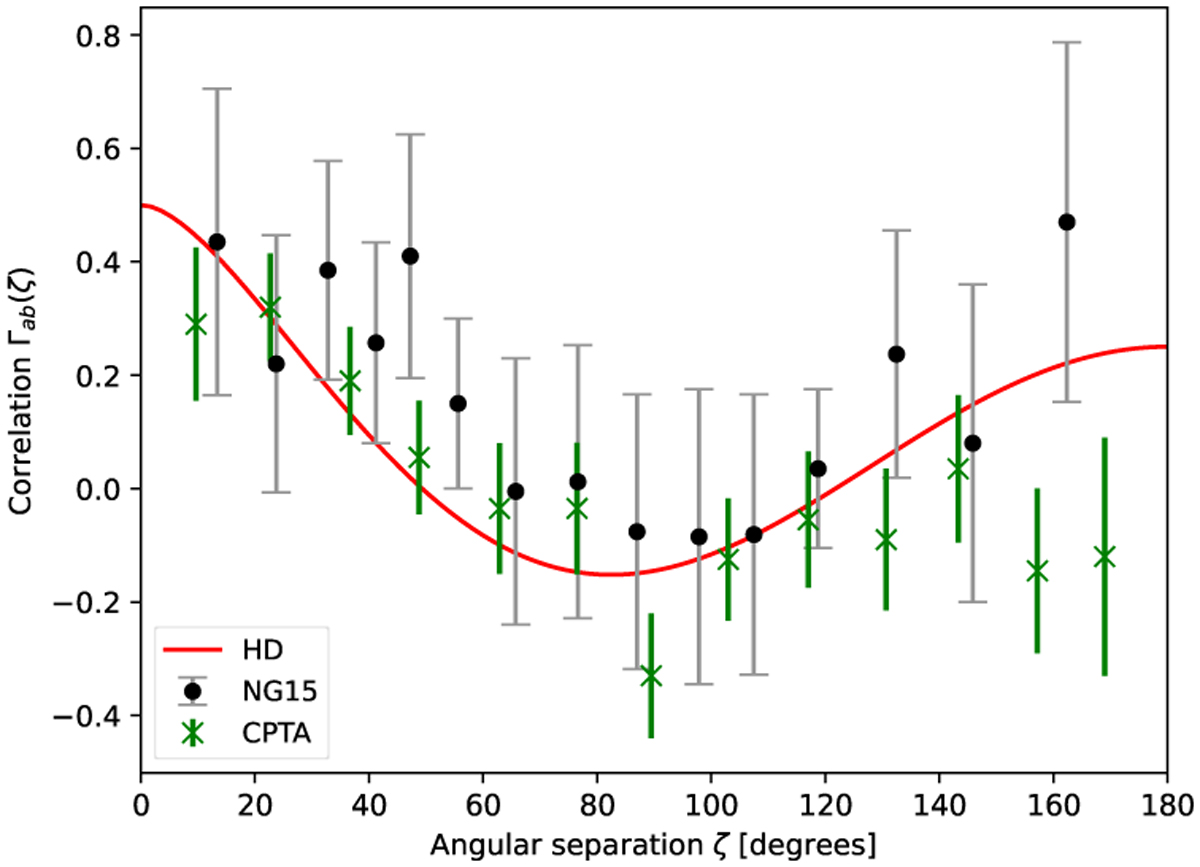
Hellings–Downs curve. The HD curve (red line) with the NANOGrav (Agazie et al. 2023b) (black dots) and CPTA (Xu et al. 2023) (green crosses) inter-pulsar correlation samples shows compelling support for the SGWB in the galaxy.
Current usage metrics show cumulative count of Article Views (full-text article views including HTML views, PDF and ePub downloads, according to the available data) and Abstracts Views on Vision4Press platform.
Data correspond to usage on the plateform after 2015. The current usage metrics is available 48-96 hours after online publication and is updated daily on week days.
Initial download of the metrics may take a while.