Fig. 6
Download original image
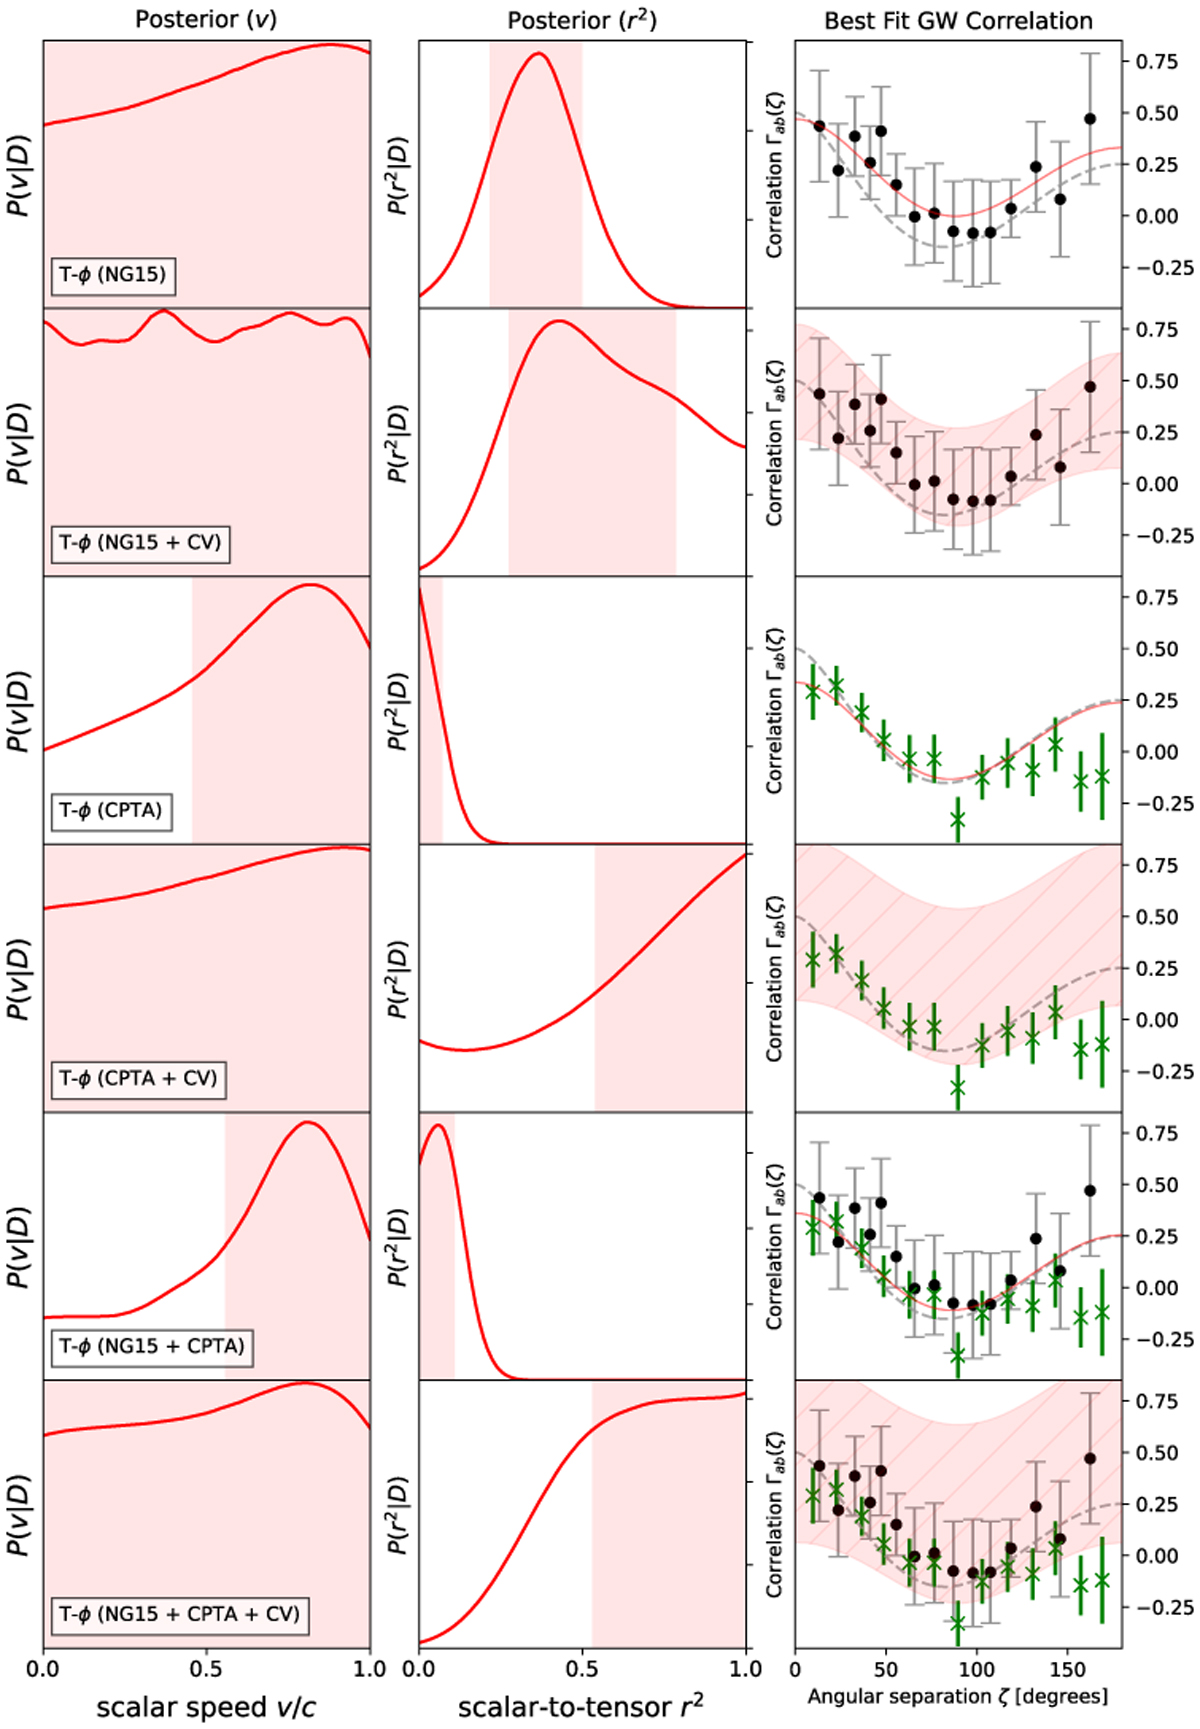
T-ϕ. Constraints on the (left) GW speed v and (middle) scalar- to-tensor fraction r2 for scalar and tensor modes in the SGWB using the NANOGrav (Agazie et al. 2023b) (black dots) and CPTA (Xu et al. 2023) (green crosses) correlations data. (Right) Best-fit correlation samples (red curve with 1σ bands) corresponding to the left and middle panels. The HD curve (gray dashed) is shown for reference.
Current usage metrics show cumulative count of Article Views (full-text article views including HTML views, PDF and ePub downloads, according to the available data) and Abstracts Views on Vision4Press platform.
Data correspond to usage on the plateform after 2015. The current usage metrics is available 48-96 hours after online publication and is updated daily on week days.
Initial download of the metrics may take a while.