| Issue |
A&A
Volume 688, August 2024
|
|
|---|---|---|
| Article Number | A130 | |
| Number of page(s) | 12 | |
| Section | Extragalactic astronomy | |
| DOI | https://doi.org/10.1051/0004-6361/202348779 | |
| Published online | 13 August 2024 | |
Multi-transition study of methanol towards NGC 1068 with ALMA
1
Leiden Observatory, Leiden University, PO Box 9513 2300 RA Leiden, The Netherlands
e-mail: kyhuang@strw.leidenuniv.nl
2
Observatorio Astronómico Nacional (OAN-IGN)-Observatorio de Madrid, Alfonso XII, 3, 28014 Madrid, Spain
Received:
29
November
2023
Accepted:
11
April
2024
Context. The outflowing molecular gas in the circumnuclear disc (CND) of the nearby (D = 14 Mpc) AGN-starburst composite galaxy NGC 1068 is considered as a manifestation of ongoing AGN feedback. The large spread of velocities from the outflowing gas is likely driving various kinds of shock chemistry across the CND.
Aims. We performed a multiline molecular study using CH3OH with the aim of characterizing the gas properties probed by CH3OH in the CND of NGC 1068 and investigating its potential association with molecular shocks.
Methods. Multi-transition CH3OH were imaged at the resolution of 0.″5 − 0.″8 with the Atacama Large Millimeter/submillimeter Array (ALMA). We performed a non-LTE radiative transfer analysis coupled with a Bayesian inference process in order to determine the gas properties such as the gas volume density and the gas kinetic temperature.
Results. The gas densities traced by CH3OH point to ∼106 cm–3 across all the CND regions. The gas kinetic temperature cannot be well constrained in any of the CND regions, though the inferred temperature is likely low (≲100 K).
Conclusions. The low gas temperature traced by CH3OH suggests shocks and subsequent fast cooling as the origin of the observed gas-phase CH3OH abundance. We also note that the E-/A-isomer column-density ratio inferred is fairly close to unity, which is, interestingly, different from the Galactic measurements in the literature. It remains inconclusive whether CH3OH exclusively traces slow and non-dissociative shocks, or whether the CH3OH abundance can actually be boosted in both fast and slow shocks.
Key words: ISM: molecules / galaxies: ISM / galaxies: nuclei / quasars: individual: NGC 1068
© The Authors 2024
 Open Access article, published by EDP Sciences, under the terms of the Creative Commons Attribution License (https://creativecommons.org/licenses/by/4.0), which permits unrestricted use, distribution, and reproduction in any medium, provided the original work is properly cited.
This article is published in open access under the Subscribe to Open model. Subscribe to A&A to support open access publication.
1. Introduction
Feedback from active galactic nuclei (AGNs) and star formation activities are both important agents in influencing the interstellar medium (ISM) and the evolution of galaxies. Shocks and turbulence can be associated with star formation activities due to protostellar outflows and supernova explosions that affect both chemistry and kinematics in the ISM. These energetics also act as heating sources (mechanical heating) aside from the ionization via X-ray and cosmic rays. On the other hand, AGNs are often considered to be X-ray-dominated regions (XDRs) and are often thought to have an enhanced cosmic-ray ionization rate (CRIR) and radiation field (e.g., Meijerink & Spaans 2005; Viti et al. 2014). While converting gravitational potential energy and kinetic energy into radiation, AGNs can also trigger jets and the associated multiphase mass outflows that inject energy into the ISM. It is therefore important to build an understanding of the interplay between these two feedback mechanisms. In this context, AGN-starburst composite galaxies serve as prime sources to study feedback from both AGNs and star formation.
The galaxy NGC 1068 is a nearby (D = 14 Mpc Bland-Hawthorn et al. 1997, 1″ ∼ 70 pc) Seyfert 2 galaxy and is considered to be the archetype of a composite AGN-starburst system. The proximity of this composite galaxy makes it an ideal laboratory for resolving the feedback from the starburst regions in its spiral arms that are spatially distinct from the AGN activity at the galactic center. A spatially unresolved molecular line survey by Aladro et al. (2013) found this AGN-host galaxy to be chemically distinct from pure starburst galaxies. The AGN is obscured by a molecular torus (García-Burillo et al. 2014). Surrounding the torus is an elliptical region that is largely devoid of molecular gas, while this region is also characterized by strong emission from ionized gas in a biconal outflow driven by the AGN. Streams of gas seem to pass through this region, connecting the torus to the rest of the circumnuclear disk (CND). The fueling of the AGN seems to be thwarted on an intermediate scale (r < 50 pc) due to the outflowing nature of the CND and the torus-CND connections shown on comparable scales.
The CND extends to r ∼ 200 pc, and its different regions show significantly distinct chemistry, in a manner that appears to match the spatial extent of the influence of UV and X-ray irradiation from the nucleus (García-Burillo et al. 2014). All tracers observed by García-Burillo et al. (2014) indicate a massive outflow from r ∼ 50 pc out to ∼400 pc. This massive molecular outflow is likely launched by the interaction between the molecular gas in the CND and both the AGN ionized wind and the radio-jet plasma, and is hence viewed as a sign of ongoing AGN feedback (García-Burillo et al. 2014, 2019). This interaction has produced large-scale molecular shocks and the associated rich shock chemistry at different locations in the CND (Viti et al. 2014). Viti et al. (2014) found that models for the chemically distinct subregions of the CND each require a three-phase interstellar medium. One component is indeed shocked gas, while the other two regions have enhanced CRIR (and/or X-ray activities) by a least a factor of ten. This illustrates the complexity of the region. Scourfield et al. (2020) reported that the temperature and the CRIR in the CND increase from east to west from observations of CS and subsequent modeling. Shocks in the CND of NGC 1068 were also studied with both observations and chemical modeling of HNCO and SiO (Kelly et al. 2017; Huang et al. 2022; Huang & Viti 2023), which are typically used as tracers of slow and fast shocks, respectively.
Gas-phase methanol (CH3OH) is commonly seen in the ISM, both in Galactic and extragalactic environments, and it has been proposed as one of the shock tracer candidates. As the simplest complex organic molecule (COM), CH3OH, can be formed efficiently in cold environments (12–20 K) through repeated hydrogenation of CO on ice grains (Fuchs et al. 2009) and through the recently proposed mechanism, that is, a H-abstraction reaction of radicals on ice grains (Álvarez-Barcia et al. 2018; Simons et al. 2020; Santos et al. 2022). A scheme for gas-phase formation has also been proposed, yet it remains incapable of accounting for the observed interstellar gas-phase CH3OH (Garrod et al. 2006; Geppert et al. 2006). The CH3OH formed on ice grains can then be released back to the gas phase via thermal sublimation or nonthermal desorption processes. Among these processes, shocks can effectively liberate the solid-state CH3OH into the gas phase through sublimation and sputtering. CH3OH could, however, be destroyed in the presence of dissociative J shocks or fast shocks, as suggested in the observational work by Suutarinen et al. (2014). On the other hand, the chemical modeling work by Holdship et al. (2017) has shown that non-dissociative high-velocity C shocks (e.g., with shock velocity > 45 km s−1) can still elevate the gas-phase CH3OH to levels comparable to those achieved by the slow C shocks (e.g., with shock velocity < 20 km s−1).
CH3OH has two spin isomers1, referred to as E- and A-CH3OH, owing to the combinations of nuclear spin alignment in the three H-atoms of the methyl (CH3) group. In A-type CH3OH, the nuclear spins of the three protons in the methyl group are parallel. For E-type CH3OH, one of the protons in the methyl group has an anti-parallel nuclear spin with respect to the others. Observationally, the two spin isomers of CH3OH have different spectroscopic properties including transition frequencies.
CH3OH has been detected in multiple studies of the CND and the starburst ring (SB ring) of NGC 1068 at low resolution (> 80 pc; Aladro et al. 2013; Takano et al. 2014; Nakajima et al. 2015). In these results, however, only the CH3OH JK = 2K − 1K transition has been detected. Observations of CH3OH transitions covering a range of excitation energies will be critical in quantitatively characterize the gas properties traced by CH3OH.
In the current work, we present high resolution (∼50 pc scale) ALMA observations of the CND of NGC 1068 for six “clusters” of CH3OH transitions with emission from both A- and E-CH3OH. This high spatial resolution provides physical scales comparable to giant molecular clouds (GMCs). We analyzed these observations with non-local-thermodynamic-equilibrium (non-LTE) radiative transfer modeling. The goal is to quantitatively characterize the gas properties in order to gain insights into its association with the local shock history in the CND of NGC 1068. These observations can help better constrain the properties of the gas in the typical environments where COMs are expected to be found and also explore the potential of using CH3OH as a shock tracer. The paper is structured as follows. In Sect. 2, we describe the observations and the data-reduction process. In Sect. 3, we present the molecular line intensity maps and the extracted velocity-integrated line intensities. In Sect. 4, we perform a non-LTE radiative transfer analysis in order to constrain the physical conditions of the gas. We discuss the potential association between the gas properties traced by CH3OH and the presence of shocks. We also briefly discuss the E-/A-isomer ratio that is measured in this extragalactic source and the potential indication of the CH3OH formation environment. We briefly summarize our findings in Sect. 5.
2. Observations and data reduction
The CH3OH transitions investigated in this paper were observed toward NGC 1068 using ALMA. These data were obtained during cycle 6 (project-ID: 2018.1.01506.S) with band-3 and band-4 receivers, and cycle 3 (project-ID: 2015.1.01144.S) using band-7 receivers. The field of view (F.O.V.) is 56″ for band-3 data, 42″ for band-4 data, and 19″ for band-7 data, respectively, which are all larger than the span of the CND (∼5″). In the band-3 and band-4 observations, J0238+1636 was used as bandpass calibrator, and J0239−0234 was used as phase calibrator. In the band-7 observation, J0238+1636 was used as bandpass calibrator, and J0217+0144 as phase calibrator. The above-mentioned data were calibrated and imaged using the ALMA reduction package CASA2 (McMullin et al. 2007).
The rest frequencies were defined using the systemic velocity determined by García-Burillo et al. (2019), as vsys(LSR) = 1120 km s−1 (radio convention). The relative velocities throughout the paper refer to this vsys. The phase-tracking center was set to α2000 = (02h42m40.771s), δ2000 = (−00°00′47.84″). The relevant information concerning each observation is listed in Table 1. This table includes the target molecular transitions, the associated spectroscopic data, and the synthesized beam size for each observation. The beam sizes of our observations range from  , or 35–56 pc on physical scales. This is comparable to the typical scale of giant molecular clouds (GMCs). The spectral resolution of the data cubes lies between 4 and 6 km s−1.
CH3OH transitions used in this study, ordered by rest frequencies.
3. Molecular-line emission
3.1. Molecular-line spectra and line blending between E and A isomers
In order to investigate the physical structure traced by CH3OH and to compare it with the shock study using SiO and HNCO observations at the same resolution by Huang et al. (2022), we followed their CND region selection: two regions (R1, R2) in the east of the CND, two regions (R3, R4) in the west of the CND. Each region encompasses a beam size of  to match the lowest angular resolution among our data and those from Huang et al. (2022). Table 2 lists these four selected positions within NGC 1068 with their coordinates, which are the center of the individual
  apertures. Figure 1 shows the sample spectra from the position CND-R1 (see Table 2) for all transitions used in this study in units of [K]. We use spectra from CND-R1 as a representative sample as CND-R1 is the brightest spot in the CND in all transitions in the current work. All the [mJy beam−1] to [K] conversion factors are listed in Table 1.
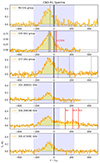 |
Fig. 1. Spectra of all CH3OH transitions used in current study. Each panel presents spectral data from the |

Coordinates (RA and Dec) of the four selected regions within the CND.
Figure 1 also demonstrates the unavoidable line blending between A- and E-CH3OH transitions in the line spectra (top three panels). The line width of CH3OH is at least 50 km s−1 – based on the clean isolated CH3OH 1−1 − 10 line at 303.366921 GHz – and as the nearest line to that is only a few kilometers per second away (e.g., top 3 panels of spectra) we cannot disentangle one from another by individual component fitting. Given that the intensity contribution from each transition within the same blended group is a function of the spectroscopic properties of the group as well as the gas excitation conditions, generally one cannot assume the transition with lowest Eu to dominate the emission. We revisit this in Sect. 4.
3.2. Moment-0 maps
The moment-0 maps present the spatial distribution of line intensities integrated over velocity for each transition group as listed in Table 1. All the moment-0 maps are subsequently smoothed to a common resolution of  and applied with a 3.0σ threshold clipping (Fig. 2). The velocity span, over which the line fluxes were integrated, was set to include significant emission arising from velocity structures such as rotation and outflow motion in NGC 1068. In this work, we used
  km s−1 to cover such a velocity span. The only exception is for the A-CH3OH JK = 2−1 − 20 line, which has an SO J = 78 − 67 line nearby, and the velocity integration was performed in a narrower range (–130 to 64 km s−1) so as not to exceed the midpoint between the target CH3OH line and the SO line. In the case of the CH3OH line cluster at ∼145 GHz, given the unavoidable blending with c-C3H2, we use an existing estimate of the contribution of this particular c-C3H2 transition and the associated uncertainty based on observations towards another nearby galaxy, NGC 253 (Martín et al. 2021), as an estimate for NGC 1068. While we note that NGC 253 (a starburst) is very different from NGC 1068 (an AGN dominated galaxy), NGC 253 is the only galaxy where a quantitative estimate of the contribution from the c-C3H2 J = 31, 2 − 22, 1 transition to the methanol cluster has been performed. This estimate is derived from multi-transitional line fitting using data from ALMA band 3 to band 7 and the line-fitting program MADCUBA (Martín et al. 2021). Table 3 lists all the measured velocity-integrated line intensities (in K km s−1) from the observations with common resolution of
  .
.
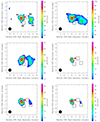 |
Fig. 2. Moment-0 maps of all CH3OH transitions used in current study. Top left: 96 GHz group. Top right: 145 GHz group. Middle left: 157 GHz group. Middle right: 303 GHz transition. Bottom left: 304 GHz transition. Bottom right: 305 GHz transition. The red cross on the map marks the AGN position derived by García-Burillo et al. (2019). |
Velocity-integrated line intensity of CH3OH transitions covered in the current work.
4. Inference of gas properties in the CND
The configuration of the CND in NGC 1068 relative to its jet-ISM interaction and the associated outflow geometry makes it a prime source to investigate shock-driven chemistry (García-Burillo et al. 2014; Viti et al. 2014). The axes of the ionized outflow and the jet both form a relatively small angle to the molecular gas disk of the galaxy. This particular geometry implies that there is a strong coupling between the AGN outflow and the jet with the ISM in the disk out to r ∼ 400 − 500 pc. Within this context, we wish to characterize the gas properties traced by CH3OH across the CND regions and to study its association with the shock history of the CND regions.
In characterizing the gas properties traced by any molecular species with multiple transitions, one often assumes optically thin local thermal equilibrium (LTE) conditions. This allows the implementation of the so-called rotation diagram (Goldsmith & Langer 1999) based on the observed line intensities from individual molecular transition. One can then infer the physical properties such as rotational temperature and column density of the species from this rotation diagram. Such an approach relies not only on the validity of the assumption of optically thin LTE, but it also requires each transition to be free of contamination from other lines. In our case, however, blending from different transitions is prevalent (both from A- and E-CH3OH) and hard to disentangle by individual component fitting, as mentioned in Sect. 3.1. One option is to assume thermalization of the gas and to re-distribute the measured line intensity to all transitions involved in the line blending (Martín et al. 2006).
Alternatively, we can use non-LTE radiative transfer modeling and infer the gas properties by comparing the summation of the predicted line intensities from all blending lines in each “transition group” with the observed line intensity for each specific measurement. To characterize the CH3OH emissions across the CND region, we chose to perform a radiative analysis via non-LTE radiative transfer modeling. With this approach, we are able to quantitatively characterize the column density of CH3OH and, more importantly, the gas temperature and the gas density in the CND. For the non-LTE analysis, we used the radiative transfer code RADEX (van der Tak et al. 2007) via the Python package SpectralRadex3 (Holdship et al. 2021). The molecular data used for CH3OH are from Rabli & Flower (2010), taken from the LAMDA database (Schöier et al. 2005). We coupled the RADEX modeling with the Markov chain Monte Carlo (MCMC) sampler emcee (Foreman-Mackey et al. 2013) to perform a Bayesian inference of the parameter probability distributions in order to properly sample this parameter space and obtain reliable uncertainties. We assume priors of uniform or log-uniform distribution within the determined ranges (listed in Table 4). With this, we assume that the uncertainty on our measured intensities is Gaussian, so our likelihood is given by  where χ2 is the chi-squared statistic between our measured intensities and the RADEX predictions based on a set of parameters θ. This allows us to assess the influence of physical conditions, such as gas density and temperature, in the excitation of the transitions analyzed.
Regarding the blending of adjacent A- and E-isomer transitions, we cannot distinguish them, and contributions from any of these lines is generally not negligible for our observations. In other words, all components in the same blended group should be taken into consideration in particular when one tries to compare the line intensity with radiative transfer modeling. Hence, we need to determine, a priori, the flux contribution from both A- and E-CH3OH transitions in our RADEX modeling. The species column density from both isomers, NA− and NE−, are, therefore, also explored as free parameters. In summary, the following physical parameters are explored: the gas volume density (nH2), gas kinetic temperature (Tkin), the species column density (NE− and NA−), and the beam filling factor (ηff). The prior ranges and distributions are given in Table 4. We list the best fit for all the explored parameters in Table 5, and the posterior distribution plots in Figs. A.1–A.4.
Inferred gas properties traced by CH3OH from Bayesian inference processes over four selected regions across CND (R1–R5).
Generally, the gas densities and the molecular column densities of both A and E isomers are well constrained. The inferred A- and E-CH3OH column densities are both between 1015 − 16 cm–2. The physical interpretation regarding these measured A- and E-CH3OH column densities is further explored in Sect. 4.3. The gas densities point to ∼106 cm–3 across all the CND regions. This is not surprising since, as discussed in the introduction, CH3OH is a product of surface reactions in dense environments. The gas kinetic temperature, however, cannot be well constrained in any of the CND regions. Despite the fact that the number of transitions involved in our analysis is greater than the number of free parameters we explore here, it is possible that the coverage of the excitation energy levels is not wide enough to fully constrain the gas temperature. We speculate that CH3OH transitions of higher Eu may be needed to properly constrain gas temperature. We note that we also tried a different algorithm to perform the Bayesian inference – a nested sampling Monte Carlo algorithm MLFriends (Buchner 2016, 2019) using the UltraNest package4 (Buchner 2021) – complementing our analysis with the MCMC sampler emcee (Foreman-Mackey et al. 2013). The inference results with UltraNest still failed to constrain the gas temperature.
4.1. Compatibility of the measured gas properties with the shock scenario
As shown in Table 5, all the inferred gas densities point to ∼106 cm–3 across all the CND regions. With such high gas density, the post-shock gas is expected to cool off fairly quickly (≤ few tens of years, Huang & Viti 2023), which is somewhat consistent with the indication that the (poorly constrained) inferred temperatures are likely to be low (≤100 K; see Fig. A.1).
Based on the chemical modeling with UCLCHEM for the physical condition of the CND of NGC 1068 performed by Huang & Viti (2023), both fast and slow shocks can enhance the methanol fractional abundance to comparable levels in the presence of shocks. However, in the chemical models without shocks, a higher gas temperature is required (such that water ice sublimates, T ≳ 100 K) to boost the CH3OH abundance to comparable levels (Huang & Viti 2023). In models where a shock occurs, the kinetic temperature of the gas can be very high due to shock heating, but it can also be low due to rapid post-shock cooling in a dense medium. Both scenarios lead to methanol abundances compatible with observations. The gas temperature measured from observations, therefore, is one of the key physical parameters in discerning the chemical origin of the observed CH3OH. Unfortunately, in all four CND regions explored, none of the gas temperatures are constrained enough to discern among shock scenarios. Nevertheless, qualitatively, most regions (CND-R1, CND-R3, and CND-R4) tend to point to Tkin < 100 K. This would point to the shock origin of the observed gas-phase CH3OH because in low temperature regimes only shocks can account for the enhanced gas-phase CH3OH (Huang & Viti 2023).
4.2. Comparison with other shock tracers – SiO and HNCO
We choose to compare our results with the work by Huang et al. (2022), where SiO and HNCO maps of the same region and at the same spatial resolution are presented. As far as the spatial distribution of CH3OH is concerned, it is more concentrated toward the east of the CND and much less prominent in the west of the CND. This is similar to the SiO emission reported by Huang et al. (2022). In contrast, the HNCO reported by Huang et al. (2022), even in the higher J level (HNCO 6-5), is much more extended throughout the CND. Interestingly, in terms of the gas density, CH3OH points to a higher gas density than HNCO, while SiO mostly points to lower gas densities near 103 cm–3. Finally, the gas temperature probed by CH3OH, although not well constrained, is in the same range as that probed by HNCO. Compared to the high-T gas traced by SiO, the lower temperature probed by HNCO and CH3OH may be a product of faster cooling in denser gas environments regardless of the speed of the shock. From this comparison, it remains inconclusive whether CH3OH exclusively traces slow and non-dissociative shocks (vs < 20 km s−1), as proposed by Suutarinen et al. (2014), or whether it traces both fast- and slow-shock environments, as hinted by the chemical modeling in Holdship et al. (2017) and Huang & Viti (2023).
4.3. E-/A-CH3OH Ratio
Aside from the gas density and gas temperature, the inferred NE− and NA− will be interesting to inspect. By assuming A- and E-CH3OH isomers are formed and well mixed in the same environment, the equilibrium E/A ratio is linked to the temperature of the formation environment (Wirström et al. 2011; Holdship et al. 2019). Generally, the conversion of one CH3OH isomer to another is considered a strongly forbidden process; the abundance ratio of the two isomers is therefore often assumed to be fixed at the time of the CH3OH formation (Kawakita & Kobayashi 2009; Wirström et al. 2011). In particular, Wirström et al. (2011) noted that CH3OH is expected to be destroyed fairly rapidly compared to the time needed to alter the ratio. This implies that this ratio is thermalized at its formation and hence can provide insights into the origin and physical conditions of the methanol formation (Wirström et al. 2011). In other words, the measured E/A ratio actually informs us about the local temperature associated with CH3OH formation5 at different locations in the CND.
On the ices, the optimal temperature for successive hydrogenation of CO to occur for methanol formation is suggested to be around 10 − 15 K, with a CO:H2O ice mixture or pure solid-phase CO (Watanabe et al. 2004). At this low-temperature regime, an overabundance of A-CH3OH is expected (NE−/NA− < 1.0). In our measured NE−/NA− ratio, the most probable ratio values are fairly close to unity (see Table 5). Interestingly, this is different from the generally expected overabundance of A-CH3OH (Wirström et al. 2011) and the observed NE−/NA− ratio from Galactic outflows reported by Holdship et al. (2019). The Galactic measurements of NE−/NA− ratios reported by Holdship et al. (2019) are all below 0.7 and point to methanol formation temperatures below 10 K (see Fig. 4 in Holdship et al. 2019). In contrast, our measured ratio, which is close to unity, points to a higher formation temperature of CH3OH, ≳15 K. We note that the uncertainty derived from the inferred column densities of both isomers remain fairly large, so this is still highly uncertain.
We also want to highlight the only other two existing E-/A-ratio measurements. Similarly to our non-LTE modeling approach, Muller et al. (2021) performed non-LTE modeling for A- and E-CH3OH isomer observations of the z = 0.89 molecular absorber toward PKS 1830-211. They presented a comparably high E-/A-ratio of ∼1.0 ± 0.1 via the submillimeter absorption lines of methanol from this source (Muller et al. 2021). There is also an LTE model for the nearby starburst galaxy NGC 253 (Humire et al. 2022). They report a fairly wide range of NE−/NA− ratio varying from ∼1.1 to 5.0 (Table 3, Humire et al. 2022). Since the existing gas-phase proton exchange described in the literature is considered dissociative (Wirström et al. 2011), such Galactic-extragalactic distinction in NE−/NA− ratio could imply a distinction between the formation environment of methanol in the nucleus of NGC 1068 from that of our own galaxy. Otherwise, non-dissociative proton exchange reaction(s) such as proton exchange in the solid phase needs to be considered if one assumes that the NE−/NA− ratio in Galactic and extragalactic environments start at a similar level.
5. Conclusions
The outflowing molecular gas in the CND of NGC 1068 and the associated large spread of velocities (∼100 km s−1) likely drive a variety of molecular shocks at different locations in the CND. We performed a multiline molecular study with ALMA of CH3OH in order to determine the chemical signatures of such molecular shocks in the CND of NGC 1068 at spatial scale of GMC ( pc). We briefly summarize our conclusions below.
-
We performed non-LTE radiative transfer analyses, where we coupled RADEX with a Bayesian inference procedure, in order to infer the gas properties traced by CH3OH.
-
The gas densities traced by CH3OH point to ∼106 cm–3 across all the CND regions. The gas kinetic temperature cannot be well constrained in any of the CND regions, though the inferred temperature is likely to be low (≲100 K), suggesting a shock origin of the observed gas-phase CH3OH.
-
We compared both spatial distribution of emissions from multiple tracers of different types of shocks (SiO and HNCO) versus CH3OH, and the gas properties traced by these three species. It remains inconclusive, however, whether CH3OH exclusively trace slow shocks or whether it traces both fast and slow shocks.
-
We also note that the inferred E-/A-isomer ratio is fairly close to unity, which is, interestingly, different from the Galactic measurements in the literature.
We conclude that the observed CH3OH is possibly is of shock origin. It remains inconclusive whether CH3OH, as a shock tracer, is sensitive to the shock velocity.
Here, we refer to nuclear spin isomers. Molecules that have identical nuclei but nonzero nuclear spin could exist at different energy levels belonging to the “nuclear spin modifications” or “nuclear spin isomers” (Hougen & Oka 2005).
We note that this formation temperature is set in the formation history of CH3OH, and is different from the “present-time” gas temperature inferred at the beginning of Sect. 4.
Acknowledgments
K.Y.H. and S.V. received funding from the European Research Council (ERC) Advanced Grant MOPPEX 833460.vii. S.G.B. acknowledges support from research project grants PID2019-106027GA-C44 and PID2022-138560NB-I00 of the Spanish Ministerio de Ciencia e Innovación. K.Y.H. acknowledges assistance from Allegro, the European ALMA Regional Center node in The Netherlands. This paper makes use of the following ALMA data: ADS/JAO.ALMA#2013.1.00221.S, ADS/JAO.ALMA#2015.1.01144.S, and ADS/JAO.ALMA#2018.1.01506.S. ALMA is a partnership of ESO (representing its member states), NSF (USA) and NINS (Japan), together with NRC (Canada), MOST and ASIAA (Taiwan), and KASI (Republic of Korea), in co-operation with the Republic of Chile. The Joint ALMA Observatory is operated by ESO, AUI/NRAO and NAOJ.
References
- Aladro, R., Viti, S., Bayet, E., et al. 2013, A&A, 549, A39 [NASA ADS] [CrossRef] [EDP Sciences] [Google Scholar]
- Álvarez-Barcia, S., Russ, P., Kästner, J., & Lamberts, T. 2018, MNRAS, 479, 2007 [Google Scholar]
- Bland-Hawthorn, J., Gallimore, J. F., Tacconi, L. J., et al. 1997, Ap&SS, 248, 9 [Google Scholar]
- Buchner, J. 2016, Stat. Comput., 26, 383 [Google Scholar]
- Buchner, J. 2019, PASP, 131, 108005 [Google Scholar]
- Buchner, J. 2021, J. Open Source Softw., 6, 3001 [CrossRef] [Google Scholar]
- Foreman-Mackey, D., Hogg, D. W., Lang, D., & Goodman, J. 2013, PASP, 125, 306 [Google Scholar]
- Fuchs, G. W., Cuppen, H. M., Ioppolo, S., et al. 2009, A&A, 505, 629 [NASA ADS] [CrossRef] [EDP Sciences] [Google Scholar]
- García-Burillo, S., Combes, F., Usero, A., et al. 2014, A&A, 567, A125 [Google Scholar]
- García-Burillo, S., Combes, F., Ramos Almeida, C., et al. 2019, A&A, 632, A61 [Google Scholar]
- Garrod, R., Park, I. H., Caselli, P., & Herbst, E. 2006, Farad. Disc., 133, 51 [NASA ADS] [CrossRef] [Google Scholar]
- Gelman, A., Meng, X.-L., & Stern, H. 1996, Stat. Sin., 6, 733 [Google Scholar]
- Geppert, W. D., Hamberg, M., Thomas, R. D., et al. 2006, Farad. Disc., 133, 177 [NASA ADS] [CrossRef] [Google Scholar]
- Goldsmith, P. F., & Langer, W. D. 1999, ApJ, 517, 209 [Google Scholar]
- Holdship, J., Viti, S., Jiménez-Serra, I., Makrymallis, A., & Priestley, F. 2017, AJ, 154, 38 [NASA ADS] [CrossRef] [Google Scholar]
- Holdship, J., Viti, S., Codella, C., et al. 2019, ApJ, 880, 138 [NASA ADS] [CrossRef] [Google Scholar]
- Holdship, J., Viti, S., Martín, S., et al. 2021, A&A, 654, A55 [NASA ADS] [CrossRef] [EDP Sciences] [Google Scholar]
- Hougen, J. T., & Oka, T. 2005, Science, 310, 1913 [CrossRef] [Google Scholar]
- Huang, K.-Y., & Viti, S. 2023, Farad. Disc., 245, 181 [NASA ADS] [CrossRef] [Google Scholar]
- Huang, K. Y., Viti, S., Holdship, J., et al. 2022, A&A, 666, A102 [NASA ADS] [CrossRef] [EDP Sciences] [Google Scholar]
- Humire, P. K., Henkel, C., Hernández-Gómez, A., et al. 2022, A&A, 663, A33 [NASA ADS] [CrossRef] [EDP Sciences] [Google Scholar]
- Kawakita, H., & Kobayashi, H. 2009, ApJ, 693, 388 [NASA ADS] [CrossRef] [Google Scholar]
- Kelly, G., Viti, S., García-Burillo, S., et al. 2017, A&A, 597, A11 [NASA ADS] [CrossRef] [EDP Sciences] [Google Scholar]
- Martín, S., Mauersberger, R., Martín-Pintado, J., Henkel, C., & García-Burillo, S. 2006, ApJS, 164, 450 [Google Scholar]
- Martín, S., Mangum, J. G., Harada, N., et al. 2021, A&A, 656, A46 [NASA ADS] [CrossRef] [EDP Sciences] [Google Scholar]
- McMullin, J. P., Waters, B., Schiebel, D., Young, W., & Golap, K. 2007, in Astronomical Data Analysis Software and Systems XVI, eds. R. A. Shaw, F. Hill, & D. J. Bell, ASP Conf. Ser., 376, 127 [Google Scholar]
- Meijerink, R., & Spaans, M. 2005, A&A, 436, 397 [CrossRef] [EDP Sciences] [Google Scholar]
- Muller, S., Ubachs, W., Menten, K. M., Henkel, C., & Kanekar, N. 2021, A&A, 652, A5 [NASA ADS] [CrossRef] [EDP Sciences] [Google Scholar]
- Nakajima, T., Takano, S., Kohno, K., et al. 2015, PASJ, 67, 8 [NASA ADS] [CrossRef] [Google Scholar]
- Rabli, D., & Flower, D. R. 2010, MNRAS, 406, 95 [Google Scholar]
- Santos, J. C., Chuang, K.-J., Lamberts, T., et al. 2022, ApJ, 931, L33 [NASA ADS] [CrossRef] [Google Scholar]
- Schöier, F. L., van der Tak, F. F. S., van Dishoeck, E. F., & Black, J. H. 2005, A&A, 432, 369 [Google Scholar]
- Scourfield, M., Viti, S., García-Burillo, S., et al. 2020, MNRAS, 496, 5308 [NASA ADS] [CrossRef] [Google Scholar]
- Simons, M. A. J., Lamberts, T., & Cuppen, H. M. 2020, A&A, 634, A52 [NASA ADS] [CrossRef] [EDP Sciences] [Google Scholar]
- Suutarinen, A. N., Kristensen, L. E., Mottram, J. C., Fraser, H. J., & van Dishoeck, E. F. 2014, MNRAS, 440, 1844 [Google Scholar]
- Takano, S., Nakajima, T., Kohno, K., et al. 2014, PASJ, 66, 75 [NASA ADS] [Google Scholar]
- van der Tak, F. F. S., Black, J. H., Schöier, F. L., Jansen, D. J., & van Dishoeck, E. F. 2007, A&A, 468, 627 [NASA ADS] [CrossRef] [EDP Sciences] [Google Scholar]
- Viti, S., García-Burillo, S., Fuente, A., et al. 2014, A&A, 570, A28 [NASA ADS] [CrossRef] [EDP Sciences] [Google Scholar]
- Watanabe, N., Nagaoka, A., Shiraki, T., & Kouchi, A. 2004, ApJ, 616, 638 [Google Scholar]
- Wirström, E. S., Geppert, W. D., Hjalmarson, Å., et al. 2011, A&A, 533, A24 [NASA ADS] [CrossRef] [EDP Sciences] [Google Scholar]
Appendix A: Posterior distribution plots
Here we present all the posterior distribution plots from all four CND regions based on the analysis presented in Sect. 4.
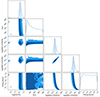 |
Fig. A.1. Bayesian inference results for gas properties traced by CH3OH of CND-R1 region. The corner plots show the sampled distributions for each parameter, as displayed on the x-axis. The 1-D distributions on the diagonal are the posterior distributions for each explored parameter; the reset 2-D distributions are the joint posterior for the corresponding parameter pair on the x- and y- axes. In the 1-D distributions, the 1σ regions are shaded with blue; both 1σ and 2σ are shaded in the 2-D distributions. |
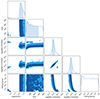 |
Fig. A.2. As in Figure A.1, but for CND-R2 region. This shows the Bayesian inference results for gas properties traced by CH3OH of the CND-R2 region. |
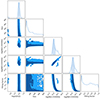 |
Fig. A.3. As in Figure A.1, but for CND-R3 region. This shows the Bayesian inference results for gas properties traced by CH3OH of the CND-R3 region. |
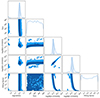 |
Fig. A.4. As in Figure A.1, but for CND-R4 region. This shows the Bayesian inference results for gas properties traced by CH3OH of the CND-R4 region. |
Appendix B: Comparison of the predicted intensity from RADEX with observed values: A posterior predictive check (PPC)
In this section, we perform a posterior predictive check (PPC; Gelman et al. 1996) for the inferred gas properties in Section 4 using RADEX and Bayesian inference process. We do this by performing a comparison of the distribution of the observational data (the measured velocity-integrated intensities) to the predicted distribution described by our Bayesian model. This is to verify our posterior distribution produces a distribution for the data that is consistent with the actual data. We sample the predicted line intensities from our posteriors between 16-84 percentiles and plot these against the observed line intensities.
The comparisons are shown in Figure B.1.
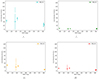 |
Fig. B.1. Posterior predictive checks (PPCs) of all CH3OH intensities for four CND regions (R1-R4). The solid circles with the thin vertical lines are the observed line intensities and the respective error bars. The shaded (thicker) vertical bars are the predicted line intensities. (a) Observed and PPC intensities of CH3OH in CND-R1. (b) Observed and PPC intensities of CH3OH in CND-R2. (c) Observed and PPC intensities of CH3OH in CND-R3. (d) Observed and PPC intensities of CH3OH in CND-R4. |
It is worth noting that in the 145 GHz group, the predicted line intensities are systematically higher than the observed intensities after correcting the line contamination from c-C3H2 emission, based on a very conservative estimate (see discussion in Sect. 3.2. ) This could suggest that this correction may be too aggressive and so underestimates the true emission contribution from CH3OH. Yet, owing to the gas-property inference being based on multiline CH3OH observations, the gas properties inferred are not expected to be penalized by this fact. This characteristic also shadows the true line intensity of CH3OH in the 145 GHz group through the pitched line intensity prediction of this group. We verified the above with a separate set of gas-property inference with no contamination regarding c−C3H2, and the inferred gas properties remain consistent with the case presented in this work (i.e., with aggressive correction), and the observed versus predicted line intensity are consistent.
All Tables
Velocity-integrated line intensity of CH3OH transitions covered in the current work.
Inferred gas properties traced by CH3OH from Bayesian inference processes over four selected regions across CND (R1–R5).
All Figures
|
Fig. 1. Spectra of all CH3OH transitions used in current study. Each panel presents spectral data from the |
| In the text | |
|
Fig. 2. Moment-0 maps of all CH3OH transitions used in current study. Top left: 96 GHz group. Top right: 145 GHz group. Middle left: 157 GHz group. Middle right: 303 GHz transition. Bottom left: 304 GHz transition. Bottom right: 305 GHz transition. The red cross on the map marks the AGN position derived by García-Burillo et al. (2019). |
| In the text | |
|
Fig. A.1. Bayesian inference results for gas properties traced by CH3OH of CND-R1 region. The corner plots show the sampled distributions for each parameter, as displayed on the x-axis. The 1-D distributions on the diagonal are the posterior distributions for each explored parameter; the reset 2-D distributions are the joint posterior for the corresponding parameter pair on the x- and y- axes. In the 1-D distributions, the 1σ regions are shaded with blue; both 1σ and 2σ are shaded in the 2-D distributions. |
| In the text | |
|
Fig. A.2. As in Figure A.1, but for CND-R2 region. This shows the Bayesian inference results for gas properties traced by CH3OH of the CND-R2 region. |
| In the text | |
|
Fig. A.3. As in Figure A.1, but for CND-R3 region. This shows the Bayesian inference results for gas properties traced by CH3OH of the CND-R3 region. |
| In the text | |
|
Fig. A.4. As in Figure A.1, but for CND-R4 region. This shows the Bayesian inference results for gas properties traced by CH3OH of the CND-R4 region. |
| In the text | |
|
Fig. B.1. Posterior predictive checks (PPCs) of all CH3OH intensities for four CND regions (R1-R4). The solid circles with the thin vertical lines are the observed line intensities and the respective error bars. The shaded (thicker) vertical bars are the predicted line intensities. (a) Observed and PPC intensities of CH3OH in CND-R1. (b) Observed and PPC intensities of CH3OH in CND-R2. (c) Observed and PPC intensities of CH3OH in CND-R3. (d) Observed and PPC intensities of CH3OH in CND-R4. |
| In the text | |
Current usage metrics show cumulative count of Article Views (full-text article views including HTML views, PDF and ePub downloads, according to the available data) and Abstracts Views on Vision4Press platform.
Data correspond to usage on the plateform after 2015. The current usage metrics is available 48-96 hours after online publication and is updated daily on week days.
Initial download of the metrics may take a while.