Fig. 1.
Download original image
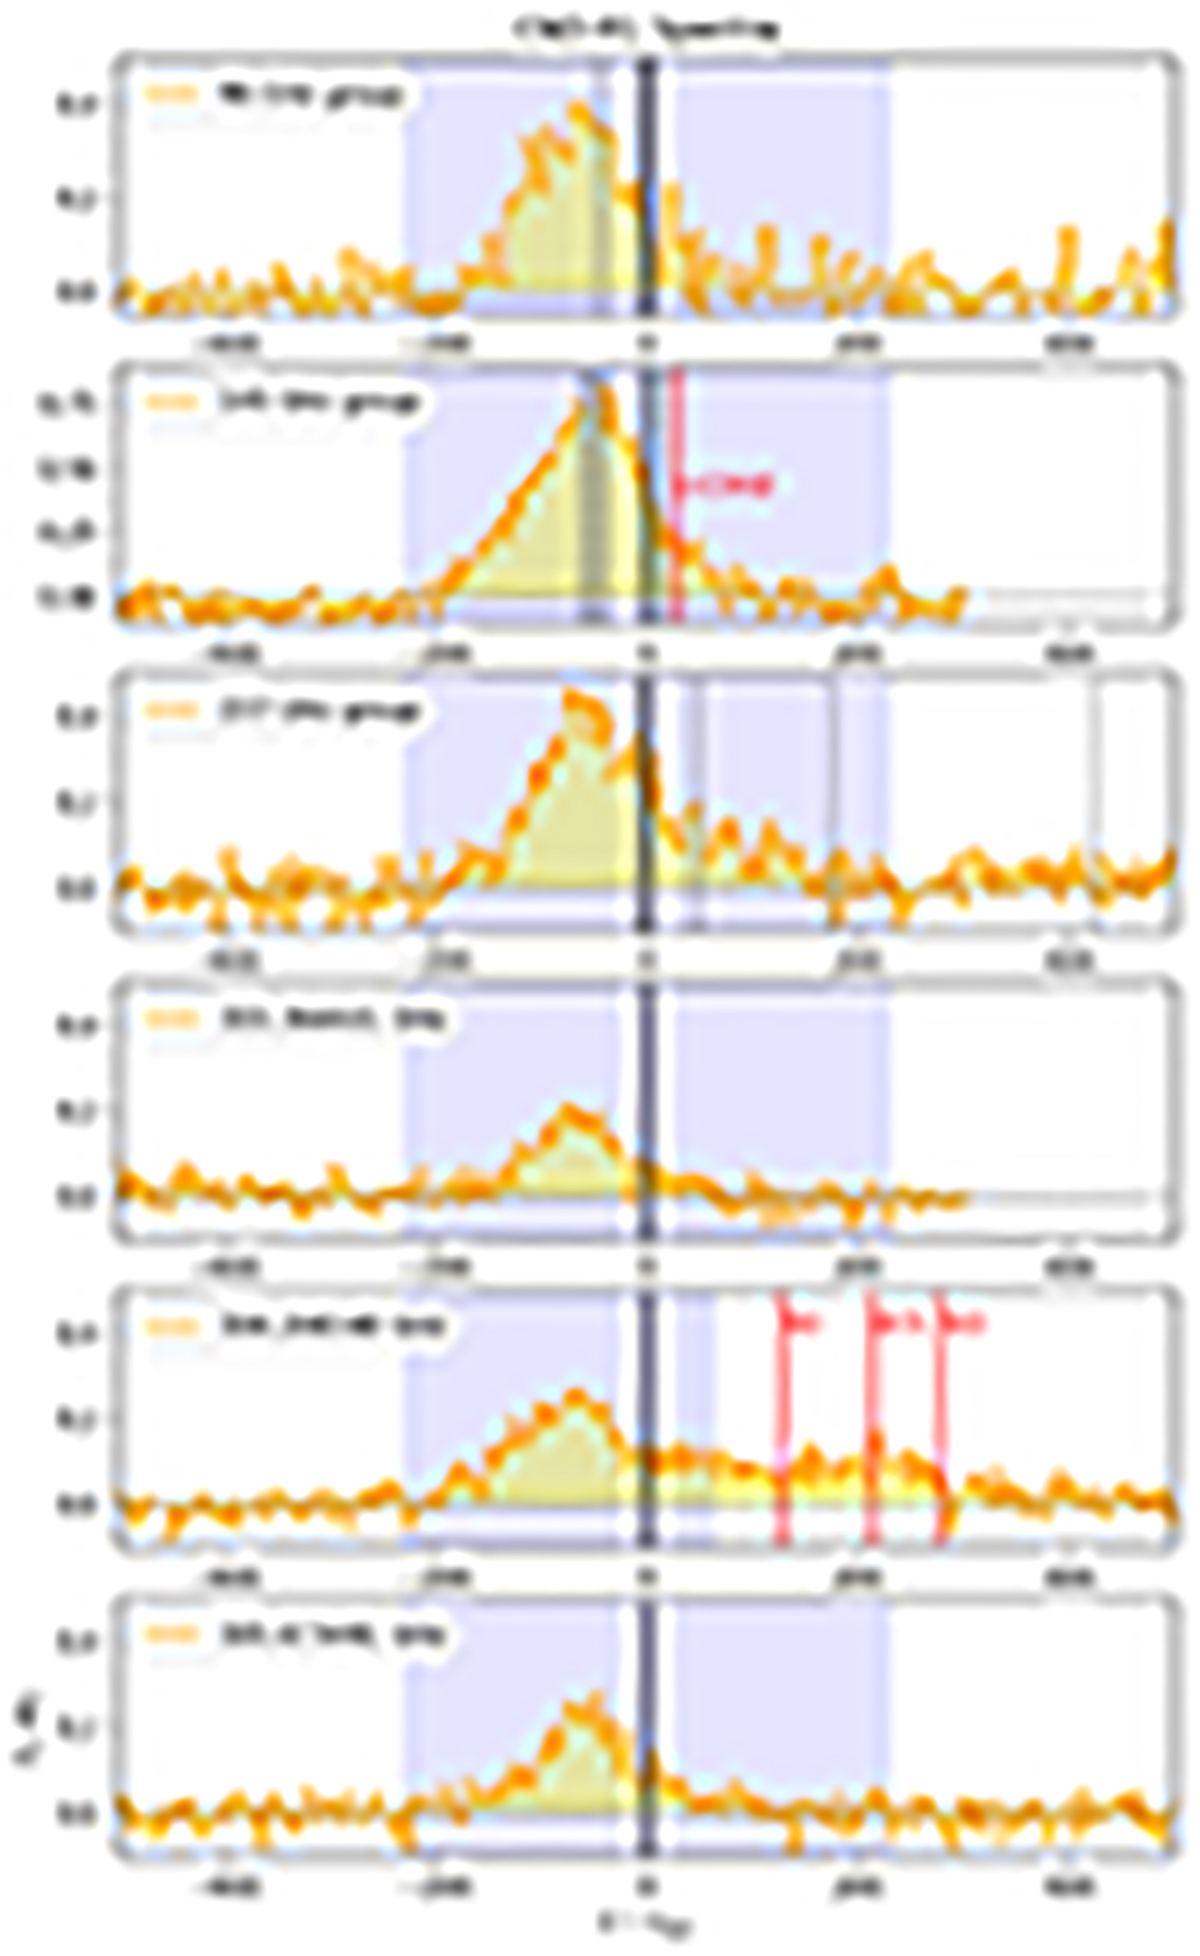
Spectra of all CH3OH transitions used in current study. Each panel presents spectral data from the ![]() CND-R1 region from the data cube at their original spectral resolution (Δv ∼ 4 − 6 km s−1) as a solid orange curve. The solid black vertical lines are the frequency references using CH3OH lines with the lowest Eu in each group. The gray dashed vertical lines are adjacent CH3OH lines potentially covered by our spectral setup. Velocities refer to vsys, LSRK = 1120 km s−1. The blue shaded area indicates the velocity coverage we use to derive the velocity-integrated line intensities in our analysis. The gray dashed horizontal line gives the zero-baseline reference.
CND-R1 region from the data cube at their original spectral resolution (Δv ∼ 4 − 6 km s−1) as a solid orange curve. The solid black vertical lines are the frequency references using CH3OH lines with the lowest Eu in each group. The gray dashed vertical lines are adjacent CH3OH lines potentially covered by our spectral setup. Velocities refer to vsys, LSRK = 1120 km s−1. The blue shaded area indicates the velocity coverage we use to derive the velocity-integrated line intensities in our analysis. The gray dashed horizontal line gives the zero-baseline reference.
Current usage metrics show cumulative count of Article Views (full-text article views including HTML views, PDF and ePub downloads, according to the available data) and Abstracts Views on Vision4Press platform.
Data correspond to usage on the plateform after 2015. The current usage metrics is available 48-96 hours after online publication and is updated daily on week days.
Initial download of the metrics may take a while.