| Issue |
A&A
Volume 682, February 2024
|
|
|---|---|---|
| Article Number | A153 | |
| Number of page(s) | 11 | |
| Section | Catalogs and data | |
| DOI | https://doi.org/10.1051/0004-6361/202347921 | |
| Published online | 16 February 2024 | |
Enlightening the Universe behind the Milky Way bulge
I. Target selection of VVV bulge galaxies★
1
Gabinete de Astronomía Extragaláctica, CONICET, Departamento de Geofísica y Astronomía, Facultad de Ciencias Exactas, Físicas y Naturales, Universidad Nacional de San Juan,
Av. Ignacio de la Roza 590 (O), J5402DCS,
Rivadavia,
San Juan,
Argentina
e-mail: This email address is being protected from spambots. You need JavaScript enabled to view it.
2
Instituto de Astrofísica, Facultad de Ciencias Exactas, Universidad Andres Bello,
Av. Fernandez Concha 700,
Las Condes,
Santiago,
Chile
3
Vatican Observatory,
00120
Vatican City State,
Italy
4
Instituto de Investigación Multidisciplinar en Ciencia y Tecnología, Universidad de La Serena,
Raúl Bitrán 1305,
La Serena,
Chile
5
Association of Universities for Research in Astronomy (AURA),
Av. Juan Cisternas 1500,
La Serena,
Chile
6
Grupo de Astrofísica Extragaláctica-IANIGLA, CONICET, Universidad Nacional de Cuyo (UNCuyo),
Gobierno de Mendoza, Parque Gral San Martín, CC 330,
CP 5500,
Mendoza,
Argentina
7
Instituto de Astronomía Teórica y Experimental (IATE-CONICET),
Laprida 854, X5000BGR,
Córdoba,
Argentina
8
Observatorio Astronómico de Córdoba, Universidad Nacional de Córdoba (OAC-UNC),
Laprida 854, X5000BGR,
Córdoba,
Argentina
9
Departamento de Geofísica y Astronomía, Facultad de Ciencias Exactas, Físicas y Naturales, Universidad Nacional de San Juan,
Av. Ignacio de la Roza 590 (O), J5402DCS,
Rivadavia,
San Juan,
Argentina
Received:
8
September
2023
Accepted:
12
October
2023
Abstract
Context. The location of the Solar System complicates the detection extragalactic sources beyond the Milky Way plane. The optical observations are hampered in the so-called zone of avoidance (ZOA), where stellar crowding and Galactic absorption are severe. Observations at longer wavelengths are needed in order to discover new background galaxies and complete the census in the ZOA.
Aims. The goal of this work is to identify galaxies behind the Milky Way bulge using near-infrared (NIR) data from the VISTA Variables in Vía Láctea (VVV) survey.
Methods. To this end, we made use of different VISTA Science Archive (VSA) tools in order to extract relevant information from more than 32 billion catalogued sources in the VVV bulge region. We find that initial photometric restriction on sources from the VSA vvvSource table combined with restrictions on star–galaxy separation parameters obtained from Source Extractor is a successful strategy for achieving acceptable levels of contamination (60%) and high completeness (75%) in the construction of a galaxy target sample. To remove contaminating Galactic sources from the initial target sample, our methodology also incorporates a visual inspection of false-colour RGB images, a crucial quality control carried out following a specifically defined procedure.
Results. Under this methodology, we find 14 480 galaxy candidates in the VVV bulge region, making this sample the largest catalogue to date in the ZOA. Moreover, these new sources provide a fresh picture of the Universe hidden behind the curtain of stars, dust, and gas in the unexplored Milky Way bulge region.
Conclusions. The results from this work further demonstrate the potential of the VVV/VVVX survey to find and study a large number of galaxies and extragalactic structures obscured by the Milky Way, expanding our knowledge of the Universe in this challenging and impressive region of the sky.
Key words: Galaxy: bulge / galaxies: photometry / galaxies: statistics / infrared: galaxies
The catalogue is available at the CDS via anonymous ftp to cdsarc.cds.unistra.fr (130.79.120.5) or via https://cdsarc.cds.unistra.fr/viz-bin/cat/J/A+A/682/A153
© The Authors 2024
 Open Access article, published by EDP Sciences, under the terms of the Creative Commons Attribution License (https://creativecommons.org/licenses/by/4.0), which permits unrestricted use, distribution, and reproduction in any medium, provided the original work is properly cited.
This article is published in open access under the Subscribe to Open model. This email address is being protected from spambots. You need JavaScript enabled to view it. to support open access publication.
1 Introduction
In the so-called zone of avoidance (ZOA), extragalactic source detections beyond the Milky Way are hampered by Galactic absorption and stellar crowding. The dust and stars in our Galaxy prevent optical observations, which means we currently have an incomplete picture of the Universe behind this area of the sky.
This lack of information on the existing galaxies in the ZOA was first defined by Shapley (1961). As the ZOA covers about 25% of the sky distribution of optically visible galaxies (Kraan-Korteweg & Lahav 2000), several strategies have been developed to obtain further information at different wavelengths. In the optical wavelengths, the catalogues of Kraan-Korteweg & Lahav (2000) and Woudt et al. (2004) have allowed the detection of new galaxies at low Galactic latitude, although the gathering of information is restricted by Galactic dust and stars. On the other hand, near-infrared (NIR), X-ray, and H I radio surveys (Roman et al. 1998; Ebeling et al. 2002; Vauglin et al. 2002; Koribalski et al. 2004; Paturel et al. 2005; Skrutskie et al. 2006; Huchra et al. 2012) have detected galaxies and galaxy clusters at low Galactic latitude. Also, Jarrett et al. (2000) identified and extracted extended sources from the Two Micron All-Sky Survey (2MASS) catalogue and Macri et al. (2019) presented redshifts for 1041 2MASS Redshift Survey galaxies that previously lacked this information and are mostly located within theZoA. Furthermore, using the H I Parkes All-Sky Survey, Staveley-Smith et al. (2016) observed 883 galaxies, allowing them to delineate the existence of possible large-scale structure in the Great Attractor region at low Galactic latitude. In addition, Schröder et al. (2019) published a catalogue with 170 galaxies located in the northern region of the ZOA from the blind H I survey with the Effelsberg 100 m radio telescope. These results represent a significant advance, although homogeneous coverage of the region has not yet been achieved, leaving a vast area that is largely unexplored.
The NIR public survey VISTA Variables in Vía Láctea (VVV; Minniti et al. 2010; Saito et al. 2012) has proven that although the main scientific goals of VVV are related to stellar sources (Minniti et al. 2011; Beamín et al. 2013; Ivanov et al. 2013), its exquisite depth (about 3 magnitudes deeper than 2MASS) and angular resolution (0.339 arcsec/px) make it an excellent tool for finding and studying extragalactic objects in the ZOA. The VVV photometry is divided into two different regions: the disc and the bulge. Several studies have been carried out using VVV data to identify galaxy candidates within the VVV disc. In a pioneering work, Amôres et al. (2012) identified 204 new galaxy candidates from the VVV photometry of a region of 1.636 square degrees near the Galactic plane, increasing the surface density of known galaxies behind the Milky Way by more than an order of magnitude. Further, Baravalle et al. (2018) found 530 new galaxy candidates in two tiles in the region of the Galactic disc and used a combination of SExtractor and PSFEx techniques to detect and characterise them. Later, Baravalle et al. (2019), using spectroscopic data from Flamingos-2 at Gemini South Observatory, confirmed the existence of the first galaxy cluster discovered by the VVV survey beyond the Milky Way disc. Moreover, Baravalle et al. (2021) studied the entire VVV disc region, discovering more than 5000 visually confirmed galaxies, of which only 45 were previously known, generating a VVV NIR galaxy catalogue of this region.
In the VVV bulge, Coldwell et al. (2014) found the VVV NIR galaxy counterparts of a new cluster of galaxies at red-shift z = 0.13 observed in X-ray by Suzaku (Mori et al. 2013), detecting 15 new candidate galaxy members within the central region of the cluster up to 350 kpc from the X-ray peak emission. Further, Galdeano et al. (2021, hereafter G21) found an unusual concentration of galaxies by exploring the b204 VVV bulge tile, detecting 624 extended sources, of which 607 correspond to new galaxy candidates catalogued for the first time. A significant overdensity of galaxies was detected in this region and the existence of a new galaxy cluster was confirmed by Galdeano et al. (2023), who analysed photometric properties and estimated spectroscopic and photometric redshifts of the galaxy member candidates. Also, using bulge VVVX data (Minniti 2016), Galdeano et al. (2022) present an IR view of Ophiuchus, the second-brightest galaxy cluster in the X-ray sky, finding seven times more cluster galaxy candidates than the number of reported Ophiuchus galaxies in previous works.
All these works demonstrate the potential of the VVV survey in the detection and analysis of extragalactic sources in specific regions of the Galactic bulge. It is therefore important that suitable selection criteria be defined in order to identify extra-galactic objects in the entire VVV bulge region. Nevertheless, the identification of extragalactic sources in this area of the sky is extremely complicated, not only because of the high levels of stellar crowding and extinction but also given the huge amount of data compiled by the VVV survey. Therefore, our goal to identify galaxies behind the VVV bulge is a data-mining project that has the potential to extract, process, and analyse relevant information from more than 590 million catalogued sources. In this work, we present a procedure to select galaxy candidates hidden behind the curtain of stars, dust, and gas in the unexplored VVV bulge region.
This paper is structured as follows: in Sect. 2 we describe the main properties of the VVV data used in this work. In Sect. 3 we present a strategy to select extended objects from VVV data and in Sect. 4 we present the galaxy target sample. Our target selection criteria is tested in Sect. 5, where we use public galaxy catalogues. In Sect. 6 we describe the construction of a galaxy catalogue in the VVV bulge sky region, and finally in Sect. 7 we summarise our main results and conclusions. The adopted cosmology throughout this paper is Ω = 0.3, ΩΛ = 0.7, and H0 = 100 kms−1 Mpc.
2 VVV data
The VVV survey is a NIR ESO public survey setup to map the Milky Way bulge and disc. The survey uses the 4.1m ESO Visual and Infrared Survey Telescope for Astronomy (VISTA; Emerson et al. 2004, 2006; Emerson & Sutherland 2010) located at the ESO Cerro Paranal Observatory in Chile. Observations were carried out with the VISTA IR CAMera (VIRCAM), which is composed of 16 Raytheon VIRGO 2048 × 2048 HgCdTe on CdZnTe substrate science detectors, with a mean pixel scale of 0.339 arcsec px−1 and a field of view per exposure of 0.59 square degrees. The detectors are arranged in a grid with spaces in between detectors of 90% of the detector width in the x-direction and 42.5% in the y-direction. Six exposures are required to make a contiguous area of 1.636 square degrees. The individual exposure is known as a ‘pawprint’ and the final area as a ‘tile’ (1.48 by 1.18 degrees in size).
The bulge of the Milky Way, located at nearly 8 kpc from the Sun, is a challenging region where the optical light from millions of stars at low latitudes in our Galaxy is hidden by dust and gas. The VVV survey has mapped the bulge area within −10 deg < l < + 10.4 deg and −10.3 deg < b < +5.1 deg by 196 contiguous tile images covering about 320 square degrees using Z, Y, J, H, and Ks NIR filters. The observing strategy involves the addition of some overlap between tiles for a smooth match, and therefore there are overlaps between adjacent tiles and the complete survey area is covered by at least four exposures in each filter. These observations overcome the heavy extinction of the Galactic plane, reaching a limiting aperture magnitude of up to Ks ~ 18 in clean fields and up to Ks ~ 16 in the inner bulge (Minniti et al. 2010; Saito et al. 2012).
The data reduction consists of two main steps: First the basic data reduction was carried out by the VISTA Data Flow System (VDFS; Emerson et al. 2004; Irwin et al. 2004; Hambly et al. 2004) at the Cambridge Astronomy Survey Unit (CASU1). A second-order data processing then involves the production of survey products, that is calibrated data and catalogues, and was done by the Wide Field Astronomy Unit (WFAU) VISTA Science Archive (VSA2) in Edinburgh.
The VSA is therefore a virtual observatory that holds the image and catalogue data products generated by the six VISTA Public Surveys, including VVV. It is a relational database that stores information of catalogued sources available through structured query language (SQL) queries. Data are presented in tables linked via reference ID numbers. These tables contain catalogues with the main information on astronomical objects and also metadata and calibration image information. Also, VISTA images are held in the archive as multi-extension FITS files and different tools at VSA can be used to extract cut-out images around a given position.
In the present work we made use of different VSA tools in order to extract relevant information on particular sources in the VVV bulge region. To this end, we considered the latest VSA release of the VVV survey, VVV-DR5.
3 Target selection strategy
The principal catalogue we use is the VSA vvvSource table, which contains merged records from the deepest observations in each detection for a given object in the five ZYJHKs VVV passbands. In VSA, the source tables combine single-passband detections into a merged multi-colour record, propagating only the most useful subset of photometric, astrometric, and morphological attributes along with associated errors. Also, the source table presents a normally distributed merged classification statistic that describes the probability that an object is point-like compared to an empirical idealised model representing the PSF for of frame. A value of 0.0 corresponds to a point-like source, increasingly negative values indicate sharper images (e.g. noiselike), and increasingly positive values indicate extended sources, such as resolved galaxies (for a detailed description, see Hambly et al. 2008).
Even if the source table comprises only the most useful information on a detected source, the vvvSource table contains more than 300 entries for each of the ~3.7 billion catalogued sources (10 < Ks < 17). From these, 1.2 billion objects have a higher probability of being galaxies according to the source-type classifications, that is, mergedClass= 1. This number is huge compared to the number of galaxies expected to be found in the VVV bulge calculated in G21 using mock catalogues, where we study VVV bulge tile b204, finding that for a mean background region, the integrated number of galaxies per 1 deg2 is about 70 galaxies, with Ks < 17 up to z ~ 0.15. If we consider the entire VVV bulge region (320 deg2), the expected number of galaxies based on these results is 22 400. It is worth noting that the absorption and stellar density in tile b204 is low compared to other bulge regions, and therefore the number of galaxies may vary according to the tile position in this complex area of the sky.
Therefore, it is crucial to define suitable constraints on the main photometric parameters of the catalogued objects in the vvvSource table in order to remove non-extragalactic sources from this sample. In order to perform a suitable selection of targets with a higher probability of being galaxies, we use SQL queries on the vvvSource table, taking into account the fact that galaxies have particular photometric properties – such as their red colour, which can be used to differentiate extended galaxylike objects from stellar sources –, and we also use specific star–galaxy separation parameters that help in the identification of galaxy-type objects.
In order to select galaxy candidates, we considered the merged class statistic, limiting our study to galaxy-type classification mergedClass=1 and rejecting all other source types (e.g. noise, star, probable stars, and probable galaxies). To select photometric restrictions, we used the non-aperture-corrected magnitudes within 2.0 arcsec diameter (APERMAG3) and considered the Chen et al. (2013) maps in the Nishiyama et al. (2009) system (stored in vvvBulge3DExtinctVals and FilterExtinctionCoefficients EXTINCT tables) to obtain extinction-corrected magnitudes.
We require available photometry (not null values) in the JHKs bands and restricted our selection to sources with 10 mag < Ks < 16.2 mag. The lower limit is chosen to avoid saturated stars and the upper limit is close to the limiting magnitude in the inner bulge (Saito et al. 2012) and is also the reliable limit for visual inspection defined in G21. Different works using VVV data show that there are no galaxies with (J-Ks) colours at lower than ~0.5 mag (e.g. Amôres et al. 2012; Coldwell et al. 2014; Baravalle et al. 2018; Galdeano et al. 2021). Therefore, as a first restriction, we considered J-Ks > 0.5 mag, H-Ks > 0 mag, and J-H > 0 mag colour constraints in the selection of probable galaxy–type sources.
Under these photometric restrictions, we obtained an initial sample of about 7.5 million sources in the whole VVV bulge region. To study the nature of the selected sources, we built a random sample comprising 2000 objects randomly selected from the initial sample of 7.5 million sources. With this sample, we performed a detailed study, with the aim being to rid the original sample of galactic sources while retaining most of the galaxy-type objects.
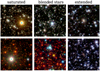 |
Fig. 1 Examples of the different classes of objects identified in the VVV bulge region, saturated sources (left), blended stars (middle), and extended objects (right). The RGB images are a combination of KsJZ filters. Each image has a dimension of 1 arcmin × 1 arcmin. |
3.1 Different source classes in the VVV bulge
Attempting to identify galaxies, we considered several restrictions on VVV catalogued sources. Nevertheless, we initially expected a high level of contamination in our sample given the complexity of the Galactic bulge. Visual inspection is therefore an unavoidable step in the identification of galaxies in VVV images (Amôres et al. 2012; Baravalle et al. 2018; Galdeano et al. 2021). We tested different filter combinations in order to highlight galaxy-like colours compared to stellar Galactic sources and find that building RGB images from KsJZ filters is the most convenient combination. This is because the blue light of galaxies behind the Galactic bulge is absorbed by the Milky Way dust, making galaxies appear as red objects compared to the bluer stellar sources.
In order to study the nature of the selected sources, we performed a visual inspection of RGB images of the objects in a random sample and identified three main different types of sources: blended stars, saturated sources, and extended objects. Figure 1 shows examples of these three different classifications.
Our first result was the finding that 99.3% of the sources are non-extended with 775 saturated sources and 1211 blended stars (38.75 and 60.55%, respectively). We found only 14 (0.7%) sources with the extended category; therefore the random sample is highly dominated by sources associated with our Galaxy. Figure 2 shows the sky distribution of objects in the random sample superimposed on the sky density of the initial sample of 7.5 million sources. We calculated the overdensity as a function of Galactic latitude and find that the initial sample is severely depleted at low Galactic latitudes (|b| < 2). Saturated sources and blended stars also show this trend. There is a lack of extended objects at these low Galactic latitudes, and so it is expected that 99.9% of sources at low latitudes are associated with objects in our Galaxy. These results are not surprising given the high absorption and stellar density of the inner bulge region.
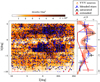 |
Fig. 2 Sky distribution of the 7.5 million sources selected from the VSA VVV-DR5 catalogue, considering mergedClass = 1, 10 mag < Ks < 16.2 mag, J-Ks > 0.5 mag, H-Ks > 0 mag, J-H > 0 mag. We pixelated the VVV bulge region in pixels of 7 arcmin × 7 arcmin, and colour coded them according to the density per square degree. We also show the distribution of extended objects, saturated sources, and blended stars in a sample of 2000 random sources. The right panel shows the overdensity as a function of Galactic latitude for the entire sample and also for the different classes of sources in the random sample. Error bars correspond to 1σ values. |
3.2 Photometry requirements
In this section, we present our study of the different photometric properties of objects in the random sample, such as colours and magnitudes, considering the different source types defined above. Figure 3 shows a (J-Ks) versus Ks colour magnitude diagram. From this plot, we can clearly appreciate that extended objects are redder than (J-Ks) = 0.95 mag. Moreover, only 132 (6.6%) of the non-extended sources (71 blended stars and 61 saturated sources) present (J-Ks) colours as red as extended galaxy candidates. Most of these sources are associated with red stars at low Galactic latitudes (|b| < 2). Therefore, we adopt (J-Ks) > 0.95 mag as a suitable colour limit with which to further remove any stars from our sample. From Fig. 3, we also see that galaxies are fainter than Ks = 14 mag; nevertheless, different authors report galaxies with a Ks magnitude as bright as Ks = 10 mag within the VVV survey (see G21 and Baravalle et al. 2018). Given the high level of decontamination achieved with the (J-Ks) colour cut, we decided to explore the entire 10 mag < Ks < 16.2 mag range.
We also find that 12 (86%) of the 14 detected extended sources in the random sample have available photometry in the five ZYHJKs bands. On the other hand, only 56 (29 saturated sources and 27 blended stars; 42%) of the 132 non-extended sources with (J-Ks) > 0.95 mag have available photometry in all VVV bands. Therefore, we conclude that by requiring ZYHJKs with available photometric measurements, we are able to discard most galactic sources at low latitude, while retaining about 90% of the extended objects in the VVV bulge region.
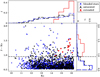 |
Fig. 3 Colour-magnitude diagrams (J-Ks) versus Ks for sources in the random sample considering extinction-corrected aperture magnitudes. We present saturated sources as black diamonds, blended stars as blue open circles, and extended objects as red dots. Long-dashed lines correspond to the (J-Ks) = 0.95 mag colour cut adopted in this work. In the top and right panels, we plot the normalised distributions of colour and magnitude, respectively (short dashed line for saturated sources, long dashed line for blended stars, and red solid line for extended objects). |
3.3 Obtaining suitable photometry of extended sources
The catalogues obtained from VSA have only aperture magnitudes, but for galaxies it is crucial to also estimate total magnitudes. Therefore, in order to obtain suitable photometry of extended sources we run SExtractor (SE; Bertin & Arnouts 1996) to create new catalogues from VVV images. The SE software was developed to detect, deblend, measure, and classify sources from astronomical images. As crowded fields are very common in the VVV sky area, the deblending of SE is very useful in the analysis of overlapping objects.
We use SE with parameters set according to G21. Briefly, SE recognised and separated from the background noise all the objects with a threshold of more than twice the medium brightness of the sky and spanning over at least ten connected pixels on the VVV images (Coldwell et al. 2014; Baravalle et al. 2018; Galdeano et al. 2021). A Gaussian filter with 3 × 3 pixels and a convolution mask was applied to the images in order to efficiently separate low-surface-brightness objects from spurious detections. For the deblending process, we considered the default values that allow overlapping stars to be efficiently separated from galaxies in this tile. We used zero-point magnitudes to calibrate the magnitudes estimated by SE. The output parameters selected from SExtractor catalogues were equatorial coordinates, Ks aperture magnitude calculated within a three-pixel-radius circular aperture, Ks total magnitude MAG_AUTO, which is based on Kron’s algorithm (Kron 1980), CLASS_STAR (CS), and half-light radius (R1/2). These last two parameters are used for star–galaxy separation, because the stars lie in a sequence near CS = 1, while galaxies are near CS = 0 and the two sequences merge for faint sources. The half-light radius parameter, R1/2, measures the radius that encloses 50% of the total flux of an object. For objects larger than the seeing, R1/2 is independent of magnitude and is larger for galaxies than for stars.
As described previously, the restrictions on photometry are insuffient to properly select galaxies from the vvvSource table, because there is a large fraction of targets associated with stellar sources in the Galaxy. Here, we expect SE to fill this role and to help us to lower the contamination in our sample while keeping a high completeness level. To this end, we used the MultiGetlmage tool from VSA to download 1 arcmin × 1 arcmin Ks–band images of the 2000 sources in the random sample. We ran SE on these images, finding that 1027 sources were successfully extracted, (11 extended, 238 saturated, and 778 blended stars) from the original list of 14 extended objects, 775 saturated sources, and 1211 blended stars. Therefore, SE identifies about 80% of the extended objects and discards a large fraction (70%) of saturated sources, but removes only 36% of the blended stars.
To rid our sample of stellar sources, we studied the star–galaxy separation parameters CS and R1/2. Figure 4 presents a dispersion plot of these parameters and also their individual distribution. From this figure, we see that most extended sources present a low CS parameter value, with all the SE-detected extended objects in the random sample having CS < 0.2. In the case of both saturated sources and blended stars, the CS distribution is bimodal with about half of the sources presenting CS < 0.5. For the R1/2 parameter, there is a clear difference between the distribution of extended objects and that of saturated sources and blended stars. For instance, if we consider R1/2 ~ 1 arcsec, we find that about 75% of the stellar sources associated with our Galaxy have values lower than this limit, while all the extended objects present R1/2 > 1 arcsec.
Based on these results, we consider CS < 0.5 and R1/2 > 1 arcsec restrictions as suitable cuts in the star–galaxy separation parameters. From the original random sample, we find that 11 extended objects, 67 saturated sources, and 164 blended stars to fall within these restrictions. Therefore, considering only restrictions on the SE star–galaxy separation parameters, the contamination associated with Galactic sources is lowered to ~20%, while completeness is preserved at levels closer to 80%.
Numbers of extended objects, saturated sources, and blended stars in the random sample (mergedClass =1, 10 mag < Ks < 16.2 mag, J-Ks > 0.5 mag, H-Ks > 0 mag, J-H > 0 mag), considering different restrictions in VVV photometry and SE star–galaxy separation parameters.
4 A galaxy target sample in the VVV bulge
Based on the results of the previous sections, we find that initial photometric restrictions on sources from the VSA vvvSource table combined with restrictions on star–galaxy separation parameters obtained from SE are a successful strategy to achieve acceptable levels of contamination and a high completeness in the construction of a sample suitable for the identification of galaxy candidates in the VVV bulge.
Therefore, we define the following final restrictions:
mergedClass = 1.
ZYJHKs APERMAG3 magnitudes with non-null values.
Ks APERMAG3 extinction-corrected aperture magnitude in the range 10 mag < Ks < 16.2 mag.
J-Ks > 0.95 mag, H-Ks > 0 mag, and J-H > 0 mag considering extinction-corrected aperture magnitudes.
SE star–galaxy separation parameters obtained from Ks images fulfilling CS < 0.5 and R1/2 > 1 arcsec.
We use these restrictions to minimise contamination in our sample while retaining most of the possible galaxy candidates. From the 2000 sources in the random sample, there are only 30 that pass these cuts: 11 extended objects, 5 saturated sources, and 14 blended stars. Therefore, we expect one-third of the objects under study to be galaxy candidates. Table 1 summarises the number of extended objects, saturated sources, and blended stars for each tested restriction. From these numbers, we note that, by combining photometric and SE restrictions, we lower the contamination from 99 to 60%, while retaining about 80% of the extended sources.
Figure 5 shows the fractions of extended objects, saturated sources, and blended stars in the random sample as a function of Ks extinction-corrected aperture magnitude. We study the trend before and after considering our final restrictions. An increase in extended objects can be seen towards fainter magnitudes, with galaxy-like sources having Ks < 14 mag. Also, the fraction of blended stars in the sample drops for fainter magnitudes, while the fraction of saturated sources slightly increases for sources fainter than Ks = 13 mag. After the restrictions in the photometry and in the star–galaxy separation parameters (obtained from SE), the fraction of galactic sources significantly drops and is important only at intermediate magnitudes. In the case of the extended sources the trend remains unaltered after the photometric plus SE restrictions.
From the photometric restrictions, we get a sample of 191 879 VSA sources, and after running SE we retain 38 718 targetsSE to be analysed in the search of galaxy candidates behind the VVV Galactic bulge region. We note that by running SE on Ks images, we expect to avoid the visual inspection of about 80% of the sources selected only with the photometric restrictions, which significantly helps in this very time-consuming but crucial step of our methodology.
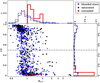 |
Fig. 4 Distribution of R1/2 (in arcsec) versus CS for sources in the random sample. We present saturated sources as black diamonds, blended stars as blue open circles, and extended objects as red dots. Long-dashed lines correspond to the CS and R1/2 cuts adopted in this work. In the top and right panels, we plot the normalised distributions of R1/2 and CS, respectively (short dashed line for saturated sources, long dashed line for blended stars, and red solid line for extended objects). |
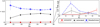 |
Fig. 5 Fraction of extended objects (red solid line), saturated sources (black short–dashed line), and blended stars (blue long–dashed line) in the random sample as a function of Ks extinction-corrected aperture magnitude. Left panel: original fractions. Right panel: fractions after considering the final restrictions. Error bars represent the standard error of the fractions. |
5 Testing target selection
In the previous section, we define selection criteria for extended objects in the VVV bulge region, aiming to decontaminate the catalogue of VVV sources from saturated and/or blended Galactic stars. The aim of analysis of the present section is to test our target-selection criteria in the identification of already catalogued galaxies in the VVV bulge region. To this end, we used the 2MASS Extended Source Catalogue (Jarrett et al. 2000) as well as the catalogue of galaxies candidates presented in G21 to test the completeness of these samples under our galaxy selection criteria.
5.1 Comparison with 2MASS Extended Source Catalogue
The largest catalogue of extended sources in the VVV bulge region to date is the 2MASS Extended Source Catalogue (2MXSC; Jarrett et al. 2000). This is an all-sky survey comprising more than 1.5 million objects (2MASX), but only 271 of these sources are in the VVV bulge area considered in this work. In order to study these sources in more detail, we built 1 arcmin × 1 arcmin RGB images using VVV KsJZ bands, which highlight the red colour of galaxies against the bluer foreground stars. This effect together with the fact that VVV is deeper than 2MASS and has a higher resolution allows a detailed visual inspection of 2MASX objects leading to a suitable morphological classification, as can be seen in Fig. 6, where the spiral nature of the galaxy 2MASX-18242335-3410546 clearly emerges in the VVV false-colour image.
We performed a careful visual inspection of the 271 2MXS in VVV bulge finding that only 182 are galaxies; the remaining objects are associated with Galactic sources, such as star clusters and gaseous regions. Figure 7 shows the sky distribution of 2MASX sources in the VVV bulge area and some examples of Galactic and extragalactic objects in this sample. The Galactic sources are the brightest in the sample (Ks < 12 mag) and are located mainly at b > −5 deg. All galaxy-like objects have magnitudes fainter than Ks ~ 12 mag and are located at latitudes of lower than b = −7 deg.
In our targetsSE list, we find 136 out of the 182 2MXSC galaxies, and therefore we are able to recover 75% of the catalogued 2MASS galaxies. From the 46 lost objects, 6 of them do not have magnitude measurements in all VVV bands and 40 have (J-Ks) < 0.95 mag, which is our colour selection limit. Figure 8 shows (J-Ks) vs. Ks colour–magnitude diagrams of the 2MXS galaxies studied here. We consider extinction-corrected aperture magnitudes. In this plot, we show galaxies lost by the (J-Ks) cut and also four galaxies with unreliable measurements in Z and Y VVV bands. On the right-hand side of this figure, we plot a densogram based on the (J-Ks) colour distribution of the sources; as can be seen, most 2MXSC galaxies are grouped around the (J − Ks) = 0.95 mag limit adopted in this work. Figure 8 also shows the completeness in terms of 2MXSC galaxies as a function of Ks extinction-corrected aperture magnitude. The completeness rate is almost constant, with differences only in the faintest bin where it drops from 75 to 40%.
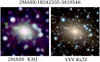 |
Fig. 6 RGB images of the galaxy 2MASX-18242335-3410546: KHJ 2MASS (left) and KsJZ (right). The images size is 1 arcmin × 1 arcmin. |
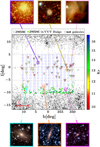 |
Fig. 7 Sky distribution of objects in the VVV bulge area. Cyan open squares represent the position of the VVV tiles. Grey dots are the 2MXSC sources and points represent the 2MXSC sources within the VVV bulge (colour-coded according to their Ks extinction-corrected aperture magnitude). Open triangles represent extended objects that are not galaxies. In the top of the figure, we show three RGB (KsJZ) images of 2MXSC objects associated with Galactic objects and in the bottom we show three examples of 2MXSC galaxies. |
5.2 Comparison with G21 galaxy candidates
VVV bulge tile b204 was analysed in G21 in a search for galaxy candidates. This tile is a region of 1.475 × 1.109 deg2 located at the edge of the VVV bulge (l = 355.182o and b = −9.68974o). G21 present a catalogue of 624 galaxy candidates with total magnitudes in the range of 10 < Ks < 17.5 and only 18 of these objects have been previously catalogued.
In this section, we re-explore tile b204 with our new selection criteria. Of the original 624 catalogued sources in G21, 275 are within the area covered by the extinction map used in this work (no extinction values for b < −10.1 deg and b > 5.1 deg) and have magnitudes 10 mag < Ks < 16.2 mag, the range considered in G21 to select reliable galaxies (hereafter G21 galaxies). From these G21 galaxies, 212 are in our targetsSE list. We lose 18 sources with unavailable photometry in all VVV bands, 11 that do not fulfill the colour cut (J-Ks) > 0.95 mag, and 34 sources that do not pass SE selection given that G21 adopt a more flexible restriction R1/2 > 0.7 arcsec. Therefore, we recover 77% of the G21 galaxies within the magnitude range under consideration.
Moreover, using the methodology adopted in this work, we select 88 new extended sources in tile b204, allowing the identification of a similar number of 10 mag < Ks < 16.2 mag galaxy candidates to that selected using the G21 methodology (300 in this work vs. 275 in G21). Figure 9 shows the sky distribution of these sources.
Figure 10 shows (J-Ks) vs. Ks colour-magnitude diagrams of the G21 galaxies and extended sources in tile b204. We consider extinction-corrected aperture magnitudes. In this plot, crosses show G21 galaxies lost either by the (J-Ks) cut, the requirement of available photometry in all VVV bands, or the limit in the R1/2 SE star–galaxy separation parameter. Most G21 galaxies that do not fulfill R1/2 > 1 arcsec are located in the fainter region of the diagram. G21 galaxies lost by the colour cut present (J-Ks) colour close to our demarcation line. In G21, we restrict our selection of galaxy candidates to sources with (J-Ks) > 0.97 mag; therefore, the discrepancy in the galaxy colours is a consequence of differences in both the photometry and the extinction maps used in this work compared to G21. Also, G21 galaxies with no available photometry in at least one of the ZYJHKs bands are located in the faint region of the sample with mean Ks = 15.8 mag.
In the right region of this figure, we also plot a densogram based on the (J-Ks) colour distribution of the sources; as can be seen, most galaxies are grouped well above the adopted cut (J-Ks) = 0.95 mag. Figure 10 also shows the fraction of recovered G21 galaxies, that is the completeness, as a function of Ks extinction-corrected aperture magnitude. From this figure, it can be seen that completeness rate is almost 100% for bright galaxies and drops to levels closer to 80% only for Ks > 15 mag. Nevertheless, this is the magnitude range where we add 88 galaxy candidates to tile b204. The large error bars in the bright bins are statistically associated to the small number of extended objects with Ks < 14 mag in the G21 sample.
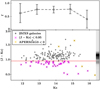 |
Fig. 8 Colour-magnitude diagram (J-Ks) vs. Ks of the 2MXSC galaxies (grey dots). We consider VVV extinction-corrected aperture magnitudes. Crosses show galaxies that were not detected using our methodology; the sources lost by the (J-Ks) cut are shown in pink and two galaxies with unreliable measurements in Z and Y VVV bands in yellow. On the right-hand side of this figure, we plot a densogram based on the (J-Ks) colour distribution of the sources. In the upper panel, we show the completeness in terms of 2MXS galaxies as a function of Ks magnitude. |
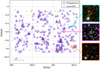 |
Fig. 9 Sky distribution of G21 10 mag < Ks < 16.2 mag galaxy candidates (blue triangles) and extended sources identified in this work within tile b204 (red dots). On the right-hand side of the figure, we show one example of a G21 galaxy that matches our extended source list (top), an extended source that has not been identified in G21 (middle), and a G21 galaxy that does not fulfill our extended selection criteria (bottom), respectively. The images are 1 arcmin × 1 arcmin. |
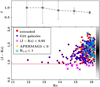 |
Fig. 10 Colour-magnitude diagrams (J-Ks) vs. Ks for the extended objects in tile b204 (red dots) and G21 galaxies (blue dots). We consider VVV extinction-corrected aperture magnitudes. Crosses show galaxies not detected with our methodology, with the sources lost by the (J-Ks) cut in pink, sources with R1/2 < 1 arcsec in cyan, and galaxies with unreliable measurements in the Z and Y VVV bands in yellow. On the right-hand side of this figure, we plot a densogram based on the (J-Ks) colour distribution of the sources. In the upper panel, we show the fraction of recovered G21 galaxies as a function of Ks magnitude. Error bars are associated to standard errors. |
6 Galaxy candidates in the VVV bulge
The results from the previous section highlight the efficiency of our selection criteria in identifying extended sources associated with galaxies in the VVV bulge area. Nevertheless, the process of identifying galaxy candidates in this challenging sky region entails the downloading and processing of 191 879 images in five photometric bands (each one of about 165 Kb). To this end, we used the wget option of the multiget_image VSA tool to download ZYJHKs images of the sources. Taking into account the wget restriction on the maximum number of images, we split the data into 90 files, each one containing about 2000 targets, and downloaded images of these sources. We used AstroPy (Astropy Collaboration 2022) in a Python program to access the header of each image and to extract important information, such as as zero-point magnitudes and seeing, to be entered into the SE parameter file. We then ran SE on each individual image, considering its specific header information and obtained the star–galaxy separation parameters that allow the sample to be cleaned of Galactic sources. In this way, we retain 38 718 sources to be visually inspected in the search for extended objects. After visual inspection, we obtained a sample of 14 480 extended objects (hereafter VVV bulge galaxies) and 24 238 sources associated with stars in our Galaxy.
6.1 The role of stellar density and Galactic absorption
The VVV bulge area is a complex region because the stellar density grows towards the Galactic centre, compromising the identification of extragalactic sources in crowded fields. Moreover, the absorption levels at low Galactic latitudes are as high as 2.5 mag in Ks-band, preventing the light of background galaxies from reaching us.
We studied the variation of the Galactic sources (blended stars and saturated objects) and VVV bulge galaxies in the targetsSE sample as a function of stellar-density and Ks–band absorption. To map the stellar density in the VVV bulge, we selected a sample of stars with Ks ~ 13 mag. This magnitude was chosen in order to avoid bright objects, and because the errors grow exponentially for fainter source magnitudes (Saito et al. 2012). In this way, we selected nearly 800 000 stars in the entire VVV-bulge region. To map galactic absorption, we downloaded Ks band absorption corrections from the 3D map described in Chen et al. (2013), considering a radius of 10 kpc to calculate the integrated absorption of the Milky Way. This map comprises 30 200 pixels regularly distributed in the VVV bulge area.
Figure 11 shows the density distribution of the Ks ~ 13 mag star sample. We pixelated the VVV-bulge region in 7 acrmin × 7 arcmin pixels and calculated the star density within 1 square degree. The overlapping regions between VVV tiles appear as regions of higher stellar density. We also show the absorption map colour-coded according to Ks-band absorption values. On these maps, we over impose ten isodensity contours representing the distribution of the galactic sources in the targetsSE sample. Also, we plot the sky position of the extended objects that are galaxy candidates in the VVV bulge.
This figure leads us to a few conclusions. As expected, there is an increase in both absorption and stellar density towards regions of low galactic latitude. We studied the variation in the over-density  of stars as a function of Galactic latitude and compared this trend with that of Galactic sources and VVV bulge galaxies. We find that the density of stars increases towards low galactic latitudes, but that Galactic sources in the targetsSE sample present a decrease in the distribution at |b| < 2 deg. For galaxies the density is highly increased for Galactic latitudes b < −5 deg and we found a lack of galaxies at low latitudes (see right plot of left panel in Fig. 11).
We also studied the variation in Ks mean Galactic absorption (AKs) as a function of Galactic latitude. We find an increase in the mean AKs values towards low latitudes and a lack of extended objects associated with the absorption peak AKs = 2 mag at |b| < 2 deg. On the other hand, Galactic sources follow the distribution of the Chen et al. (2013) extinction map (see right plot of Fig. 11 left panel).
In conclusion, we find that, as expected, stellar crowding and Galactic absorption strongly affect our ability to identify galaxies behind the Galactic bulge. Using our methodology, only when the stellar density is lower than the mean and when the absorption AKs is lower than 0.5 mag is it possible to identify galaxies in the VVV bulge region with confidence.
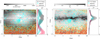 |
Fig. 11 Sky distribution of stellar sources and exteded galaxy candidates in the VVV bulge. The cyan contours represent ten iso-density regions of Galactic sources in our targetsSE sample. The dots represent extended sources. Left: stellar density in the VVV bulge. We consider stars with Ks ~ 13.0. Right: mean absorption in the Ks band calculated considering a distance of 10 kpc. |
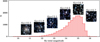 |
Fig. 12 Ks total magnitude distribution of VVV bulge galaxies. We show 30 arcsec × 30 arcsec KsJZ RGB stamp images of illustrative examples of galaxies in different magnitude bins. |
6.2 Visual inspection methodology
Visual inspection is a crucial step in the identification of galaxy candidates in the VVV bulge data. Therefore, we follow a specific and controlled procedure in this classification step. First, we build KsJZ RGB images with WCS information and link these files to each target in our targetsSE catalogue. We then use TOPCAT (Taylor 2005) to load our catalogue and display the images using Activation Actions. We also verify the sources independently using the Displaying HiPS cutout from VVV DR4 colour JYZ images. We perform this step to be sure that we are visually inspecting the correct object. The combination of JYZ images is not as suitable as KsJZ for identifying extended sources, but we still implement this independent verification step.
The visual inspection was carried by seven authors that were trained to classify targetsSE as extended objects or Galactic sources associated with blended and/or saturated stars. To study the error in the classification, all the astronomers classified a sample of 2000 random sources from the targetsSE catalogue. Based on this study, we calculated a 7% average error associated with the visual inspection. This percentage is lower for brighter galaxies (4%) and increases towards fainter objects reaching values of closer to 10%. Therefore, we mostly expect discrepancies for the faintest objects in our catalogue. Figure 12 shows the total Ks magnitude distribution of this sample together with illustrative examples of extended sources in different magnitudes bins. This figure shows how ambiguous the visual inspection can become for sources fainter than total Ks ~ 15 mag.
As a result of this study, we find more than 14 000 VVV bulge galaxies that were identified as extended sources in the VVV bulge region. Moreover, we obtain SE photometry in ZYJHKs bands for all these sources, making this sample the largest galaxy catalogue to date in this area of the sky.
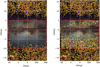 |
Fig. 13 Distribution of galaxies in a region of |1| < 10 deg |b| < 15 deg. We show a RGB JYZ VVV image superimposed on the false-colour KHJ 2MASS image. The left panel shows the distribution of 2MXSC galaxies and in the right panel we plot around 2000 VVV bulge galaxy candidates with SE total magnitude of Ks < 13.5 mag. |
6.3 A new picture of the Universe hidden behind the Galactic bulge
The previous largest catalogue of galaxies in the VVV bulge region is the 2MXSC. As stated in Sect. 5.1, there are only 271 galaxy-type 2MASS extended sources in the area of the sky studied in the present paper. Moreover, most 2MXSC galaxies are located at |b| > 7 deg. Therefore, it is interesting to explore how the VVV bulge galaxies help us to complete the picture of the Universe at low Galactic latitudes. To this end, we studied the distribution of galaxies in a region of |1| < 10 deg |b| < 15 deg. We considered the magnitude limit of 2MASS sources and selected galaxies brighter than Ks = 13.5 mag, considering total magnitudes from 2MXSC and also from our sample of VVV bulge galaxies. Figure 13 shows a RGB JYZ VVV image superimposed on the KHJ 2MASS image. The left panel of the image shows the distribution of 2MXS galaxies and in the right panel we also plot around 2000 VVV bulge galaxy candidates with a SE total magnitude of Ks < 13.5 mag. From this figure, it is clear how the catalogue of galaxies obtained in this work significantly develops our knowledge of the Universe in this challenging area of the sky. The northern region at b > 5 deg has been mapped by the bulge-high VVVX survey and is currently under study.
7 Summary and conclusions
In this work, we define selection criteria to target extended sources in the VVV bulge region (|l| < 10.0, −10.0 < b < 5.0).
We used the VSA facilities to extract relevant photometric information on catalogued sources and also to download images upon which we ran SE to obtain specific star–galaxy separation parameters as well as suitable photometry of extended sources.
We find that combining initial photometric restrictions on sources from the VSA vvvSource table with restrictions on star–galaxy separation parameters obtained from SE is a successful strategy for achieving acceptable levels of contamination and high completeness in the construction of a sample suitable for the identification of galaxy candidates in the VVV bulge. Moreover, based on our study of a representative random sample of 2000 objects obtained from the vvvSource table, we find that, when considering non-aperture-corrected magnitudes APERMAG3, the following restrictions are the most suitable constraints in order to lower the initial contamination levels from 99 to 60% while retaining a completeness of about 80% in the selection of extended sources:
mergedClass = 1.
10 < Ks < 16.2.
APERMAG3 > 0 in ZYJHKs bands.
J-H > 0, H-Ks > 0, J-Ks > 0.95.
CS < 0.5 and R1/2 >1 arcsec.
With these restrictions, we selected 38718 targets from the ~3.7 billion catalogued sources (10 mag < Ks < 17 mag) in the vvvSource table. Nevertheless, we expected only one-third of these targets to be galaxy-like. Therefore, visual inspection is crucial in the identification of galaxy candidates in VVV bulge data and we followed a specific and controlled procedure in this classification step. We trained seven astronomers to classify targets into extended galaxy-like objects or blend and/or saturated sources associated with stars in our Galaxy. The visual inspection was carried on KsJZ false-colour RGB images linked to each catalogued target. We used this specific band combination in order to highlight the red colour of galaxies against the bluer foreground stars. The visual inspection gave rise to a catalogue of more than 14 000 galaxy candidates with total Ks magnitudes in the range of 9.5 mag < Ks < 16.5 mag. These sources are distributed avoiding the most crowded regions of the VVV bulge and also considering that absorption hampers the identification at |b| < 2 deg.
We tested our target selection criteria with previously catalogued galaxies from the 2MXSC and G21 samples. We find that, using our methodology, we are able to recover 75% of the catalogued 2MASS galaxies in the VVV bulge region and 77% of G21 galaxies in tile b204. Therefore, the completeness of our catalogue based on previous catalogued galaxies is higher than 75%.
The catalogue presented in this work comprises 14 480 galaxy candidates in the VVV bulge region and is the largest catalogue in the ZOA to date. Moreover, as the VISTA photometry is compatible with 2MASS, our galaxy catalogue fills the region of the Galactic bulge (|1| < 10 deg) from b = −10 deg to b = −2 deg, providing homogeneous coverage of the region when considering galaxies with Ks < 13.5 mag. Furthermore, we are currently processing VVVX data to expand the coverage to higher Galactic latitudes.
Although spectroscopic measurements are essential to map the position of these galaxy candidates, the results obtained in the present work provide a much more detailed picture of the Universe hidden behind the curtain of stars, dust, and gas in the unexplored Milky Way bulge region.
Several comprehensive studies of this catalogue will be presented in forthcoming papers, including a detailed description of the photometric properties of galaxy candidates, the density environment at different scales from pairs to clusters, the active galactic nucleus activity, and also a photometric redshift estimation of a suitable sample of galaxies in our catalogue. A forthcoming paper will describe and present the full catalogue of VVV bulge galaxies.
This paper, in conjunction with previous works, demonstrates the potential of the VVV/VVVX survey to find and study a large number of galaxies and extragalactic structures obscured by the Milky Way, enlightening our knowledge of the Universe in this challenging and impressive region of the sky.
Acknowledgements
F.D. specially thanks to Mike Read and VSA team for their helpful support. This work was supported in part by the Consejo Nacional de Investigaciones Científicas y Técnicas de la República Argentina (CONICET) and Secretaría de Ciencia y Técnica de la Universidad Nacional de San Juan. The authors gratefully acknowledge data from the ESO Public Survey program ID 179.B-2002 taken with the VISTA telescope, and products from VISTA Science Archive (VSA). V.M. also acknowledges support from project DIDULS Regular N° PR2353857. This research made use of Astropy (http://www.astropy.org), a community-developed core Python package for Astronomy (Astropy Collaboration 2013, 2018) and TOPCAT- Tool for Operations on Catalogues And Tables (Taylor 2005).
References
- Amôres, E. B., Sodré, L., Minniti, D., et al. 2012, AJ, 144, 127 [Google Scholar]
- Astropy Collaboration (Robitaille, T. P., et al.) 2013, A&A, 558, A33 [NASA ADS] [CrossRef] [EDP Sciences] [Google Scholar]
- Astropy Collaboration (Price-Whelan, A. M., et al.) 2018, AJ, 156, 123 [Google Scholar]
- Astropy Collaboration (Price-Whelan, A. M., et al.) 2022, ApJ, 935, 167 [NASA ADS] [CrossRef] [Google Scholar]
- Baravalle, L. D., Alonso, M. V., Nilo Castellón, J. L., Beamín, J. C., & Minniti, D. 2018, AJ, 155, 46 [Google Scholar]
- Baravalle, L. D., Nilo Castellón, J. L., Alonso, M. V., et al. 2019, ApJ, 874, 46 [Google Scholar]
- Baravalle, L. D., Alonso, M. V., Minniti, D., et al. 2021, MNRAS, 502, 601 [NASA ADS] [CrossRef] [Google Scholar]
- Beamín, J. C., Minniti, D., Gromadzki, M., et al. 2013, A&A, 557, L8 [NASA ADS] [CrossRef] [EDP Sciences] [Google Scholar]
- Bertin, E., & Arnouts, S. 1996, A&AS, 117, 393 [NASA ADS] [CrossRef] [EDP Sciences] [Google Scholar]
- Chen, B. Q., Schultheis, M., Jiang, B. W., et al. 2013, A&A, 550, A42 [NASA ADS] [CrossRef] [EDP Sciences] [Google Scholar]
- Coldwell, G., Alonso, S., Duplancic, F., et al. 2014, A&A, 569, A49 [NASA ADS] [CrossRef] [EDP Sciences] [Google Scholar]
- Ebeling, H., Mullis, C. R., & Tully, R. B. 2002, ApJ, 580, 774 [Google Scholar]
- Emerson, J. P., & Sutherland, W. J. 2010, SPIE Conf. Ser., 7733, 773306 [NASA ADS] [Google Scholar]
- Emerson, J. P., Irwin, M. J., Lewis, J., et al. 2004, SPIE Conf. Ser., 5493, 401 [Google Scholar]
- Emerson, J., Irwin, M., & Hambly, N. 2006, SPIE Conf. Ser., 6270, 62700S [NASA ADS] [Google Scholar]
- Galdeano, D., Pereyra, L., Duplancic, F., et al. 2021, A&A, 646, A146 [NASA ADS] [CrossRef] [EDP Sciences] [Google Scholar]
- Galdeano, D., Coldwell, G., Duplancic, F., et al. 2022, A&A, 663, A158 [NASA ADS] [CrossRef] [EDP Sciences] [Google Scholar]
- Galdeano, D., Ferrero, G. A., Coldwell, G., et al. 2023, A&A, 669, A7 [NASA ADS] [CrossRef] [EDP Sciences] [Google Scholar]
- Hambly, N. C., Mann, R. G., Bond, I., et al. 2004, SPIE Conf. Ser., 5493, 423 [NASA ADS] [Google Scholar]
- Hambly, N. C., Collins, R. S., Cross, N. J. G., et al. 2008, MNRAS, 384, 637 [NASA ADS] [CrossRef] [Google Scholar]
- Huchra, J. P., Macri, L. M., Masters, K. L., et al. 2012, VizieR Online Data Catalog: J/ApJS/199/26 [Google Scholar]
- Irwin, M. J., Lewis, J., Hodgkin, S., et al. 2004, SPIE Conf. Ser., 5493, 411 [Google Scholar]
- Ivanov, V. D., Minniti, D., Hempel, M., et al. 2013, A&A, 560, A21 [NASA ADS] [CrossRef] [EDP Sciences] [Google Scholar]
- Jarrett, T. H., Chester, T., Cutri, R., et al. 2000, AJ, 119, 2498 [Google Scholar]
- Koribalski, B. S., Staveley-Smith, L., Kilborn, V. A., et al. 2004, AJ, 128, 16 [Google Scholar]
- Kraan-Korteweg, R. C., & Lahav, O. 2000, A&ARv, 10, 211 [Google Scholar]
- Kron, R. G. 1980, ApJS, 43, 305 [Google Scholar]
- Macri, L. M., Kraan-Korteweg, R. C., Lambert, T., et al. 2019, ApJS, 245, 6 [Google Scholar]
- Minniti, D. 2016, in Galactic Surveys: New Results on Formation, Evolution, Structure and Chemical Evolution of the Milky Way, 10 [Google Scholar]
- Minniti, D., Lucas, P. W., Emerson, J. P., et al. 2010, New Astron., 15, 433 [Google Scholar]
- Minniti, D., Hempel, M., Toledo, I., et al. 2011, A&A, 527, A81 [NASA ADS] [CrossRef] [EDP Sciences] [Google Scholar]
- Mori, H., Maeda, Y., Furuzawa, A., Haba, Y., & Ueda, Y. 2013, PASJ, 65, 102 [NASA ADS] [Google Scholar]
- Nishiyama, S., Tamura, M., Hatano, H., et al. 2009, ApJ, 696, 1407 [NASA ADS] [CrossRef] [Google Scholar]
- Paturel, G., Vauglin, I., Petit, C., et al. 2005, A&A, 430, 751 [NASA ADS] [CrossRef] [EDP Sciences] [Google Scholar]
- Roman, A. T., Nakanishi, K., & Saito, M. 1998, PASJ, 50, 37 [Google Scholar]
- Saito, R. K., Hempel, M., Minniti, D., et al. 2012, A&A, 537, A107 [NASA ADS] [CrossRef] [EDP Sciences] [Google Scholar]
- Schröder, A. C., Flöer, L., Winkel, B., & Kerp, J. 2019, MNRAS, 489, 2907 [Google Scholar]
- Shapley, H. 1961, Galaxies (USA: Harvard University Press) [Google Scholar]
- Skrutskie, M. F., Cutri, R. M., Stiening, R., et al. 2006, AJ, 131, 1163 [NASA ADS] [CrossRef] [Google Scholar]
- Staveley-Smith, L., Kraan-Korteweg, R. C., Schroder, A. C., et al. 2016, AJ, 151, 52 [NASA ADS] [CrossRef] [Google Scholar]
- Taylor, M. B. 2005, ASP Conf. Ser., 347, 29 [Google Scholar]
- Vauglin, I., Rousseau, J., Paturel, G., et al. 2002, A&A, 387, 1 [NASA ADS] [CrossRef] [EDP Sciences] [Google Scholar]
- Woudt, P. A., Kraan-Korteweg, R. C., Cayatte, V., Balkowski, C., & Felenbok, P. 2004, A&A, 415, 9 [NASA ADS] [CrossRef] [EDP Sciences] [Google Scholar]
All Tables
Numbers of extended objects, saturated sources, and blended stars in the random sample (mergedClass =1, 10 mag < Ks < 16.2 mag, J-Ks > 0.5 mag, H-Ks > 0 mag, J-H > 0 mag), considering different restrictions in VVV photometry and SE star–galaxy separation parameters.
All Figures
|
Fig. 1 Examples of the different classes of objects identified in the VVV bulge region, saturated sources (left), blended stars (middle), and extended objects (right). The RGB images are a combination of KsJZ filters. Each image has a dimension of 1 arcmin × 1 arcmin. |
| In the text | |
|
Fig. 2 Sky distribution of the 7.5 million sources selected from the VSA VVV-DR5 catalogue, considering mergedClass = 1, 10 mag < Ks < 16.2 mag, J-Ks > 0.5 mag, H-Ks > 0 mag, J-H > 0 mag. We pixelated the VVV bulge region in pixels of 7 arcmin × 7 arcmin, and colour coded them according to the density per square degree. We also show the distribution of extended objects, saturated sources, and blended stars in a sample of 2000 random sources. The right panel shows the overdensity as a function of Galactic latitude for the entire sample and also for the different classes of sources in the random sample. Error bars correspond to 1σ values. |
| In the text | |
|
Fig. 3 Colour-magnitude diagrams (J-Ks) versus Ks for sources in the random sample considering extinction-corrected aperture magnitudes. We present saturated sources as black diamonds, blended stars as blue open circles, and extended objects as red dots. Long-dashed lines correspond to the (J-Ks) = 0.95 mag colour cut adopted in this work. In the top and right panels, we plot the normalised distributions of colour and magnitude, respectively (short dashed line for saturated sources, long dashed line for blended stars, and red solid line for extended objects). |
| In the text | |
|
Fig. 4 Distribution of R1/2 (in arcsec) versus CS for sources in the random sample. We present saturated sources as black diamonds, blended stars as blue open circles, and extended objects as red dots. Long-dashed lines correspond to the CS and R1/2 cuts adopted in this work. In the top and right panels, we plot the normalised distributions of R1/2 and CS, respectively (short dashed line for saturated sources, long dashed line for blended stars, and red solid line for extended objects). |
| In the text | |
|
Fig. 5 Fraction of extended objects (red solid line), saturated sources (black short–dashed line), and blended stars (blue long–dashed line) in the random sample as a function of Ks extinction-corrected aperture magnitude. Left panel: original fractions. Right panel: fractions after considering the final restrictions. Error bars represent the standard error of the fractions. |
| In the text | |
|
Fig. 6 RGB images of the galaxy 2MASX-18242335-3410546: KHJ 2MASS (left) and KsJZ (right). The images size is 1 arcmin × 1 arcmin. |
| In the text | |
|
Fig. 7 Sky distribution of objects in the VVV bulge area. Cyan open squares represent the position of the VVV tiles. Grey dots are the 2MXSC sources and points represent the 2MXSC sources within the VVV bulge (colour-coded according to their Ks extinction-corrected aperture magnitude). Open triangles represent extended objects that are not galaxies. In the top of the figure, we show three RGB (KsJZ) images of 2MXSC objects associated with Galactic objects and in the bottom we show three examples of 2MXSC galaxies. |
| In the text | |
|
Fig. 8 Colour-magnitude diagram (J-Ks) vs. Ks of the 2MXSC galaxies (grey dots). We consider VVV extinction-corrected aperture magnitudes. Crosses show galaxies that were not detected using our methodology; the sources lost by the (J-Ks) cut are shown in pink and two galaxies with unreliable measurements in Z and Y VVV bands in yellow. On the right-hand side of this figure, we plot a densogram based on the (J-Ks) colour distribution of the sources. In the upper panel, we show the completeness in terms of 2MXS galaxies as a function of Ks magnitude. |
| In the text | |
|
Fig. 9 Sky distribution of G21 10 mag < Ks < 16.2 mag galaxy candidates (blue triangles) and extended sources identified in this work within tile b204 (red dots). On the right-hand side of the figure, we show one example of a G21 galaxy that matches our extended source list (top), an extended source that has not been identified in G21 (middle), and a G21 galaxy that does not fulfill our extended selection criteria (bottom), respectively. The images are 1 arcmin × 1 arcmin. |
| In the text | |
|
Fig. 10 Colour-magnitude diagrams (J-Ks) vs. Ks for the extended objects in tile b204 (red dots) and G21 galaxies (blue dots). We consider VVV extinction-corrected aperture magnitudes. Crosses show galaxies not detected with our methodology, with the sources lost by the (J-Ks) cut in pink, sources with R1/2 < 1 arcsec in cyan, and galaxies with unreliable measurements in the Z and Y VVV bands in yellow. On the right-hand side of this figure, we plot a densogram based on the (J-Ks) colour distribution of the sources. In the upper panel, we show the fraction of recovered G21 galaxies as a function of Ks magnitude. Error bars are associated to standard errors. |
| In the text | |
|
Fig. 11 Sky distribution of stellar sources and exteded galaxy candidates in the VVV bulge. The cyan contours represent ten iso-density regions of Galactic sources in our targetsSE sample. The dots represent extended sources. Left: stellar density in the VVV bulge. We consider stars with Ks ~ 13.0. Right: mean absorption in the Ks band calculated considering a distance of 10 kpc. |
| In the text | |
|
Fig. 12 Ks total magnitude distribution of VVV bulge galaxies. We show 30 arcsec × 30 arcsec KsJZ RGB stamp images of illustrative examples of galaxies in different magnitude bins. |
| In the text | |
|
Fig. 13 Distribution of galaxies in a region of |1| < 10 deg |b| < 15 deg. We show a RGB JYZ VVV image superimposed on the false-colour KHJ 2MASS image. The left panel shows the distribution of 2MXSC galaxies and in the right panel we plot around 2000 VVV bulge galaxy candidates with SE total magnitude of Ks < 13.5 mag. |
| In the text | |
Current usage metrics show cumulative count of Article Views (full-text article views including HTML views, PDF and ePub downloads, according to the available data) and Abstracts Views on Vision4Press platform.
Data correspond to usage on the plateform after 2015. The current usage metrics is available 48-96 hours after online publication and is updated daily on week days.
Initial download of the metrics may take a while.