Fig. 3
Download original image
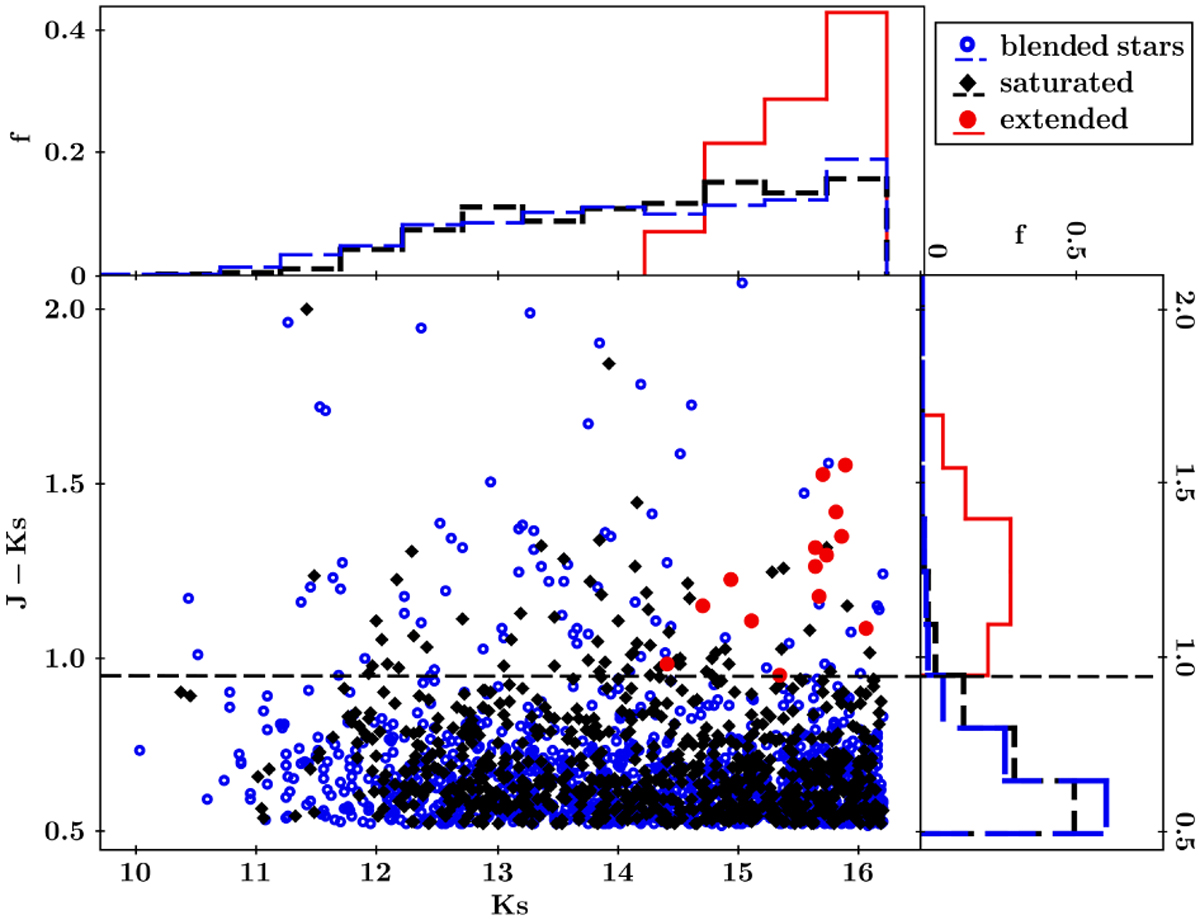
Colour-magnitude diagrams (J-Ks) versus Ks for sources in the random sample considering extinction-corrected aperture magnitudes. We present saturated sources as black diamonds, blended stars as blue open circles, and extended objects as red dots. Long-dashed lines correspond to the (J-Ks) = 0.95 mag colour cut adopted in this work. In the top and right panels, we plot the normalised distributions of colour and magnitude, respectively (short dashed line for saturated sources, long dashed line for blended stars, and red solid line for extended objects).
Current usage metrics show cumulative count of Article Views (full-text article views including HTML views, PDF and ePub downloads, according to the available data) and Abstracts Views on Vision4Press platform.
Data correspond to usage on the plateform after 2015. The current usage metrics is available 48-96 hours after online publication and is updated daily on week days.
Initial download of the metrics may take a while.