| Issue |
A&A
Volume 698, June 2025
|
|
|---|---|---|
| Article Number | A214 | |
| Number of page(s) | 12 | |
| Section | Catalogs and data | |
| DOI | https://doi.org/10.1051/0004-6361/202554268 | |
| Published online | 17 June 2025 | |
Enlightening the Universe behind the Milky Way bulge
II. Morphological classification and galaxy properties
1
Departamento de Geofísica y Astronomía, CONICET, Facultad de Ciencias Exactas, Físicas y Naturales, Universidad Nacional de San Juan,
Av. Ignacio de la Roza 590 (O),
J5402DCS,
Rivadavia, San Juan,
Argentina
2
Centre for Astrophysics Research, University of Hertfordshire,
College Lane,
Hatfield
AL10 9AB,
UK
3
Instituto de Astronomía Teórica y Experimental (IATE-CONICET),
Laprida 854,
X5000BGR,
Córdoba,
Argentina
4
Observatorio Astronómico de Córdoba, Universidad Nacional de Córdoba (OAC-UNC),
Laprida 854,
X5000BGR,
Córdoba,
Argentina
5
Departamento de Astronomía, Universidad de La Serena.
Av. Raul Bitrán 1305,
La Serena,
Chile
6
Association of Universities for Research in Astronomy (AURA),
Av. Juan Cisternas 1500,
La Serena,
Chile
7
Grupo de Astrofísica Extragaláctica-IANIGLA, CONICET, Universidad Nacional de Cuyo (UNCuyo),
Gobierno de Mendoza, Parque Gral San Martín, CC 330,
CP
5500
Mendoza,
Argentina
8
Instituto de Astrofísica, Facultad de Ciencias Exactas, Universidad Andres Bello,
Av. Fernandez Concha 700,
Las Condes, Santiago,
Chile
9
Vatican Observatory,
V00120
Vatican City State,
Italy
10
Institute of Astronomy, University of Cambridge,
Madingley Rd,
Cambridge
CB3 0HA,
UK
★ Corresponding author: This email address is being protected from spambots. You need JavaScript enabled to view it.
Received:
25
February
2025
Accepted:
29
April
2025
Abstract
Context. The detection of extragalactic sources beyond the Milky Way is limited by the location of the Solar system. In the zone of avoidance (ZOA), optical observations are hindered by stellar crowding and Galactic absorption. To fully understand the background galaxy population in this region, observations at longer wavelengths are needed.
Aims. The objective of this study is to determine the characteristics of galaxies that are situated behind the Milky Way bulge through the use of near-infrared (NIR) data obtained from the VISTA Variables in Vía Láctea (VVV) survey.
Methods. The galaxy candidates were visually confirmed, and a morphological classification of all sources was performed based on their appearance, by differentiating between elliptical, spiral, undefined, and doubtful galaxies. Additionally, the surrounding area was classified based on the number of sources that are detected in the same target field. Isolated galaxies, galaxies with close companions, and galaxies in denser environments were catalogued.
Results. Following a visual inspection, 14 480 galaxy candidates were classified morphologically: 3702 as elliptical, 1704 as spiral, 6425 as undefined, and 2649 as doubtful. The environmental classification showed that 73.9% were isolated, 12.4% had close companions, and 13.7% were in denser environments. Our catalogue shows slower proper motions than star catalogues. The majority of galaxies that are classified as elliptical and spiral manifest SExtractor parameters that are indicative of this category of sources. Additionally, elliptical galaxies in denser environments appear to be redder than spiral galaxies in isolated environments.
Conclusions. A total of 14 480 galaxy candidates were subjected to a morphological classification in the region of the Milky Way bulge. This result verifies the efficacy of the VVV/VVVX survey in identifying and characterising a diverse range of galaxies and extragalactic structures that are obscured by the Milky Way. The survey thereby contributes to a more profound understanding of the Universe in the ZOA.
Key words: catalogs / surveys / galaxies: general / galaxies: statistics / infrared: galaxies
© The Authors 2025
 Open Access article, published by EDP Sciences, under the terms of the Creative Commons Attribution License (https://creativecommons.org/licenses/by/4.0), which permits unrestricted use, distribution, and reproduction in any medium, provided the original work is properly cited.
This article is published in open access under the Subscribe to Open model. This email address is being protected from spambots. You need JavaScript enabled to view it. to support open access publication.
1 Introduction
The observation of extragalactic sources beyond the Milky Way is a constant challenge because of Galactic dust absorption. In this region of the sky, which is known as the zone of avoidance (ZOA), local dust and stars obstruct optical observations, which hinders the data retrieval and provides an incomplete picture of the existing galaxies. Consequently, the extragalactic structures beyond the ZOA remain poorly understood.
The absence of information on galaxies located in the ZOA was first noted by Shapley (1961). As the ZOA encompasses approximately 25% of the optically visible galaxy distribution in the sky (Kraan-Korteweg & Lahav 2000), optical catalogues have enabled the detection of some new galaxies at a low Galactic latitude (Kraan-Korteweg & Lahav 2000; Woudt et al. 2004). However, observations are impeded by Galactic absorption, which also hinders the gathering of information. Nevertheless, near-infrared (NIR), X-ray, and H I radio surveys (Roman et al. 1998; Ebeling et al. 2002; Vauglin et al. 2002; Koribalski et al. 2004; Paturel et al. 2005; Skrutskie et al. 2006; Huchra et al. 2012) have demonstrated that we can identify galaxies and galaxy clusters at low Galactic latitude.
Over the past two decades, significant resources have been dedicated to identifying the underlying sources and structures of the ZOA. For instance, Jarrett et al. (2000) developed fundamental algorithms and operations for detecting, identifying, characterising, and extracting extended sources from the Two Micron All-Sky Survey (2MASS) catalogue. In addition, Nagayama et al. (2004) conducted a deep NIR survey of 19 obvious galaxies and 38 galaxy candidates in a 36′× 36′ region centred on the giant elliptical radio galaxy PKS 1343–601. This survey revealed that this galaxy is the core of an unknown rich cluster in the region of the Great Attractor. Moreover, Skelton et al. (2009) published a deep Ks-band photometric catalogue of 390 sources (235 galaxies and 155 galaxy candidates) around the core of the nearby rich Norma cluster (ACO3627) in a region of 45′× 45′.
The region known as the Great Attractor has also been the focus of observation by the H I Parkes All-Sky Survey (Staveley-Smith et al. 2016) over the past ten years. This indicated the potential existence of a large-scale structure in this region. These large-scale structures may be part of a filamentary structure at the edge of the local volume. Furthermore, Macri et al. (2019) provided redshifts for 1041 2MASS Redshift Survey galaxies that previously lacked this information. The majority of these galaxies lie within the zone of avoidance. Moreover, Schröder et al. (2019) published a catalogue of 170 galaxies in the northern region of the ZOA, extracted from the shallow version of the blind HI survey with the Effelsberg 100 m radio telescope (EBHIS). In addition, results suggest that at higher Galactic latitudes, the Great Attractor and the Ophiuchus cluster might be linked. The Ophiuchus cluster is located behind the Galactic bulge (Steyn et al. 2024). The recent findings represent a significant step forward in our understanding of the zone, and they highlight the potential for further exploration in this region. However, it is important to acknowledge that the entire area is still inconsistently covered. This unexplored territory offers an exciting opportunity for future research, as it may yield new discoveries and contribute to the expansion of our knowledge base.
In particular, the NIR public survey VISTA Variables in Vía Láctea (VVV, Minniti et al. 2010; Saito et al. 2012, 2024) has proven to be an invaluable tool for the exploration and study of extragalactic objects within the zone of avoidance. Its depth (about 3 magnitudes deeper than 2MASS) and high angular resolution (0.339″ px−1) have allowed astronomers to discover extragalactic objects, thereby improving our understanding of the Universe beyond the Milky Way. The VVV photometric survey is divided into two regions: the disk and the bulge. For instance, in the disk area, the first work to detect galaxies using VVV data was performed by Amôres et al. (2012), who identified 204 new galaxy candidates in a region of 1.636 square degrees near the Galactic plane using the VVV photometry. This resulted in a significant increase in the number of known galaxies behind the Milky Way, and the surface density increased by more than an order of magnitude.
Regarding extragalactic structures, Coldwell et al. (2014) discovered the NIR galaxy counterparts of a new cluster of galaxies at redshift z = 0.13. This cluster was originally observed in the X-rays with SUZAKU (Mori et al. 2013) and is located in the bulge area. A total of 15 new candidate galaxy members were identified within a radius of 350 kpc from the X-ray peak emission, which is situated in the central region of the cluster. Furthermore, Baravalle et al. (2018) identified 530 new galaxy candidates using a combination of SExtractor and PSFEx techniques, in two tiles located in the Galactic disk region. Later, Baravalle et al. (2019) validated the existence of the inaugural galaxy cluster unearthed by the VVV survey beyond the Galactic disk, using spectroscopic data from Flamingos-2 at the Gemini South Observatory. Subsequently, Baravalle et al. (2021) conducted a comprehensive survey of the VVV disk region that resulted in the identification and catalogue entries for more than 5000 VVV-NIR visually confirmed galaxies. Of these, only 45 were previously known.
Furthermore, Galdeano et al. (2021) revealed an unusual concentration of galaxies by exploring the b204 VVV bulge tile. They detected 624 extended sources, 607 of which correspond to new galaxies that were catalogued for the first time. In addition, by comparing the number of galaxies in this area with values obtained from mock catalogues, it was possible to determine a significant overdensity of galaxies. Later, Galdeano et al. (2023) confirmed the new galaxy cluster using NIR spectroscopic observations from the Gemini South Observatory. This was done by analysing the photometric properties and estimating the spectroscopic redshift of the galaxy candidate members. In addition, the VVVX data (Minniti 2016; Saito et al. 2024) was used by Galdeano et al. (2022) to present an IR view of Ophiuchus, which is the second brightest galaxy cluster in the X-ray sky. This resulted in the discovery of seven times more cluster galaxy candidates than the number of Ophiuchus galaxies reported in previous works.
In a recent work, Duplancic et al. (2024, hereafter D24) studied the entire VVV bulge region in order to develop a strategy to identify galaxies in the large amount of data compiled by the VVV survey. These authors used catalogued photometric information and star–galaxy separation parameters obtained from SExtractor to construct a suitable target galaxy sample with acceptable levels of contamination and high completeness. After visual inspection of this target list, the authors compiled a catalogue of 14 480 galaxy candidates.
This work represents a continuation of the ideas presented in D24. The main objective of this study is to provide a comprehensive statistical analysis of the properties of sources in the D24 catalogue, incorporating visual inspection and morphological classification, as well as a classification of the source environment. In this work, we analyse the photometric properties, linked with morphological classifications and local environments of the entire sample of galaxy candidates recently detected beyond the VVV bulge region in the zone of avoidance. This paper is structured as follows: In Section 2 we describe the VVV data we used. In Section 3, we perform a photometric and astrometric analysis of the catalogue. In Section 4, we present a comprehensive morphology classification of the extended objects and their local environment detected from VVV data and we investigate the morphology-density relation. Finally, in Section 5, we provide a summary of the main results and conclusions. The cosmology adopted throughout this paper is Ω = 0.3, ΩΛ = 0.7, and H0 = 100km s−1 Mpc.
2 VVV data
The bulge of the Milky Way is situated at a distance of nearly 8 kpc from the Sun. It represents a challenging region in which the optical light from millions of stars at low latitudes in our Galaxy is obscured by dust and gas. The VVV survey is a public NIR survey carried out by the European Southern Observatory (ESO) to map the areas of the Milky Way bulge and disk near its centre. The bulge is located between −10° < l < +10° and −10° < b < +5°, while the disk lies between −65° < l < −10° and −2.25° < b < +2.25°. The survey was carried out with the 4.1 m ESO VISTA telescope (Visual and Infrared Survey Telescope for Astronomy; Emerson et al. (2004, 2006); Emerson & Sutherland (2010)), located at an altitude of 2635 meters on Cerro Paranal in the Atacama Desert of northern Chile. VISTA was built by a consortium of 18 UK universities. The 4.1-meter telescope is equipped with an elevation azimuth mount and quasi-Ritchey-Chrétien optics. It includes a wide-field corrector lens system, an autoguider, and active optical sensors.
The observations were made with the VISTA IR Camera (VIRCAM), which consists of 16 Raytheon VIRGO 2048x2048 HgCdTe on CdZnTe substrate science detectors. The mean pixel scale is 0.339″ px−1, and the field of view per exposure is 0.59 square degrees. The detectors are arranged in a grid with a spacing of 90% of the detector width in the x direction and 42.5% in the y direction. This configuration allows for the creation of a continuous area of 1.636 square degrees in six exposures. Each individual exposure is referred to as a pawprint and the final area is referred to as a tile.
The VVV area covers approximately 562 square degrees, requiring 196 tiles to map the bulge and 152 tiles for the disk. The area is fully imaged in five photometric bands: Z, Y, J, H, and Ks. The observation strategy is to add some overlap between the tiles for a smooth matching, so that there is overlap between adjacent tiles and that the entire survey area is covered by at least four exposures in each filter. These observations overcome the strong extinction of the Galactic plane and reach aperture limits up to Ks~18 in clean fields and Ks~16 in the inner bulge (Minniti et al. 2010; Saito et al. 2012). Additionally, the survey includes up to 80 multi-epoch Ks observations spread over approximately 7–8 years, which are useful for variability and proper motion studies. For further details, see Minniti et al. (2010) and Saito et al. (2012).
The data reduction process comprises two main steps. Firstly, the VISTA data flow system (VDFS, Emerson et al. 2004; Irwin et al. 2004; Hambly et al. 2004) was used for the basic data reduction. This was performed at the Cambridge Astronomy Survey Unit (CASU1). The production of survey products, such as calibrated data and catalogues, involves a second-order data-processing step. This task was carried out by the Wide Field Astronomy Unit (WFAU) VISTA Science Archive (VSA2) in Edinburgh. The VSA is a virtual observatory that stores image and catalogue data products generated by the six VISTA public surveys, including VVV. It is a relational database that stores information on catalogued sources that can be accessed through Structured Query Language (SQL) queries. The data are presented in tables that are linked via reference ID numbers. These tables contain catalogues with the main information on astronomical objects, as well as metadata and calibration image information. The VISTA images are stored in the archive as multi-extension FITS files. Various tools at VSA can be employed to extract cut-out images around a specific position.
The present work is the second of a series of papers devoted to exploring the Universe beyond the Milky Way bulge. In D24, VVV data stored in the VSA vvvvSource table were used to select targets with a higher probability of being galaxies. From the nearly 3.7 billion catalogued sources, VSA facilities were crucial to extract relevant photometric information such as source–type classification parameter (mergedClass) and aperture magnitudes (ZYJHKs). Moreover, different VSA tools were used to download images upon which SExtractor was run to obtain specific star–galaxy separation parameters as well as suitable photometry of extended sources. According to the photometric restrictions delineated by Galdeano et al. (2021), an initial sample of approximately 7.5 million sources was obtained in the VVV bulge region. To distinguish potential extragalactic targets from the stellar ones in the initial sample, a number of different constraints were applied and resulted in a sample of more than 190 000 targets. Thereafter, SExtractor was employed in five bands to filter the sample a second time. This yielded a list of 38 718 sources.
Nevertheless, a visual inspection was crucial to separate stellar sources from galaxy–type objects. Therefore, in order to highlight the red colours of the galaxy candidates against the bluer foreground stars, a visual inspection was performed on 38 718 sources in the target sample, using KsJZ false-colour RGB images. As a result, a total of 14 480 galaxy candidates were identified and classified in the Milky Way VVV bulge region. Of these, 14 224 were catalogued for the first time. For a more detailed description of the selection procedure and how the extinction affects the galaxy candidates distribution, we refer to D24.
To ensure a greater reliability of the results, the galaxy candidates were subjected to a comparative analysis with a suitable sample of stars. The sections below present a series of analyses that take the photometric and astrometric data into account.
3 Testing the galaxy catalogue
The photometric data extracted from the VVV images provide valuable insight into the mean characteristics of the classified samples. Furthermore, the astrometric data allow us to select the sample accurately. In this section, we analyse the data we obtained from the images in order to obtain an appropriate characterisation of the visual galaxy catalogue.
3.1 Colour analysis
In accordance with the findings of previous research, including those of Amôres et al. (2012), Coldwell et al. (2014), and Galdeano et al. (2021), the distinction between galaxy candidates and the stellar sample is illustrated, with consideration given to the J-Ks colour and Ks magnitude in three-pixel radius apertures. The magnitudes were corrected for extinction based on the Nishiyama et al. (2009) extinction law.
The star sample was generated by selecting all VIRAC2 (VVV Infrared Astrometric Catalogue version 2, Smith et al. (2025)) sources within 30″ of each extended source that had only a single match in VIRAC2 within 0.5″, with the requirement that the Ks magnitudes agree to within 0.3 mag between the galaxy candidates and the stars. Subsequently, the colours were calculated, and the colour–colour and colour-magnitude plots were constructed according to the agreed method.
The extended source sample was obtained from D24. However, it should be noted that the photometric restrictions listed in this work (mergedClass=1, 10 < K s < 16.2, APERMAG3 > 0 in ZYJHKs bands, J − H > 0, H − K s > 0, J − K s > 0.95) are associated with magnitudes and colours, that were derived from the VSA vvvSource table for VVV catalogued sources. For this target sample, D24 performed SExtractor photometry to derive more suitable magnitudes for extended sources. Therefore, the VSA and SExtractor photometry are equivalent, but not equal, and galaxies with slightly different colours and magnitudes than those catalogued in the vvvSource table remain. Nevertheless, 93% of the D24 extended sources fulfil the same colour and magnitude cut-off. The colours were derived from the circular aperture magnitudes within a radius of three pixels. Figure 1 shows the colour–magnitude diagram, J-Ks versus Ks (3). It shows that the galaxy candidates occupy a distinct position in the diagram, with a redder colour than the stellar sample and a magnitude cut close to K s = 16, which agrees with the selection criteria established by D24. Additionally, it is possible to observe a horizontal sequence at J − K s < 1.0 that corresponds to the stellar sequence of Galactic stars, which likely comprise types later than G5 and earlier than K5 (Finlator et al. 2000). Figure 2 also clearly shows that the visually selected galaxy candidates are situated at a distinct point in the colour–colour diagram relative to the foreground stars. This result is consistent with that of previous studies.
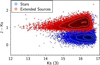 |
Fig. 1 J-Ks versus Ks (3) diagram. The red dots represent the sample of extended sources, and the blue dots represent the VIRAC2 star sample. |
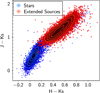 |
Fig. 2 J-Ks versus H-Ks diagram. The red dots represent the sample of extended sources, and the blue dots represent the VIRAC2 star sample. |
3.2 Proper motions
Proper motion measures have a utilitarian function in the maintenance of position reference catalogues. This role is straightforward and significant. Beyond this, they also perform more direct astrophysical functions. These include the use of proper motions as a distance and luminosity estimator, which provides a means of discrimination between classes of stellar objects, such as sources with reduced proper motions (Girard 2008).
In order to enhance the reliability of the objects that were classified as extended sources, their proper motions were subjected to an analysis and comparison with those of stars. In this way, the data from stars catalogued by VIRAC2 were employed. The extended sources were matched with VIRAC2 sources within a match radius of 0.5″, according to the established criteria. The process yielded a total of 12 492 sources, which were selected as sample A.
We used two quality parameters: The first parameter was the detection fraction fdet, which is calculated as the ratio of VIRAC2 parameters ks_n_detections/ks_n_observations and the second parameter was uwe, that is, the unit weight error, which is basically a reduced chi parameter for the astrometric fit.
Based on these quality parameters, a first subset was constructed that comprised extended sources with f det > 0.8, indicating that they were detected in at least 80% of the Ks field observations. This reduced the 12 492 matches to 10 844, which were designated as sample B. Furthermore, a second subset designated C was created using the f det > 0.8 & uwe < 1.2 variable, thereby ensuring a conservative approach. This reduced the matches from 10844 to 8188. Finally, a further subset, designated sample D was created using the criteria of f det > 0.8, uwe < 1.2, μα*_error < 2.0 mas gr−1 and μδ_error < 2.0 mas yr−1. This reduced the number of extended sources from 8188 to 2350. Table 1 provides an overview of the four samples, accompanied by their respective parameters and the number of instances of each.
Figure 3 shows the proper motion diagram. Furthermore, the distributions of the components of the μ are illustrated in the upper panel and on the right side. In both cases, the components corresponding to galaxy candidates are more sharply defined than those corresponding to stars. A comparison of the star sample with the galaxy samples in the diagram reveals a considerable dispersion in the proper motions of the stars, which is to be expected in this region of the Milky Way. The median values of the star sample are μα = −2.10 ± 2.79 and μδ = −4.28 ± 2.75, and the median values of the D galaxy sample are μα = −0.03 ± 1.65 and μδ = −0.11 ± 1.67.
In contrast, the galaxy samples display a greater definition, particularly in the more constrained sample (D). Furthermore, the median of the μ was analysed, and we found 5.91 ± 0.14, 4.10 ± 0.03, 3.54 ± 0.03 and 2.42 ± 0.03 mas yr−1 for samples A, B, C, and D, respectively. The median value of μ for sample D is slightly higher than expected from the VIRAC2 uncertainties (the mean uncertainty is ~1.7 mas yr−1) suggesting a small underestimation of the astrometric uncertainties for spatially resolved galaxy candidates. This is expected because the VIRAC2 pipeline was designed for stars. Consequently, the distribution of extended sources is observed to be closer to zero proper motion values.
We studied the number of galaxy candidates whose proper motions exceeded 10 mas yr−1. To do this we analysed three samples of galaxy candidates with these higher proper motions,
r1/2 < 1.5″
K s > 15
r1/2 < 1.5″ and K s > 15.
In this sense, only objects that fulfilled the aforementioned constraint were selected, and the percentages and number of objects were calculated for each of samples A, B, C, and D (see Table 2). The results demonstrate promising data, as evidenced by the observation that the number of objects with proper motions exceeding 10 mas yr−1 in sample D is very low. In contrast, samples A and B show a greater number of sources for each of the constraints imposed. In this sense, the number of extended sources with unphysically large proper motions seems to arise from their faint magnitudes, compact natures, or both.
The proper motions of stars are distributed in the direction of the Galactic longitude due to the effects of Galactic rotation. The component of the proper motion in the plane of the sky is different for different distances along each line of sight, and also differs for different lines of sight. We considered sample D and a subsample of stars that met the same criteria as galaxy sample D. Figure 4 shows a clear difference in the distributions of the proper motion in Galactic longitude. The mean of the stars is found to be negative (−4.5 mas yr−1), with a dispersion of 3.9 mas yr−1. This is caused by the effects of Galactic rotation on stars at different distances along the line of sight. The extended sources display a mean of near zero (−0.1 mas yr−1) and a dispersion of 2.0 mas yr−1, which is commensurate with the uncertainty of the catalogue. Furthermore, stars exhibit a slightly broader proper motion in Galactic latitude distribution than extended sources. This is attributable to genuine vertical motions.
In order to provide a more detailed characterisation of the galaxy sample we obtained, the following sections present a series of classifications based on the photometric data.
Proper motion sample parameters.
Number of galaxy candidates identified in different samples with proper motions exceeding 10 mas yr−1.
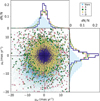 |
Fig. 3 VIRAC2 proper motion measurements based on the differences in RA/Dec between the last and first VVV epochs. The pink, green, yellow and blue dots represent samples A, B, C, and D, respectively. The light blue contours represent a sample of stellar sources. |
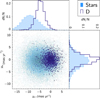 |
Fig. 4 Distribution of the μ in Galactic coordinates. The blue lines represent sample D. The light blue lines represent a subsample of stellar sources. |
4 Galaxy classification
As outlined in Section 2, D24 identified galaxy candidates based on a combination of photometric restrictions on the VSA vvvSource table data and star-galaxy separation parameters obtained from SExtractor runs on KsJZ RGB images. This process was crucial in constructing the final galaxy candidates catalogue. During the visual inspection procedure, the galaxy candidates were visually confirmed and classified based on their appearance. In addition, to characterise the environment of these sources, an analysis of the surrounding region of 1′× 1′ was carried out. Finally, the galaxies were classified according to their morphology and the environment in which they are located. The classification procedure is schematically represented in Figure 5, and a more detailed description is provided in the following sections.
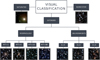 |
Fig. 5 Summary of the visual classification process. Extended sources were classified as elliptical galaxy (MT=1), spiral galaxy (MT=5), undefined galaxy (MT=10), and doubtful galaxy (MT=88). Furthermore, the environments were classified as follows: isolated galaxy (E=0), a galaxy in the company of a close companion (E=2) and a galaxy situated in a dense environment, where at least eight extragalactic sources are visible (E=4). |
4.1 Morphology
In order to perform the visual inspection and subsequent morphological classification, we first created KsJZ RGB images with WCS information and linked these files to each target in our targetsSE catalogue. We then used TOPCAT (Taylor 2005) to load our catalogue and display the images using activation actions. Furthermore, the reliability of the sources was independently corroborated by means of data obtained from the Hierarchical Progressive Survey (HiPS), taking into account cutouts from VVV DR4 colour JYZ images.
Our classification system distinguishes between elliptical galaxies, which have a bulge-type morphology, an extended halo, and a red colour, and spiral galaxies, which have an obvious disc-type morphology with spiral arms in some cases. If these features are not clearly distinguished, then a defined morphology cannot be classified, but the colours and properties are consistent with extragalactic objects. In these cases, the galaxies were classified as undefined. Furthermore, galaxies that are classified as doubtful were identified when their colours in relation to the stars in the field suggest the presence of a galaxy, but their appearance does not permit us to confirm that they are an extragalactic source. For the sake of simplicity, a numerical code was assigned to each morphological type (MT). The numerical codes are as follows:
MT = 1 for ellipticals,
MT = 5 for spirals,
MT = 10 for undefined galaxies,
MT = 88 for doubtful galaxies.
The illustration of the morphological types in the lower left panel of Figure 5 shows that examples of each category are provided.
4.2 Environment
The environment in which these sources are immersed is also a factor that should be taken into account in a search for galaxy groups and cluster candidates. In this regard, the region in which the sources were detected was evaluated in relation to the number of sources that were observed within the same target field.
A numerical code was assigned to each environment (E) in accordance with the following specifications:
E = 0 for isolated galaxies,
E = 2 for galaxies with a close companion,
E = 4 for galaxies in denser environments, that is three or more galaxies are observed. This may be an indicator of groups or clusters.
In the lower right panel of Figure 5, we show the three types of local environment we considered.
4.3 Results of the classification
Based on the adopted morphological classification detailed in the previous sections, the galaxies were classified as follows: 25.6% are ellipticals (MT=1), 11.8% are spirals (MT=5), 44.4% have an undefined morphology (MT=10), and 18.2% are classified as doubtful (MT=88). Relatively few spiral galaxies are observed compared to other types of galaxy. This can be attributed to a number of factors, including the presence of low-luminosity spiral galaxies, whose characteristic features are challenging to discern because the image resolution is limited. Furthermore, the intermediate orientations of these galaxies, which do not correspond to either fully face-on or edge-on views, obstruct a clear view of their features. This in turn contributes to an increased percentage of galaxies being classified as undefined.
We studied a 1′× 1′ field around each D24 galaxy candidates. This angular diameter was selected on the basis of the results of Galdeano et al. (2021). These authors obtained spectroscopic information of VVV galaxies with magnitudes about Ks=15, which corresponds to the median Ks magnitude of the D24 catalogued sources. For these galaxies, they found a median redshift of z = 0.22. Based on this redshift value, the field under study subtends a radius of 100 kpc, enabling a suitable classification of interacting sources. Moreover, 90% of the galaxy candidates in D24 have a r1/2 below 3″, which represents only 5% of the field under study. Therefore, we were unable to observe the galaxy neighbourhood of bright and probably nearby galaxies. In this sense, we found that 73.9% are in field environments (E=0), and the main factor contributing to this outcome is the size of the area that is observed around each object. In contrast, 12.4% are associated with a close companion (E=2), while 13.7% reside in denser environments, which might indicate groups or clusters.
Moreover, to evaluate the uncertainty in the morphological classification obtained through a visual inspection, a comparison was made using a representative and suitable subsample of extended VVV objects that were independently classified by seven different authors3. By analysing the agreement and discrepancies among the classifications, this procedure allowed us a detailed quantification of the uncertainties inherent in human judgment. This approach enabled us to the quantify the uncertainty in visual classification in various morphological types and density environments (see Table 3).
As shown in Table 3, the uncertainty is low for objects identified as spiral galaxies, and it is slightly higher for the classification of ellipticals and galaxies with an undefined morphology. Additionally, when the local density environment is considered, the classification error is low for pair systems, but significantly higher for groups and clusters. This might be attributed to the limited area that is available for the classification process.
Conversely, a significant number of galaxies with highly notable characteristics were identified by processing this substantial data set. These cases are prime potential targets for future spectroscopic follow-up. The following examples are illustrated in Figure 6. They include galaxies with a bar, a merger of galaxies, a very dense environment with at least 11 galaxies in the region, and finally, a very prominent spiral galaxy.
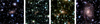 |
Fig. 6 Selection of galaxies that were catalogued for the first time. The first image (MT=5, E=0) on the left depicts a spiral galaxy with a bar. Two very close galaxies (the closeness might suggest a merger), are visible in the second image (MT=10, E=2). The third image (MT=1, E=4) shows a field with very many galaxies. Finally, the fourth image (MT=5, E=0) depicts a spiral galaxy with details of its arms. |
Number of galaxies according to the morphology and environmental classification.
4.3.1 Galaxy properties
In this section, we leverage the classifications performed on the visually classified galaxy sample to conduct a detailed analysis of their photometric properties. Table 4 presents the mean values of the total magnitudes, colours, CS, and r1/2 SExtractor parameters, according to their morphology and environment.
It is noteworthy that galaxies that were visually classified as elliptical exhibit brighter magnitudes across all bands than the remaining galaxies. Figure 7 illustrates the normalised distribution of the Ks magnitudes for each classified morphological type. Spiral galaxies have a slightly fainter but similar distribution to elliptical galaxies. Doubtful galaxies have the faintest magnitude distribution, as expected, while those without a defined observed morphology have an intermediate behaviour.
The colours J − K s, H − K s, and J − H were calculated for all samples. This revealed that the overdense regions exhibited a redder colour, in contrast to the isolated regions, which demonstrated a bluer colour. A detailed description of this relation can be found in Section 4.3.2.
In addition, Table 4 shows the mean values of the galaxy properties for each morphological type, and the normalised distribution of the parameter r1/2 is presented in Figure 8. This figure illustrates the separate distributions for each morphological type, presented alongside the general distribution of the complete catalogue. When the total sample is compared with each of the catalogued morphological types, objects that are classified as elliptical and spiral galaxies clearly exhibit higher r1/2 values than the general distribution. In contrast, objects that are classified as an undefined morphological type and those that are classified as doubtful, which appear more compact, exhibit lower r1/2 values than the general distribution. In other words, the percentage of galaxies was analysed with a cut-off value of r1/2 = 1.55″ (mean value for doubtful galaxies). The results show that 38% of the MT=1 candidates and 40% of the MT=5 candidates meet the specified criterion. In comparison, 58% of the MT=10 candidates and 68% of the MT=88 candidates satisfy the criterion. As Figure 5 shows, elliptic and spiral objects exhibit a greater extension than indefinite or doubtful ones, which appear smaller and without visible morphological characteristics. Consequently, the observed behaviours in the distributions of r1/2 are consistent with the expectations based on a previous visual inspection.
As shown in Table 4, the CS parameter demonstrates that all classified morphological types exhibit a markedly low mean CS value. However, a slight decline in this value is observed for candidates of the elliptical and spiral types. Moreover, this outcome can be represented graphically, as demonstrated in Figure 8. The data presented in this figure demonstrate a consistent outcome for the elliptical and spiral objects, with a notable prevalence of objects that exhibit CS values that are closely aligned with zero. This suggests that the proportion of objects with CS values approaching zero is greater in the samples of spiral and elliptical objects than in the complete catalogue. In contrast, the behaviour observed for objects classified as doubtful and lacking a morphological type is the opposite. Therefore, the proportion of galaxies was evaluated using a cut-off value of CS = 0.05, which correlates with the mean value of doubtful galaxies. The findings show that 94% of the MT = 1 candidates and 97% of the MT = 5 candidates align with the specified criterion. In contrast, 86% of MT=10 candidates and 78% of MT=88 candidates also meet the defined threshold. The complete catalogue displays a higher proportion of objects with CS values close to zero than the sample of objects without a defined morphology and those that were classified as doubtful, that is, 88% of the total.
In a similar way, Table 4 presents a summary of the photometric data obtained with SExtractor, classified according to the environment in which the objects were found. The mean magnitudes in all bands are brighter for the isolated galaxies, in contrast to the fainter sources that belong to dense regions. It is important to note that the galaxies that are classified in dense environments correspond to all sources that belong to the possible galaxy system. In this instance, it is necessary to obtain spectroscopic data in order to ascertain whether the objects belong to the galaxy system and to estimate the redshift. In addition, this will permit us to exclude sources that are situated in the region as a consequence of the projection. Furthermore, the colours J − K s, H − K s, and J − H were calculated for all samples, with redder colours observed for the overdense regions, in contrast to the isolated regions, which have bluer colours. Finally, the star–galaxy separation parameters (CS and r1/2) were analysed. With regard to the half-light radius, the isolated galaxies exhibit a greater extent, in contrast to the candidates in dense environments, which show a smaller half-light radius. All environments exhibit the same value for the concentration parameter.
Mean values of the total magnitudes, colours, CS, and r1/2 SExtractor parameters for the total catalogue and according to the galaxy morphology and environment.
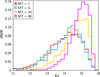 |
Fig. 7 Normalised distributions of the Ks magnitude for galaxies in the VVV bulge region according to their classification as elliptical (red), spiral (cyan), undefined morphology (yellow), and doubtful (pink). |
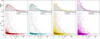 |
Fig. 8 Upper panels: normalised distributions of the r1/2 parameter for the different morphological types of galaxies. Lower panels: CS parameter as a function of r1/2. The grey contours represents the complete catalogue, and the red, light blue, yellow, and pink dots represent the galaxies that were classified as elliptical, spiral, undefined, and doubtful, respectively. |
Number and percentages of galaxies for each morphological type for the three classified environments.
4.3.2 Morphology–density relation
The morphology–density relation indicates that early-type red galaxies are generally found in high-density environments, while blue-disk galaxies are more commonly observed in low-density regions (Dressler 1980; Cooper et al. 2010). Because the contrast in the host galaxy properties is significant, it is reasonable to expect that this is reflected in the environment.
Table 5 provides a detailed summary of the morphological classifications (ellipticals, spirals, undefined, and doubtful) distributed across the three types of environments considered in this study: isolated, paired, and dense regions. Most of the detections in the four morphological types are made in isolated environments, with spirals and doubtful galaxies having the highest percentages. In contrast, elliptical and indefinite candidates have the highest percentages in dense environments.
Section 4.2 outlines the environmental classification system. Despite the limitation of a group environment detection to galaxies that are situated at a distance that allows an observation of companion galaxies, the relation with the morphological type classification can be studied within the fixed area. In order to facilitate a comparative analysis of the varying expected relations, two samples of objects with disparate visible characteristics were generated. The first sample comprised spiral galaxies in isolated environments (MT=5 and E=0), and the second sample consisted of elliptical-type objects immersed in dense environments (MT=1 and E=4).
Figure 9 shows that the galaxies with a red colour (H − K s > 0.5) represent 64% of the ellipticals in denser regions and 42% of the isolated spiral galaxies. On the other hand, the isolated spiral galaxies appear to be brighter than the elliptical galaxies in the denser areas. This can be attributed to the target distance, as the objects that were classified as isolated are likely to be those with a low redshift, resulting in a brighter apparent magnitude. Subsequently, we performed the Kolmogorov-Smirnov test that confirmed that the observed differences in Ks magnitude and H-Ks colour between the two samples were statistically significant (p < 0.05). As demonstrated by the resulting D and p values, there are statistically significant differences between the distributions.
Furthermore, an analysis of magnitude-fixed bins revealed that elliptical galaxies, which are concentrated in denser areas, tend to exhibit redder colours than isolated spiral galaxies. This issue is illustrated in Figure 10 for the four magnitude ranges. The colour distributions demonstrate that for each magnitude range, elliptical galaxies in dense environments exhibit redder colours than their spiral counterparts in isolated regions, as expected based on the morphology density relation. In addition, the plot depicts the mean values of each distribution, with a mean H-Ks value of 0.52 for the total sample of extended sources. The values for the sample of elliptical galaxies in dense environments are 0.50, 0.56, 0.58, and 0.63 for each magnitude range. In contrast, the mean H-Ks colour values for the sample of spiral galaxies in isolated environments are 0.44, 0.51, 0.56, and 0.60 for each magnitude range. These values suggest a discernible reddening effect for galaxies exhibiting lower brightness levels and situated in densely populated environments. The KS test was also employed in order to estimate the statistical significance of the observed differences. The outcomes of this analysis demonstrated that the differences in H-Ks colour between the two samples for each range of magnitude were statistically significant (p < 0.05). The resulting D and p values from the KS test reveal statistically significant differences between the distributions in the majority of cases. In the fainter sample, the KS statistics are found to be noisy, which is a consequence of the reduced number of objects.
In order to reinforce this result, a direct comparison was made between elliptical galaxies in dense and isolated environments. We considered the findings of Galdeano et al. (2023) and Baravalle et al. (2019), who used spectroscopy to confirm the presence of galaxy clusters in z ≈ 0.22 in the VVV bulge and disk area, respectively. In these works, the galaxies in the region of the galaxy cluster span a magnitude range of approximately 14 < K s < 15.5. Based on this information, we investigated the colour distribution of elliptical galaxies within this magnitude range. The left panel of Figure 11 shows that galaxies that were classified as elliptical in dense environments exhibit redder colours than isolated ellipticals. This fact allows us to hypothesize that these elliptical galaxies in dense environments are potential targets for future spectroscopic observations in order to identify galaxy clusters situated behind the Galactic bulge. Furthermore, the right panels of Figure 11 illustrate the colour distribution of spiral galaxies in dense and isolated environments. The findings indicate that spiral galaxies classified as being in a dense environment exhibit a redder colour than those in isolated environments. In this study, visual environmental classification is posited as a reliable indicator because dense environments at large distances can be discerned.
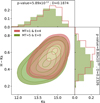 |
Fig. 9 H-Ks versus Ks contour diagram, along with the normalised distributions of H-Ks colour and Ks magnitude for both samples. The green lines represent spiral galaxies in isolated environments, and the red lines correspond to elliptical galaxies situated in densely populated areas. The contours represent 5%, 25%, 50% 75%, and 85% of the data for each sample. The resulting D and p values of the KS test are presented. |
5 Summary and conclusions
The VVV survey was used to conduct a search for galaxies within the Milky Way bulge region. A photometric analysis of the detected sources and a visual inspection of the RGB images were employed to identify and reject Galactic contamination sources, thereby enhancing the quality of the sample of identified galaxies. The employment of these combined techniques enabled us to identify and analyse a substantial number of galaxies in the Milky Way bulge region, thereby facilitating a comprehensive understanding of their properties in a challenging and under-explored region of the Universe.
We conducted a detailed analysis and comparison of the proper motions of the galaxy candidates with those of the stars with the aim of enhancing the reliability of the data. For this purpose, we employed the data from the VIRAC2 catalogues. The results of this analysis indicated that the components of galaxy proper motions are closer to zero with a minimal dispersion, while those of star components exhibit greater variation. This is typical of Milky Way stars. For instance, the sample with the highest data quality demonstrated the lowest proper motion values. In addition, the colour–magnitude and colour–colour diagrams show the difference in the trends shown by the stars and extended sources.
For visual inspection and morphological classification, we generated KsJZ RGB images with WCS information and linked them to the targetsSE catalogue. We used TOPCAT to load the catalogue and display the images. Our morphological classification method distinguishes between elliptical, spiral, undefined, and doubtful galaxies. Ellipticals have a bulge and extended halo morphology, while spirals show discs and, in some cases, spiral arms. Undefined galaxies have extragalactic features but an unclear morphology, and doubtful galaxies cannot be confirmed as extragalactic sources. Furthermore, the environment of the detected sources was classified as isolated, with a closer companion and denser environments.
In line with the established morphological classification system, the galaxies were categorised as follows: The results showed that 25.6% of the galaxies were elliptical, 11.8% spiral, 44.4% undefined, and 18.2% doubtful. The relatively low number of spirals may be due to a combination of factors, including their faintness, lack of clarity, or an orientation that deviates from the viewing perspective. In terms of the local environment, the majority of galaxies are situated in isolated environments, while 12.4% have a close companion, and 13.7% are in denser environments. To assess the uncertainty in the classification, a subsample of VVV extended objects was classified by seven authors. This demonstrated the margin of error in human judgment in different morphological types and density environments. The margin of error is low for spiral galaxies, but higher for elliptical galaxies and undefined galaxies. Classification errors are minimal for pair systems, but significantly higher for groups and clusters.
The morphological types of galaxies, their brightness, extent, and environment were analysed. Galaxies that were classified as elliptical and spiral are brighter and more extended than those that were classified as doubtful. The environment of galaxies was also studied, with the result that the majority of them are found in isolated environments. It is noteworthy that there are a number of interesting cases of galaxies that might be the subject of future spectroscopic studies.
The classification of galaxies was analysed on the basis of their environment, and the relation between group environments and morphological types was investigated. The theory suggests that early-type red galaxies are frequently observed in regions characterised by high density, whereas blue disk galaxies are more prevalent in low-density environments. Moreover, two samples were constructed: One sample comprised spiral galaxies in isolated environments, and the other sample comprised elliptical galaxies in dense environments. The analysis of the colour-magnitude diagram of the two samples revealed that isolated spiral galaxies are brighter and bluer than elliptical galaxies in denser environments. This was attributed to the lower redshift of isolated spirals, which causes them to appear brighter. Moreover, elliptical galaxies in dense environments were found to be redder than isolated spirals. Furthermore, this point was discussed in relation to the colour distribution of elliptical galaxies in dense environments, and we compared this to elliptical galaxies in isolated environments.
To summarise, 14480 galaxy candidates were detected in the VVV survey in the Milky way region, 14 224 of which were catalogued in D24 for the first time. The galaxy candidates were subjected to a visual inspection to determine their morphology. This process was crucial because the results we obtained provide fundamental information for the characterisation and morphological classification of the galaxies. This aspect is highly relevant in the context of the study of the ZOA.
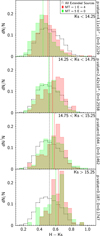 |
Fig. 10 Distributions of the H-Ks colour, spanning four magnitude ranges, for three different samples: the total extended source sample (dashed black), isolated spiral galaxies (green shadow), and elliptical galaxies in dense regions (red shadow). The vertical lines indicate the mean values for each sample. The resulting D and p values of the KS test are presented. |
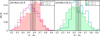 |
Fig. 11 Distributions of the H-Ks colours for elliptical galaxies (left panel) and spiral galaxies (right panels) in an environment classified as isolated (E = 0) and high density (E = 4) in the 14 < K s < 15.5 magnitude range. The vertical lines represent the mean H − K s colour, and the error is indicated by the grey shadow area, as measured for the five galaxies that were spectroscopically confirmed and are part of a galaxy structure, as reported by Galdeano et al. (2023). |
Data availability
The catalogue is available in electronic form at the CDS via anonymous ftp to cdsarc.cds.unistra.fr (130.79.128.5) or via https://cdsarc.cds.unistra.fr/viz-bin/cat/J/A+A/698/A214
Acknowledgements
This work was supported in part by the Consejo Nacional de Investigaciones Científicas y Técnicas de la República Argentina (CONICET) and Secretaría de Ciencia y Técnica de la Universidad Nacional de San Juan. PWL acknowledges support by grant ST/Y000846/1 from the Science and Technology Research Council of the United Kingdom. The authors gratefully acknowledge data from the ESO Public Survey program ID 179.B-2002 taken with the VISTA telescope, and products from VISTA Science Archive (VSA). V.M. also acknowledges support from project DIDULS Regular No. PR2353857. D.M. acknowledges support from the Center for Astrophysics and Associated Technologies CATA by the ANID BASAL projects ACE210002 and FB210003, by Fondecyt Project No. 1220724. This research made use of Astropy4, a community-developed core Python package for Astronomy (Astropy Collaboration 2013, 2018) and TOPCAT- Tool for OPerations on Catalogues And Tables (Taylor 2005).
References
- Amôres, E. B., Sodré, L., Minniti, D., et al. 2012, AJ, 144, 127 [Google Scholar]
- Astropy Collaboration (Robitaille, T. P., et al.) 2013, A&A, 558, A33 [NASA ADS] [CrossRef] [EDP Sciences] [Google Scholar]
- Astropy Collaboration (Price-Whelan, A. M., et al.) 2018, AJ, 156, 123 [Google Scholar]
- Baravalle, L. D., Alonso, M. V., Nilo Castellón, J. L., Beamín, J. C., & Minniti, D. 2018, AJ, 155, 46 [Google Scholar]
- Baravalle, L. D., Nilo Castellón, J. L., Alonso, M. V., et al. 2019, ApJ, 874, 46 [Google Scholar]
- Baravalle, L. D., Alonso, M. V., Minniti, D., et al. 2021, MNRAS, 502, 601 [NASA ADS] [CrossRef] [Google Scholar]
- Coldwell, G., Alonso, S., Duplancic, F., et al. 2014, A&A, 569, A49 [NASA ADS] [CrossRef] [EDP Sciences] [Google Scholar]
- Cooper, M. C., Gallazzi, A., Newman, J. A., & Yan, R. 2010, MNRAS, 402, 1942 [NASA ADS] [CrossRef] [Google Scholar]
- Dressler, A. 1980, ApJ, 236, 351 [Google Scholar]
- Duplancic, F., Alonso, S., Coldwell, G., et al. 2024, A&A, 682, A153 [NASA ADS] [CrossRef] [EDP Sciences] [Google Scholar]
- Ebeling, H., Mullis, C. R., & Tully, R. B. 2002, ApJ, 580, 774 [Google Scholar]
- Emerson, J. P., & Sutherland, W. J. 2010, SPIE Conf. Ser., 7733, 773306 [NASA ADS] [Google Scholar]
- Emerson, J. P., Irwin, M. J., Lewis, J., et al. 2004, SPIE Conf. Ser., 5493, 401 [Google Scholar]
- Emerson, J., Irwin, M., & Hambly, N. 2006, SPIE Conf. Ser., 6270, 62700S [NASA ADS] [Google Scholar]
- Finlator, K., Ivezić, Ž., Fan, X., et al. 2000, AJ, 120, 2615 [Google Scholar]
- Galdeano, D., Pereyra, L., Duplancic, F., et al. 2021, A&A, 646, A146 [NASA ADS] [CrossRef] [EDP Sciences] [Google Scholar]
- Galdeano, D., Coldwell, G., Duplancic, F., et al. 2022, A&A, 663, A158 [NASA ADS] [CrossRef] [EDP Sciences] [Google Scholar]
- Galdeano, D., Ferrero, G. A., Coldwell, G., et al. 2023, A&A, 669, A7 [NASA ADS] [CrossRef] [EDP Sciences] [Google Scholar]
- Girard, T. M. 2008, in IAU Symposium, 248, A Giant Step: from Milli- to Microarcsecond Astrometry, eds. W. J. Jin, I. Platais, & M. A. C. Perryman, 303 [Google Scholar]
- Hambly, N. C., Mann, R. G., Bond, I., et al. 2004, SPIE Conf. Ser., 5493, 423 [NASA ADS] [Google Scholar]
- Huchra, J. P., Macri, L. M., Masters, K. L., et al. 2012, VizieR Online Data Catalog: J/ApJS/199/26 [Google Scholar]
- Irwin, M. J., Lewis, J., Hodgkin, S., et al. 2004, SPIE Conf. Ser., 5493, 411 [Google Scholar]
- Jarrett, T. H., Chester, T., Cutri, R., et al. 2000, AJ, 119, 2498 [Google Scholar]
- Koribalski, B. S., Staveley-Smith, L., Kilborn, V. A., et al. 2004, AJ, 128, 16 [Google Scholar]
- Kraan-Korteweg, R. C., & Lahav, O. 2000, A&A Rev., 10, 211 [Google Scholar]
- Macri, L. M., Kraan-Korteweg, R. C., Lambert, T., et al. 2019, ApJS, 245, 6 [Google Scholar]
- Minniti, D. 2016, in Galactic Surveys: New Results on Formation, Evolution, Structure and Chemical Evolution of the Milky Way, 10 [Google Scholar]
- Minniti, D., Lucas, P. W., Emerson, J. P., et al. 2010, New A, 15, 433 [Google Scholar]
- Mori, H., Maeda, Y., Furuzawa, A., Haba, Y., & Ueda, Y. 2013, PASJ, 65, 102 [NASA ADS] [Google Scholar]
- Nagayama, T., Woudt, P. A., Nagashima, C., et al. 2004, MNRAS, 354, 980 [Google Scholar]
- Nishiyama, S., Tamura, M., Hatano, H., et al. 2009, ApJ, 696, 1407 [NASA ADS] [CrossRef] [Google Scholar]
- Paturel, G., Vauglin, I., Petit, C., et al. 2005, A&A, 430, 751 [NASA ADS] [CrossRef] [EDP Sciences] [Google Scholar]
- Roman, A. T., Nakanishi, K., & Saito, M. 1998, PASJ, 50, 37 [Google Scholar]
- Saito, R. K., Hempel, M., Minniti, D., et al. 2012, A&A, 537, A107 [NASA ADS] [CrossRef] [EDP Sciences] [Google Scholar]
- Saito, R. K., Hempel, M., Alonso-García, J., et al. 2024, A&A, 689, A148 [NASA ADS] [CrossRef] [EDP Sciences] [Google Scholar]
- Schröder, A. C., Flöer, L., Winkel, B., & Kerp, J. 2019, MNRAS, 489, 2907 [Google Scholar]
- Shapley, H. 1961, Galaxies (Harvard University Press) [Google Scholar]
- Skelton, R. E., Woudt, P. A., & Kraan-Korteweg, R. C. 2009, MNRAS, 396, 2367 [Google Scholar]
- Skrutskie, M. F., Cutri, R. M., Stiening, R., et al. 2006, AJ, 131, 1163 [NASA ADS] [CrossRef] [Google Scholar]
- Smith, L. C., Lucas, P. W., Koposov, S. E., et al. 2025, MNRAS, 536, 3707 [NASA ADS] [CrossRef] [Google Scholar]
- Staveley-Smith, L., Kraan-Korteweg, R. C., Schröder, A. C., et al. 2016, AJ, 151, 52 [Google Scholar]
- Steyn, N., Kraan-Korteweg, R. C., Rajohnson, S. H. A., et al. 2024, MNRAS, 529, L88 [Google Scholar]
- Taylor, M. B. 2005, in Astronomical Society of the Pacific Conference Series, 347, Astronomical Data Analysis Software and Systems XIV, eds. P. Shopbell, M. Britton, & R. Ebert, 29 [Google Scholar]
- Vauglin, I., Rousseau, J., Paturel, G., et al. 2002, A&A, 387, 1 [NASA ADS] [CrossRef] [EDP Sciences] [Google Scholar]
- Woudt, P. A., Kraan-Korteweg, R. C., Cayatte, V., Balkowski, C., & Felenbok, P. 2004, A&A, 415, 9 [NASA ADS] [CrossRef] [EDP Sciences] [Google Scholar]
Daniela Galdeano, Georgina Coldwell, Sol Alonso, Fernanda Duplancic, Julia Fernandez, Noelia Perez, and Valeria Mesa.
All Tables
Number of galaxy candidates identified in different samples with proper motions exceeding 10 mas yr−1.
Mean values of the total magnitudes, colours, CS, and r1/2 SExtractor parameters for the total catalogue and according to the galaxy morphology and environment.
Number and percentages of galaxies for each morphological type for the three classified environments.
All Figures
|
Fig. 1 J-Ks versus Ks (3) diagram. The red dots represent the sample of extended sources, and the blue dots represent the VIRAC2 star sample. |
| In the text | |
|
Fig. 2 J-Ks versus H-Ks diagram. The red dots represent the sample of extended sources, and the blue dots represent the VIRAC2 star sample. |
| In the text | |
|
Fig. 3 VIRAC2 proper motion measurements based on the differences in RA/Dec between the last and first VVV epochs. The pink, green, yellow and blue dots represent samples A, B, C, and D, respectively. The light blue contours represent a sample of stellar sources. |
| In the text | |
|
Fig. 4 Distribution of the μ in Galactic coordinates. The blue lines represent sample D. The light blue lines represent a subsample of stellar sources. |
| In the text | |
|
Fig. 5 Summary of the visual classification process. Extended sources were classified as elliptical galaxy (MT=1), spiral galaxy (MT=5), undefined galaxy (MT=10), and doubtful galaxy (MT=88). Furthermore, the environments were classified as follows: isolated galaxy (E=0), a galaxy in the company of a close companion (E=2) and a galaxy situated in a dense environment, where at least eight extragalactic sources are visible (E=4). |
| In the text | |
|
Fig. 6 Selection of galaxies that were catalogued for the first time. The first image (MT=5, E=0) on the left depicts a spiral galaxy with a bar. Two very close galaxies (the closeness might suggest a merger), are visible in the second image (MT=10, E=2). The third image (MT=1, E=4) shows a field with very many galaxies. Finally, the fourth image (MT=5, E=0) depicts a spiral galaxy with details of its arms. |
| In the text | |
|
Fig. 7 Normalised distributions of the Ks magnitude for galaxies in the VVV bulge region according to their classification as elliptical (red), spiral (cyan), undefined morphology (yellow), and doubtful (pink). |
| In the text | |
|
Fig. 8 Upper panels: normalised distributions of the r1/2 parameter for the different morphological types of galaxies. Lower panels: CS parameter as a function of r1/2. The grey contours represents the complete catalogue, and the red, light blue, yellow, and pink dots represent the galaxies that were classified as elliptical, spiral, undefined, and doubtful, respectively. |
| In the text | |
|
Fig. 9 H-Ks versus Ks contour diagram, along with the normalised distributions of H-Ks colour and Ks magnitude for both samples. The green lines represent spiral galaxies in isolated environments, and the red lines correspond to elliptical galaxies situated in densely populated areas. The contours represent 5%, 25%, 50% 75%, and 85% of the data for each sample. The resulting D and p values of the KS test are presented. |
| In the text | |
|
Fig. 10 Distributions of the H-Ks colour, spanning four magnitude ranges, for three different samples: the total extended source sample (dashed black), isolated spiral galaxies (green shadow), and elliptical galaxies in dense regions (red shadow). The vertical lines indicate the mean values for each sample. The resulting D and p values of the KS test are presented. |
| In the text | |
|
Fig. 11 Distributions of the H-Ks colours for elliptical galaxies (left panel) and spiral galaxies (right panels) in an environment classified as isolated (E = 0) and high density (E = 4) in the 14 < K s < 15.5 magnitude range. The vertical lines represent the mean H − K s colour, and the error is indicated by the grey shadow area, as measured for the five galaxies that were spectroscopically confirmed and are part of a galaxy structure, as reported by Galdeano et al. (2023). |
| In the text | |
Current usage metrics show cumulative count of Article Views (full-text article views including HTML views, PDF and ePub downloads, according to the available data) and Abstracts Views on Vision4Press platform.
Data correspond to usage on the plateform after 2015. The current usage metrics is available 48-96 hours after online publication and is updated daily on week days.
Initial download of the metrics may take a while.