Open Access
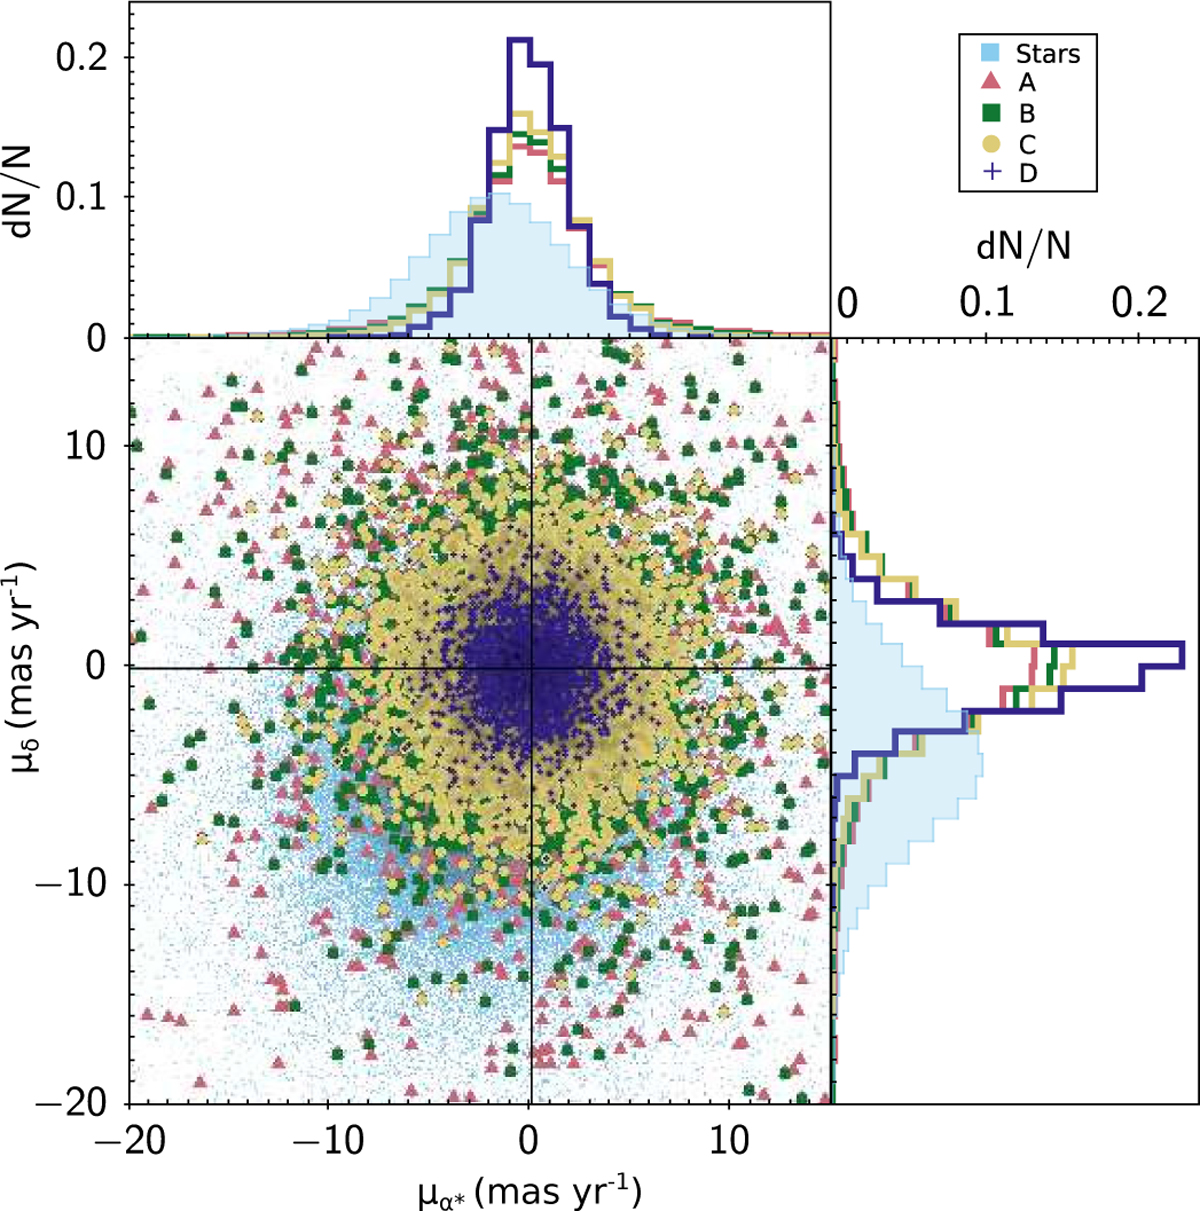
Fig. 3
Download original image
VIRAC2 proper motion measurements based on the differences in RA/Dec between the last and first VVV epochs. The pink, green, yellow and blue dots represent samples A, B, C, and D, respectively. The light blue contours represent a sample of stellar sources.
Current usage metrics show cumulative count of Article Views (full-text article views including HTML views, PDF and ePub downloads, according to the available data) and Abstracts Views on Vision4Press platform.
Data correspond to usage on the plateform after 2015. The current usage metrics is available 48-96 hours after online publication and is updated daily on week days.
Initial download of the metrics may take a while.