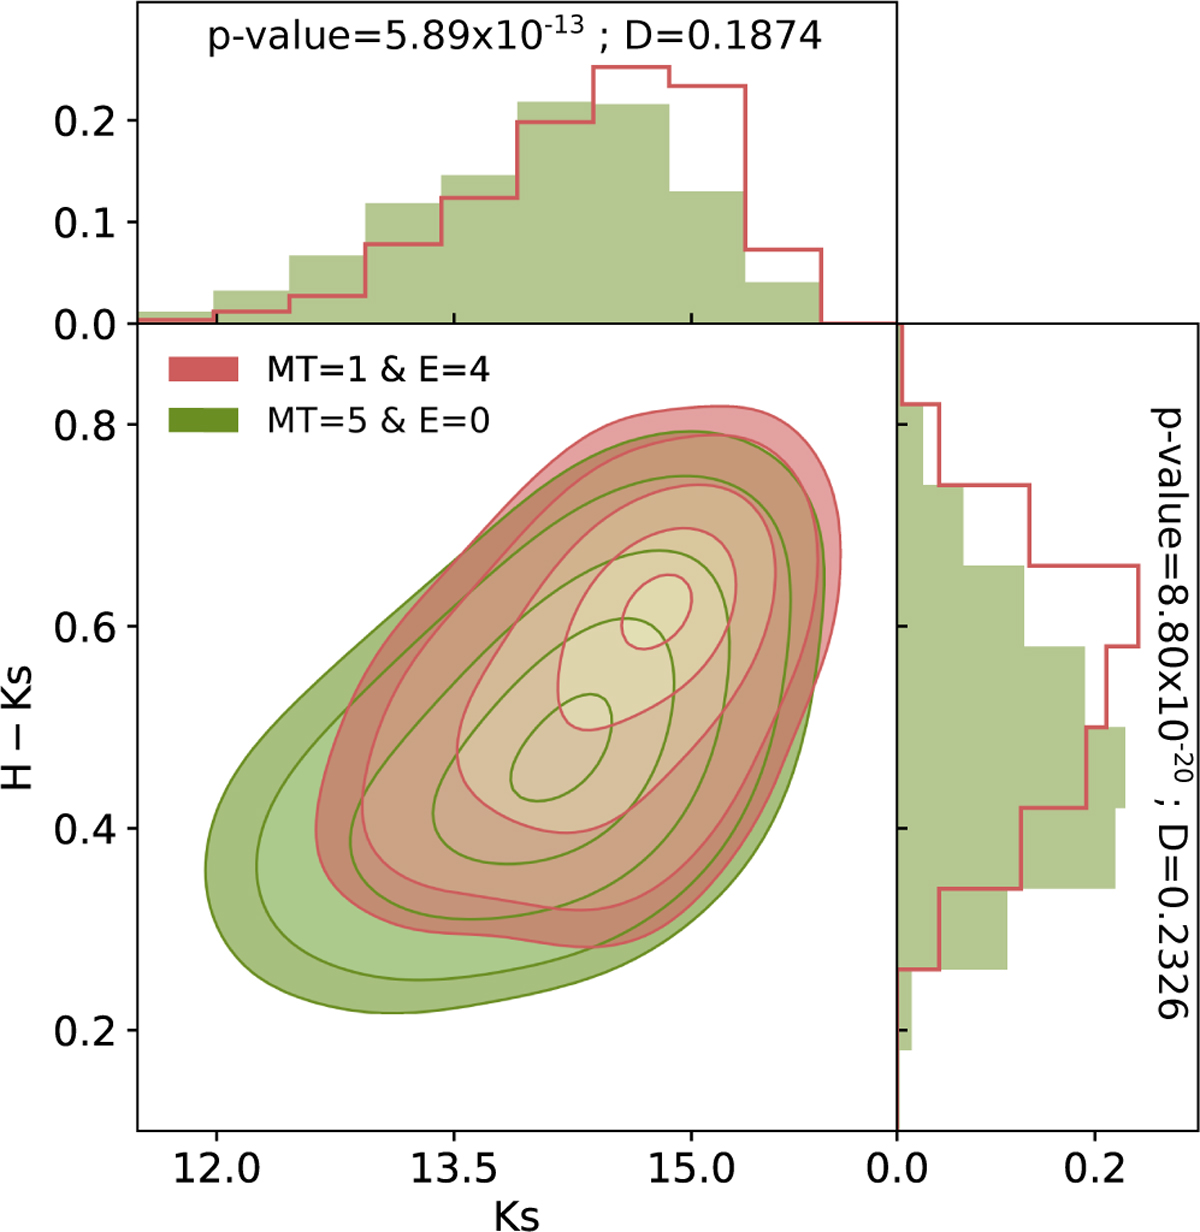
Fig. 9
Download original image
H-Ks versus Ks contour diagram, along with the normalised distributions of H-Ks colour and Ks magnitude for both samples. The green lines represent spiral galaxies in isolated environments, and the red lines correspond to elliptical galaxies situated in densely populated areas. The contours represent 5%, 25%, 50% 75%, and 85% of the data for each sample. The resulting D and p values of the KS test are presented.
Current usage metrics show cumulative count of Article Views (full-text article views including HTML views, PDF and ePub downloads, according to the available data) and Abstracts Views on Vision4Press platform.
Data correspond to usage on the plateform after 2015. The current usage metrics is available 48-96 hours after online publication and is updated daily on week days.
Initial download of the metrics may take a while.