Fig. 10

Download original image
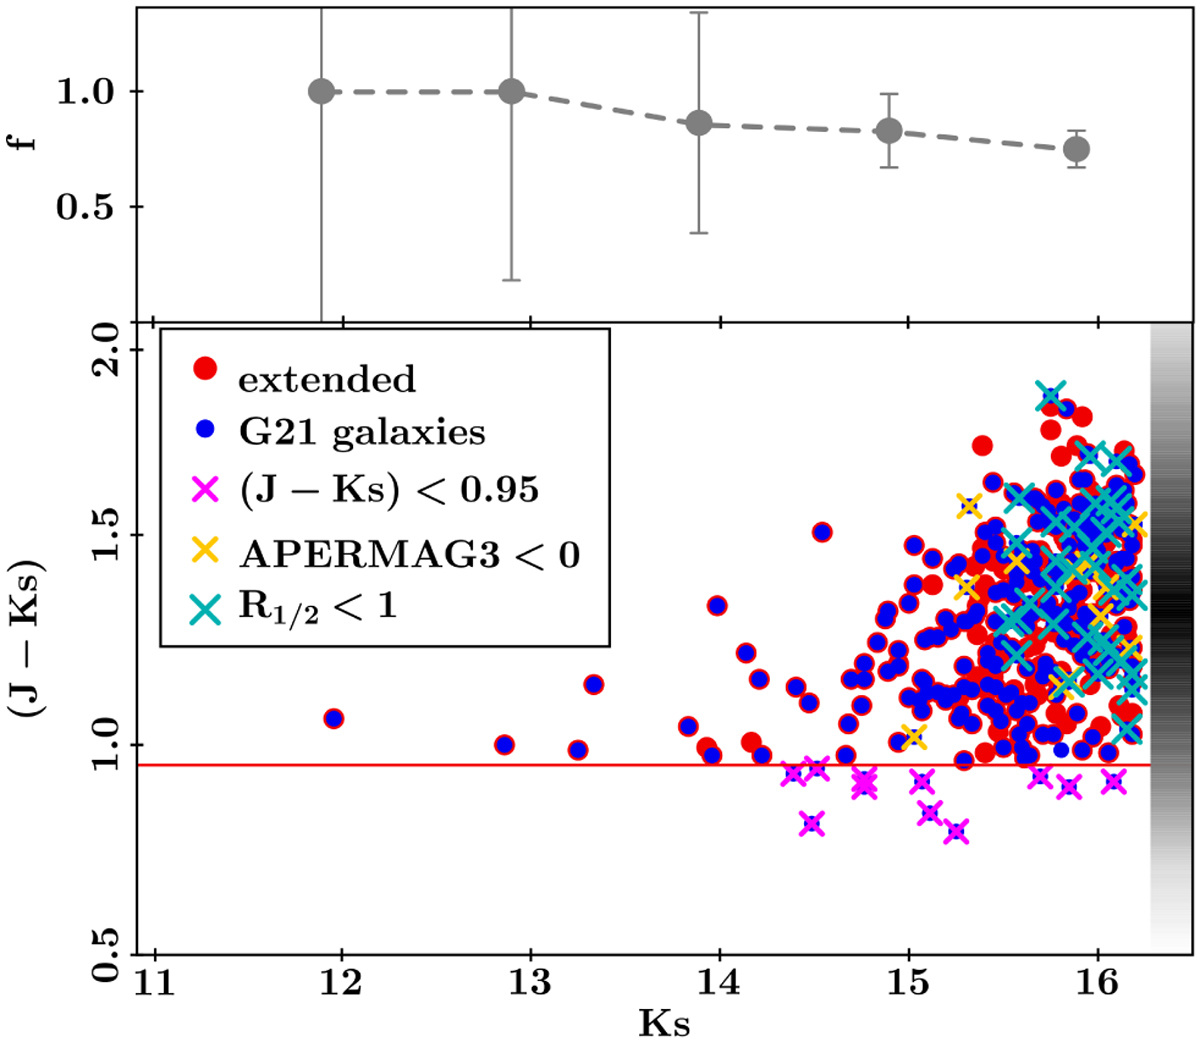
Colour-magnitude diagrams (J-Ks) vs. Ks for the extended objects in tile b204 (red dots) and G21 galaxies (blue dots). We consider VVV extinction-corrected aperture magnitudes. Crosses show galaxies not detected with our methodology, with the sources lost by the (J-Ks) cut in pink, sources with R1/2 < 1 arcsec in cyan, and galaxies with unreliable measurements in the Z and Y VVV bands in yellow. On the right-hand side of this figure, we plot a densogram based on the (J-Ks) colour distribution of the sources. In the upper panel, we show the fraction of recovered G21 galaxies as a function of Ks magnitude. Error bars are associated to standard errors.
Current usage metrics show cumulative count of Article Views (full-text article views including HTML views, PDF and ePub downloads, according to the available data) and Abstracts Views on Vision4Press platform.
Data correspond to usage on the plateform after 2015. The current usage metrics is available 48-96 hours after online publication and is updated daily on week days.
Initial download of the metrics may take a while.


