| Issue |
A&A
Volume 679, November 2023
|
|
|---|---|---|
| Article Number | A122 | |
| Number of page(s) | 13 | |
| Section | Galactic structure, stellar clusters and populations | |
| DOI | https://doi.org/10.1051/0004-6361/202346963 | |
| Published online | 29 November 2023 | |
The role of radial migration in open cluster and field star populations with Gaia DR3
1
Institute of Theoretical Physics and Astronomy, Vilnius University, Sauletekio av. 3, 10257 Vilnius, Lithuania
e-mail: This email address is being protected from spambots. You need JavaScript enabled to view it.
2
INAF – Osservatorio Astrofisico di Arcetri, Largo E. Fermi 5, 50125 Firenze, Italy
3
INAF – Padova Observatory, Vicolo dell’Osservatorio 5, 35122 Padova, Italy
Received:
22
May
2023
Accepted:
28
September
2023
Abstract
Context. The survival time of a star cluster depends on its total mass, density, and thus size, as well as on the environment in which it was born and in which lies. Its dynamical evolution is influenced by various factors such as gravitational effects of the Galactic bar, spiral structures, and molecular clouds. Overall, the factors that determine the longevity of a cluster are complex and not fully understood.
Aims. This study aims to investigate whether open clusters and field stars respond differently to the perturbations that cause radial migration. In particular, we aim to understand the nature of the oldest surviving clusters.
Methods. We compared the time evolution of the kinematic properties of two Gaia DR3 samples. The first sample is composed of ∼40 open clusters and the second one of ∼66 000 main sequence turn off field stars. Both of the samples are composed of stars selected with the same quality criterion, and they belong to the thin disc, are in a similar metallicity range, are located in the same Galactocentric region [7.5–9 kpc], and have ages greater than 1 Gyr. We performed a statistical analysis comparing the properties of the samples of the field stars and of the open clusters.
Results. A qualitative comparison of kinematic and orbital properties revealed that clusters younger than 2–3 Gyr are more resistant to perturbations than field stars, and they move along quasi-circular orbits. Conversely, clusters older than approximately 3 Gyr have more eccentric and inclined orbits than isolated stars in the same age range. Such orbits lead the older clusters to reach higher elevations on the Galactic plane, maximising their probability to survive several more gigayears. A formal statistical analysis revealed that there are differences among the time evolution of most of the kinematic and orbital properties of the field stars and open clusters. However, the comparison between some properties (e.g., Vϕ and LZ) do not reach a sufficient statistical significance.
Conclusions. Our results suggest that the oldest surviving clusters are usually more massive and move on orbits with a higher eccentricity. Although they are still reliable tracers of the Galaxy’s past composition, they do not reflect the composition of the place where they are currently found. Therefore, we cannot avoid considering kinematic properties when comparing data and models of chemical evolution and also taking into account the intrinsic differences between clusters and isolated stars. To validate the results, new studies that increase the sample of open clusters, especially at older ages, are needed.
Key words: Galaxy: disk / Galaxy: evolution / Galaxy: abundances / Galaxy: kinematics and dynamics / open clusters and associations: general
© The Authors 2023
 Open Access article, published by EDP Sciences, under the terms of the Creative Commons Attribution License (https://creativecommons.org/licenses/by/4.0), which permits unrestricted use, distribution, and reproduction in any medium, provided the original work is properly cited.
This article is published in open access under the Subscribe to Open model. This email address is being protected from spambots. You need JavaScript enabled to view it. to support open access publication.
1. Introduction
Radial migration is caused by interactions of stars with spiral arms, or other non-axisymmetric structures, in the Galactic potential (Sellwood & Binney 2002). It produces changes in stellar orbits, which are initially circular. This results in a radial displacement of the stars with respect to the Galactocentric radius (RGC) at which they are formed.
Since migration redistributes stellar populations to different parts of the Galactic disc, the current abundances measured in stars of different ages in a given Galactic location cannot be considered as completely representative of the past interstellar medium composition in that place. It is indeed necessary to consider the effect of radial migration for a comprehensive understanding of Galactic chemical evolution (e.g., Kubryk et al. 2013). For instance, Loebman et al. (2016) found that radial migration has a significant impact on the shape and width of metallicity distribution functions (MDFs) at different Galactocentric distances.
The study of the chemo-dynamical properties of open clusters and field stars can provide valuable information about the impact of radial migration in the Milky Way disc. Open clusters are groups of coeval stars that formed together from the same molecular cloud, and thus they share the same chemical composition (for a review about star cluster formation and evolution in galactic and cosmological contexts, see Renaud 2018). Since stars in clusters are gravitationally bound, they move together in the Galactic potential field and are subject to the same perturbations. Therefore, open clusters are expected to migrate as a coherent group. However, some perturbations might cause individual stars to escape from the cluster (for numerical simulations capturing the importance of the small-scale, rapidly varying tidal component in altering the mass-loss of clusters, see Li et al. 2017) and become part of the field population (e.g., Moyano Loyola & Hurley 2013), and vice versa (e.g., Mieske & Baumgardt 2007). Fukushige & Heggie (2000) showed that the escape time of a star from its parent cluster is also related to orbital parameters. Gravitational perturbations can also lead to cluster–cluster interactions (e.g., Khoperskov et al. 2018; de la Fuente Marcos et al. 2014), which may be important in the formation of the bar structures in disc galaxies (Yoon et al. 2019).
Due to their different initial conditions, stars in open clusters and isolated stars are expected to be affected differently by migration. Both populations are impacted by gravitational interactions with the spiral arms and the Galactic bar, with other clusters, and with molecular clouds. However, member stars of open clusters are also strongly influenced by the cluster’s internal dynamics, and we can consider each cluster, taken as a whole, as a more massive particle than a single star, and therefore we might hypothesise that its kinematics are impacted differently by gravitational interactions with respect to single stars. To assess the amount of these differences, N-body simulations of gravitational interactions with particles of different masses would be needed. Seminal works, such as that of Terlevich (1987), have investigated the effect of tidal heading and molecular cloud encounters in shaping the halo of clusters and determining their lifetime, and a more recent work has used N-body simulations to analyse the interactions of star clusters with spiral arms (Fujii & Baba 2012).
From an observational point of view, Spina et al. (2021), using data from the Galactic Archaeology with HERMES (GALAH; De Silva et al. 2015; Buder et al. 2021) and Apache Point Observatory Galactic Evolution Experiment (APOGEE-1 and APOGEE-2; Ahn et al. 2014; Jönsson et al. 2020) surveys, found that the open cluster population traces the distribution of chemical elements differently than field stars. The authors suggested that such a difference is a consequence of selection effects shaping the demography of the two populations in different ways. In fact, while field stars undergoing frequent interactions with the Galactic potential would simply migrate on different orbits, open clusters would also dissipate until they faced their complete disruption. The effect of radial migration has been studied in regard to some specific open clusters. A well-known example is the open cluster NGC 6791, one of the oldest and most metal-rich open clusters. For this cluster, Jílková et al. (2012) proposed a model that suggests its migration from the inner disc to its current location was due to a strong influence of the bar and spiral-arm perturbations on its orbit. A systematic study of migration in a significant sample of open clusters was carried out by Chen & Zhao (2020). They used a sample of 146 open clusters to investigate the kinematics and metallicity distribution of open clusters in the Galactic disc, and they found evidence for significant radial migration. Zhang et al. (2021) analysed the metallicity gradient of 225 open clusters, identifying three sequences of clusters that represent outward migrators, in situ clusters, and inward migrators. Their study suggests that radial migration is an important process in the evolution of the Galactic disc and has a complex effect on the metallicity gradient.
Overall, the survival of star clusters is a complex process that depends on a variety of factors. For instance, some clusters may be more susceptible to disruption than others, but the exact conditions that determine their longevity are still not fully understood. Their structural parameters, such as mass, density, and size, are expected to play a crucial role in determining their survival time (de Grijs & Parmentier 2007). More massive clusters are generally more tightly bound (Kruijssen 2012) and therefore less subject to disruption, while less massive clusters are likely more easily disrupted. In addition, irrespective of their mass, more compact and denser clusters have a higher probability of surviving, as they have a greater gravitational binding energy and are less likely to be disrupted by external forces (for a discussion of the cluster compactness as a function of Galactocentric distance, see Angelo et al. 2023). The environment in which a cluster is located can also affect its survival (e.g., Grebel et al. 2000; Lamers et al. 2005). Thus, the dissolution mechanisms of the clusters (initial gas loss, stellar evolution, relaxation, and external tidal perturbations) change over time and also depend on the position of the cluster in its parent galaxy (Baumgardt 2009). Clusters that are located in denser regions of the Galaxy, such as the disc towards the Galactic centre or spiral arms, are more likely to be subject to disruptive tidal forces caused by the Galactic bar, the spiral arms, or molecular clouds (e.g., Portegies Zwart et al. 2002; Baumgardt & Makino 2003; Gieles et al. 2006, 2007). On the other hand, clusters that are located in less dense regions, such as the Galactic halo, are usually more isolated and therefore less susceptible to disruption (Meng & Gnedin 2022). Finally, the dynamical evolution of the cluster can also play a role in its survival. Over time, the cluster will undergo a process of mass segregation, where more massive stars sink to the centre of the cluster and interact more strongly with each other (e.g., Allison et al. 2010). In the short term, this can lead to the ejection of stars of lower masses from the cluster and can ultimately cause the cluster to dissolve. However, if the cluster is able to maintain a balance between the processes of mass segregation and two-body relaxation, it may be able to survive for a longer period of time.
By comparing the properties of clusters and field stars, the present paper aims to shed light on the role of radial migration in shaping the distribution of stellar populations in the Galactic disc as well as their metallicities. Furthermore, we aim to clarify the nature of the surviving old clusters, a small number out of the total percentage of known clusters, and determine whether it is possible to use them as tracers for the past composition of the Galactic disc. This paper is structured as follows: Sect. 2 provides a description of the Gaia DR3 open clusters and field star samples, details how the sub-samples were selected, and describes how the ages of the latter were determined. Section 3 presents a comparison of the kinematic properties of clusters and field stars, specifically their space velocities, orbits, and actions over time. Finally, we discuss the results in Sects. 4 and 5 is where we draw out our conclusions.
2. The samples
2.1. The sample of open clusters in Gaia DR3
We considered a sample of ∼300 000 member stars of ∼2700 open clusters with data from Gaia DR3 (Gaia Collaboration 2021), from which we selected ∼8000 member stars with available Gaia spectroscopic atmospheric parameters and abundances from the Gaia General Stellar Parametrizer from spectroscopy (GSP-spec; Recio-Blanco et al. 2023). To select a sample of high-quality data, we used high-quality (HQ) and medium-quality (MQ) indicators derived from a combination of Gaia GSP-spec flags and defined in Gaia Collaboration (2023, see their Appendix B for a complete definition of the GSP-spec flag ranges used to produce the HQ and MQ samples). The MQ sample defined in Gaia Collaboration (2023) contains about ∼41 000 000 stars with a median uncertainty in [M/H] of about 0.06 dex and a median uncertainty in [α/Fe] of about 0.04 dex. In contrast, the HQ sample stars (∼2 200 000) have very low parameter uncertainties, in particular, a median uncertainty in [M/H] of ∼0.03 dex and of ∼0.015 in [α/Fe]. Through this selection, we obtained a sample of about ∼4000 members of open clusters. The relationships between the calibrated GSP-spec parameters ([Fe/H], Teff, log g) for our sample of open cluster member stars, belonging to about ∼1000 OCs, are shown in Fig. 1. Since the log g determination is slightly biased in Gaia GSP-spec, we used the calibrated values ‘logg_gspspec_calibrated’, ‘mh_gspspec_calibrated’, and ‘alphafe_gspspec_calibrated’ as presented in Recio-Blanco et al. (2023, Sects. 9.1.1 and 9.1.2, Eqs. (1), (2), and (5)). These corrections basically use fitted coefficients from literature trends to adjust log g, and a similar correction is suggested for metallicity and [α/Fe] based on a fourth-degree polynomial fit of residuals against uncalibrated log g. The membership of stars in clusters as well as general cluster parameters and their ages are taken from Cantat-Gaudin et al. (2020). Relationships between the average metallicity, age, and Galactocentric distance for our sample of open clusters are shown in Fig. 2.
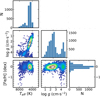 |
Fig. 1. Relationships of the calibrated GSP-spec parameters for the ∼4000 member stars of open clusters with HQ = 1 and/or MQ = 1 quality flags. |
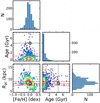 |
Fig. 2. Relationships of ages and Galactocentric distances for the ∼1000 open clusters. The dashed red lines indicate the cut-off in age and RGC. |
To analyse the effect of migration, we considered only clusters with an age ≥1 Gyr. Indeed, the orbits of the youngest open clusters are not expected to be strongly affected by migration given the limited number of encounters or disturbances they may have had in their short lives. This reduced the sample to 201 clusters (20% of the total), from which we extracted those with a high probability (P > 0.9) of belonging to the thin disc, which is estimated as indicated below.
At this point, we computed the thin-thick disc components’ separation and membership probability using the support vector machines (SVMs) analysis (Boser et al. 1992), already adopted in Viscasillas Vázquez et al. (2022). We defined a training set based on the sample of Costa Silva et al. (2020), which has similar characteristics to our sample, with [α/Fe]–[Fe/H] derived by Delgado Mena et al. (2017). We included the thin and thick disc populations as well a high-α metal-rich population (hαmr). We trained the SVM in the multiclass case with a radial basis function (RBF) and implemented it using the SCIKIT-LEARN package (Pedregosa et al. 2011). We calculated the membership probabilities calibrated using Platt scaling extended for multi-class classification (Wu et al. 2004). We transferred the classification probability to the open cluster population. We obtained a final sample of 168 open clusters with a high probability of belonging to the thin disc (P > 0.9) in the metallicity range [Fe/H] = [−0.74, 0.45]. Their location in the Tinsley–Wallerstein diagram (TWD) is shown in Fig. 3, together with ∼200 000 main sequence turn off (MSTO) field stars potentially from the thin disc (see Sect. 2.2). Of these, 138 OCs (82%) are located in the Galactocentric interval 6 kpc < RGC < 11 kpc.
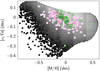 |
Fig. 3. Tinsley–Wallerstein diagram for the ∼200 000 MSTO field stars (grey symbols) and ∼170 open clusters (pink symbols). Both are potentially from the thin disc and have similar characteristics. The clusters with a green edge represent those in the solar region (∼40 open clusters). |
A similar analysis can be done using [Ca/Fe] instead of [α/Fe] since the two ratios are very close (CaII IR triplet is the dominant source of α-element abundances in the Gaia spectral range). Van der Swaelmen et al. (in prep.) preformed the thin-thick disc separation using both [Ca/Fe] and [α/Fe], finding very similar results for the open cluster population. The result is actually expected since (as mentioned above) in Gaia, Ca abundance is the dominant contributor to [α/Fe]. On the other hand, the use of other α elements might give slightly different results, such as Mg, which shows a different growth than the other α elements at super-solar metallicities (see, e.g., Magrini et al. 2017; Palla et al. 2022). Finally, we mention that we did not include the treatment of the uncertainties when applying the SVM analysis to separate the two disc populations since we are interested only in a statistical separation and doing so would make the analysis more difficult. The choice of a membership probability P > 0.9 implies that stars or clusters at the edge between the two populations are automatically excluded, and only those with a high probability of belonging to one of the discs are considered (see Fig. 4). This especially happens for field stars, as the majority of the clusters have a high probability of belonging to the thin disc. The properties of the final sample of clusters used throughout this study are included in Table A.1.
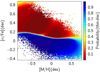 |
Fig. 4. Approximately 900 000 MSTO field stars in the [α/Fe] versus [M/H] plane. The stars are colour coded according to their probability of belonging to the thin disc. |
2.2. The sample of field stars
We selected nearly five million stars included in the GSP-spec sample (Recio-Blanco et al. 2016) belonging to the catalogue of about 30 million stars in the Radial Velocity Spectrometer (RVS). Among them, we selected those located around the MSTO, as shown in Fig. 5, since their ages are expected to be more accurate and reliable than those of stars in different evolutionary phases (e.g., Howes et al. 2019). To perform this selection, we considered stars that have a log g between 3.8 and 4.3 and a Teff between 5600 and 6900 K, as was done in Chen et al. (2022). This reduced the sample to about 900 000 stars (16% of the total sample). Figure 5 shows the Kiel diagram (KD) for the approximately five million field stars with the ∼900 000 MSTOs stars indicated with a box. Of these ∼900 000 stars, we selected ∼200 000 potentially belonging to the thin disc (P > 0.9) using the same techniques and the same training set as for the open clusters. In this way, the field star sample has a very similar metallicity range ([−0.86, 0.59]) to that of the open clusters. About 99% of the stars in the selected MSTO-thin disc sample are located between 7.5 kpc < RGC < 9 kpc (expressed in the catalogue by the column ‘R_med_dgeo’). From this set of stars, we extracted only those whose ages were determined in Kordopatis et al. (2023, see Sect. 2.3 for the age determination and selection), and we applied to them the HQ and MQ selection defined in Gaia Collaboration (2023). The final sample consists of ∼66 000 stars selected in terms of HQ and MQ in the same way as the open cluster member stars. Finally, we ensured that we had consistent samples in terms of positions in the Galaxy with an ‘a posteriori’ selection (i.e., after applying the quality selections, we reduced the sample of the field stars to the thin disc and the Galactocentric region that we also wanted to map with clusters).
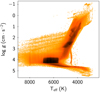 |
Fig. 5. Kiel diagram for the more than five million field stars of Gaia DR3. The location of the ∼900 000 MSTO stars is indicated with a red box. |
2.3. Ages of field stars
For a high-confidence age determination, we selected a sub-sample of stars that meets the following characteristics: the standard deviation, σ, of the five ages calculated in Kordopatis et al. (2023) considering different types of projection (with different combinations of absolute magnitudes JHKG) and the age of the stars from the Final Luminosity Age Mass Estimator (FLAME; Andrae et al. 2018) provided by gaiadr3.astrophysical_parameters should be less than 1 Gyr. We selected the average of the six determinations as our final age, and we used the standard deviation as its uncertainty. As for open clusters, we considered only stars with ages greater than 1 Gyr. We find it important to note that the ages published in Kordopatis et al. (2023) were obtained from calibrated stellar parameters, while the FLAME ages were not. This may have a non-negligible effect on the ages of giants, for which the effect of calibrated log g is larger, but it should be minimal in the case of MSTOs. By construction, our sample of field stars contains stars with uncertainties in age less than 1 Gyr. These values are comparable to those obtained for clusters. From the paper of Cantat-Gaudin et al. (2020), the uncertainty on the determination of log(age) ranges from 0.15 to 0.25 for young clusters and from 0.1 to 0.2 for old clusters. Considering that we have only ‘old’ clusters in our sample (i.e. with an age greater than 1 Gyr), the typical uncertainties range from 0.2 to 0.3 Gyr for the youngest clusters in our sample to about 1 Gyr for the oldest ones. They are therefore comparable and consistent with the uncertainties of the selected field star sample.
Figure 6 shows the relationships between age, Galactocentric distance RGC, and metallicity for the selected samples. Both the clusters and the field stars occupy a similar range of metallicity. However, the ages of the field stars span a wider range than those of the clusters, since clusters generally do not survive beyond 7 Gyr. On the other hand, the selected clusters comprise a sample with a wider range of Galactocentric distances since the cluster member stars are mostly luminous red giants (i.e., they are easier to observe at large distances than the selected MSTO field stars). Finally, the difference in the types of stars observed among the field stars and in the clusters could generate observational biases, for example, in the derived metallicities. In parallel to the present paper, Van der Swaelmen et al. (in prep.) are carrying out a work that aims to compare and validate Gaia spectroscopic parameters by comparing them with the Gaia-ESO spectroscopic parameters. They confirm that there is an excellent agreement between the calibrated spectroscopic metallicities and [α/Fe] of both giants and dwarfs in Gaia-ESO and in Gaia. So taking the Gaia-ESO survey as a reference, there are no systematic differences in Gaia’s calibrated metallicities and [α/Fe] when considering giants and dwarfs.
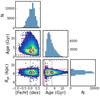 |
Fig. 6. Relationships between the properties of the ∼70 000 selected field stars: number of stars, ages, and Galactocentric distances. The red dashed lines indicate the cut-off in age and RGC. |
3. Comparing the kinematic properties of clusters and field stars
In this section, we compare the evolution over time of the space velocities, orbital parameters, and orbital action of a reduced sample of clusters and of a sample of field stars located in the same Galactocentric region. The radial distribution in the Qxx quantiles (percentiles) of the ∼70 000 field stars is RGC [Q01, Q10, Q90, Q99] [7.53, 7.82, 8.69, 8.96] (kpc). Thus, 98% of the field stars (∼68 000) are located between 7.53 and 8.96 kpc. From this group, we selected 66 000 HQ and MQ stars. We also selected the corresponding 41 clusters (see Fig. 3) located in the regions [7.5–9] kpc.
The three-dimensional Galactocentric coordinates, (cylindrical) space velocities, and orbital parameters of the sample field stars are from Gaia Collaboration (2023). The Galactocentric coordinates X, Y, Z (in Cartesian coordinates), the Galactocentric distance (RGC), and cylindrical space velocities (radial VR, tangential Vϕ, vertical VZ) in a right-handed coordinate system were computed from the right ascension, declination, line-of-sight velocity, proper motions, and the EGDR3 geometric and photogeometric Bayesian line-of-sight distances from Bailer-Jones et al. (2021). The authors assumed a solar position (R, Z)⊙ = (8.249, 0.0208) kpc, and the solar cylindrical velocity components are (VR, Vϕ, VZ)⊙ = (−9.5, 250.7, 8.56) km s−1 (GRAVITY Collaboration 2020). Their orbital parameters were computed with the GALPY code (Bovy 2015) using the axisymmetric Galactic potential of McMillan (2017). For the clusters, we computed the orbits in a consistent way with GALPY, using the clusters mean parallaxes, radial velocities, and distances from Gaia. Due to the large number of field stars and their high density, we used a point density function (gaussian_kde) to represent them (see Figs. 7–9) and implemented the function using scipy.stats, determining the density of stars at each point and assigning that value to the colours in the colour map. For an easier comparison, the ∼66 000 field stars are also shown in equally distributed bins using a ‘quantile-based discretisation function’, defining the bins using percentiles based on the distribution of the data. We divided the data into 14 quantiles (q) of approximately ∼5000 stars each and computed the mean and dispersion for each bin. In Figs. 7–9 we also show regressions (linear and non-linear) applied to both samples using the ordinary least squares (OLS) method and a nonparametric locally weighted linear regression (LOWESS) model respectively implemented using statsmodels. For a better comparison, we also applied a Pearson and Spearman statistical correlation test computed using scipy.stats in order to measure the strength and direction of the relationship (linear and monotonic) between variables. In Figs. A.1–A.10, we also show the cumulative distribution functions (CDFs) and the results of the two-sample Kolmogorov–Smirnov test statistic (Kolmogorov 1933; Smirnov 1939) computed using scipy.stats. This allowed us to analyse in more detail the distribution of the data of both samples and find the location of the maximum absolute difference between the two cumulative distributions.
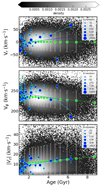 |
Fig. 7. Space velocities (VR, Vϕ and |VZ|) for ∼66 000 field stars from our selected sample and 41 open clusters in the solar region. The data are presented in equally distributed bins (q = 14) for field stars (lime). In the background, the field stars are also shown on a density plot that is coded according to the black to white colour bar. The size of the symbols for clusters (blue circles) are proportional to the square root of their number of members ( |

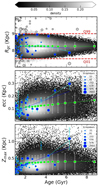 |
Fig. 8. Orbital parameters (R, e and Zmax) for ∼66 000 field stars from our selected sample and ∼40 open clusters in the solar region. The data are presented in equally distributed bins (q = 14) for field stars (lime squares). In the background, the field stars are also shown on a density plot that is coded according to the black to white colour bar. The symbols and colours are the same as in Fig. 7. |
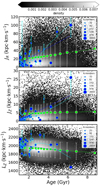 |
Fig. 9. Orbital actions (JR, JZ and LZ) for ∼66 000 field stars from our selected sample and ∼40 open clusters in the solar region. The data are presented in equally distributed bins (q = 14) for field stars (lime). In the background, the field stars are also shown on a density plot that is coded according to the black to white colour bar. The symbols and colours are the same as in Fig. 7. |
3.1. Space velocities over time
Stars and open clusters orbit the Galactic centre in quasi-circular orbits. The distribution of velocities of stars in the thin disc of the Galaxy is a function of the age of the stars. Younger stars, which formed relatively recently, have tangential velocities that are close to those of the Galactic disc at the solar location and the Sun (i.e., ∼240–250 km s−1, Russeil et al. 2017; GRAVITY Collaboration 2020). This is because they are on less perturbed orbits. In contrast, older stars typically have smaller tangential velocities because they are likely on more elliptical orbits. In this section, we aim to compare the velocity components of stars and clusters in order to investigate whether there are substantial differences in their behaviours. In Fig. 7, we show the three components of the Galactic space velocities of star clusters compared to those of field stars as a function of stellar ages. In Table 1, we show the coefficients of the linear regressions and the Pearson and Spearman correlation coefficients (PCCs and SCCs, respectively) with their associated p-values. We recall that with a p-value less than 0.05, the results are considered to be statistically significant, implying that the observed correlation is not simply the result of chance and is more likely to reflect a real relationship between the variables. If the p-value is greater than 0.05, the results are not statistically significant, which means that there is not enough evidence to reject the null hypothesis, and a significant relationship between the variables cannot be confirmed.
Linear regression coefficients (slope and y-intercept) obtained using the least squares method, as well as Pearson and Spearman correlation coefficients and their p-values for both cluster and field star samples.
Field stars and open clusters show correlations in their trends of radial VR, tangential Vϕ, and vertical VZ velocities as a function of stellar ages, which are in some cases different (see the coefficients of the linear regressions in Table 1). Some of these differences also have statistical evidence (low p-values), while others are statistically weaker, likely due to the limited number of old clusters and to the scatter of their properties.
The average radial velocity (Fig. 7, upper panel) of field stars is quite constant over time, with a scatter increasing in the older populations. Young clusters have a slightly lower radial component than field stars and show significant scatter. The correlations are neither very strong nor statistically significant in either case (high p-values in Table 1). The tangential velocity component, Vϕ (Fig. 7, central panel), is close to that of the Milky Way disc rotation for objects moving along circular orbits at the Sun location (Russeil et al. 2017). Several young clusters have a higher Vϕ than the field stars in the same age range, and the intercept of the regression for star clusters is higher than that of field stars (249 km s−1 vs. 239 km s−1). As the ages of clusters and stars increase, the two trends tend to converge, although the number of old clusters decreases dramatically after 3 Gyr. This is well reflected in the LOWESS model, which is able to keep the changes between the behaviour of young and old clusters. In this case, the linear correlation is statistically significant for field stars (with very low p-values), while it is not significant for clusters. Concerning the absolute vertical velocity, |VZ| (Fig. 7, bottom panel), it increases in both populations over time. However, young clusters have a smaller vertical velocity component than field stars, reaching the vertical velocities of field stars only for ages above 4 Gyr. In this case, the linear correlations are statistically significant in both samples. The clusters show higher PCCs and SCCs than the field stars, indicating a stronger correlation (see Table 1). The combination of the three results, which are obviously interconnected, show that during the first 1–3 Gyr, the orbits of star clusters remain more circular than those of field stars, while older clusters have typically more perturbed velocity components than field stars.
3.2. Orbital parameters and actions over time
Using the velocity components and the distance of a star and assuming a gravitational potential, the orbit of a star, characterised by its guiding radius R, its eccentricity e, and its inclination, parameterised by the maximum height reached above the plane, Zmax, can be derived. Circular orbits have eccentricities closer to zero and will reach low heights above the plane.
In Fig. 8, we show the Galactocentric radius and the orbital parameters e and Zmax as a function of stellar ages. In the upper panel of the figure, we present the distribution of RGC as a function of stellar ages. As per sample selection, field stars and clusters are confined between 7.5 and 9 kpc. In the central panel, we show the relation between the eccentricity of the orbit and stellar ages. During the first 3 Gyr, clusters and field stars show a slightly different behaviour. On average the orbits of clusters have lower eccentricities (e < 0.1, on average), that is, they are more circular and less perturbed than those of field stars. However, as time passes, clusters proceed faster towards more eccentric orbits (e > 0.1), or equivalently, open clusters with low eccentricity do not exist anymore (at least in our sample limited to the solar neighbourhood). The correlations are significant in both cases, but the effect is more pronounced in clusters (higher PCCs and SCCs). Finally, in the bottom panel of Fig. 8, we show the maximum height, Zmax, above the plane as a function of stellar ages. As for the eccentricity of the orbits, younger clusters orbit closer to the Galactic plane than field stars with the same age. However, the situation changes for the clusters that survive beyond ∼3 Gyr and reach greater heights above the Galactic plane, while field stars experience similar but smoother changes over time. The correlations are statistically significant in both cases, but again, the increase is steeper in clusters (higher PCCs and SCCs).
An equivalent approach to the use of the orbital parameters is to describe the motion of a star or stellar cluster based on its orbital actions, which includes three fundamental quantities that are used to describe the motion of a particle (either a star or cluster) in a rotating galaxy. The radial action (JR) describes the component of a star’s angular momentum in the direction of the Galactic centre, the vertical action (Jz) describes the component of a star’s angular momentum perpendicular to the Galactic plane, and the azimuthal action (LZ, equivalent to Jϕ) describes the component of a star’s angular momentum around the Galactic centre. In axisymmetric potentials, the orbital actions are used to quantify the amount of oscillation of a star along its orbit in the Galactocentric directions (R, ϕ, z; see Binney & Tremaine 2008). For the interpretation of the orbital actions, we followed Trick et al. (2019). According to the authors, the radial action JR can be considered a measure of the orbit eccentricity or the radial extent of a disc’s orbit in-plane epicyclic rosette; the azimuthal action, Jϕ, is equivalent to the angular momentum in the z-direction, Lz, and it describes the amount of rotation around the Galactic centre; and the vertical action, Jz, quantifies the displacement above and below the Galactic plane.
In Fig. 9, we show the orbital actions of the clusters compared to the field stars. In the upper panel, we show the radial action JR over time. As state above, its behaviour is similar to that of the eccentricity. Thus, young clusters typically have a lower JR than field stars. The correlations are statistically significant in both cases, with a steeper growth for clusters (higher PCCs and SCCs). In the central panel of Fig. 9, we present the vertical action Jz that indicates the displacement above and below the Galactic plane. Also in this case, the younger clusters of our sample do not exhibit a large vertical excursion around the plane, while the trend indicates that older clusters are more likely to explore regions far from the plane due to their inclined orbit. As in the |VZ| case, the correlations are statistically significant in both cases (p-values < 0.05) but stronger for the clusters (higher PCCs and SCCs). Finally, the LZ in young clusters is larger than in field stars, thus again indicating that the orbits of clusters are closer to being circular compared to those of field stars. However, due to the large scatter in the cluster data, the relationship between LZ and age has a very low statistical relevance, which was confirmed by the high p-values (0.118 for PCC and 0.623 for SCC).
4. Discussion on the old surviving clusters
There is some statistical evidence that correlations exist between kinematic properties of clusters and field stars and their ages, and that such a correlation might differ in some cases, indicating a different behaviour for field stars and clusters. In other cases, these differences do not have sufficient statistical value. From the comparison of the kinematic and orbital properties of the cluster and field star population (in particular VZ, Zmax, and JZ, for which PCC and SCC have low p-values), we can conclude that the former are on average more resistant to perturbative effects up to an age of about 3 Gyr and move on quasi-circular orbits that lie close to the Galactic plane. On the other hand, clusters older than 3 Gyr are quite scattered on the kinematical property-age planes, with some of them having orbits with a higher eccentricity (i.e., more inclined), thus reaching higher heights on the plane. The fact that several old clusters have eccentric orbits (e > 0.15) is not a cause in itself, but rather it is likely a consequence of the passage of time and a necessary condition to allow for their survival (Cai et al. 2016). Several authors have claimed that even in the first million years, interactions with molecular clouds are more disruptive for low-mass clusters (see, e.g., Gieles & Renaud 2016), and only massive clusters with peculiar orbits might survive the interactions that happen in the Galactic disc in the following gigayear (Moitinho et al. 2010; Buckner & Froebrich 2014). The reason why the oldest clusters now stand out might be related to a natural selection effect, since clusters located closer to the Galactic plane would have more interaction and thus dissolve more rapidly. However, it is unclear why interactions that are proven to cause such drastic changes in the orbit do not lead to the destruction of the cluster as Friel (1995) pointed out and we do not know which the physical properties that have made these clusters survive until today are. Gustafsson et al. (2016) demonstrated that just a small fraction of massive clusters can survive for several gigayears and that only 0.5% of all formed massive open clusters are predicted to end with a high altitude on the plane.
To seek answers to these questions, we examined some of the examples of the surviving old clusters to get an idea of their general characteristics. Old open clusters are indeed rare, as star clusters dissipate over time. We expected that only the most massive, dense, and well-placed clusters can survive several gigayears (Boesgaard et al. 2015). In Fig. 10, we plot our sample of 41 clusters with symbols proportional to their number of members (as estimated from Gaia in Cantat-Gaudin et al. 2020). Most of the clusters older than 3 Gyr have a high average number of members. Younger clusters have a more variable number of members, ranging from highly populated clusters, such as NGC 2477, to clusters with only a few members, such as UBC 139 (members from Cantat-Gaudin et al. 2020).
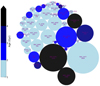 |
Fig. 10. Our selected sample of 41 open clusters on the thin disc and solar region sized by the total number of members, coloured by age, and labelled by cluster name and number of member stars considered in this study. |
Among the oldest clusters, there are some clusters that stand out because they are more populated than others: NGC 6791, NGC 2682 (M 67), and Trumpler 19. Their large number of members was also confirmed using methods based on the DBSCAN algorithm, which is complementary to the kinematic methods (Gao et al. 2014). The common characteristics of these clusters are that they are currently high above the Galactic plane, still have a high density and a large number of members, and have a relatively high metallicity. In particular, NGC 2682 is located in a low density region, and it has not likely experienced significant gravitational interactions that could have affected its structure (cf. Davenport & Sandquist 2010). Recent works have revealed that it is more massive than previously believed (Carrera et al. 2019) and that it underwent a mass segregation process (e.g., Geller et al. 2015), which on a long-term timescale could make the cluster tightly bound and less likely to disperse. Finally, the oldest and most highly populated cluster in our sample is NGC 6791, which is among the most studied clusters due to its various peculiarities, such as its high eccentricity and maximum height above the plane coupled with a high metallicity. Indeed, NGC 6791 has an orbit more similar to that of a globular cluster or a dwarf galaxy than to that of a thin disc open cluster (Carraro & Chiosi 1994; Jílková et al. 2012). Gustafsson et al. (2016) suggested that NGC 6791 maintained so many members because several generations of stars have formed within it. For example, the material expelled by AGB stars inside the cluster was retained within it and would later be the seed for the birth of new generations of stars. However, there is no evidence of chemical anomalies or a large abundance spread in NGC 6791 (Carretta et al. 2007; Bragaglia et al. 2014). As seen in Viscasillas Vázquez et al. (2022), NGC 6791 is chemically misplaced, not only because of its higher metallicity but also for its [α/slow-neutron capture] element ratios, which do not agree to those of clusters found in the same region. Hence, this emphasises the importance of taking migration into account in chemical evolution studies. In conclusion, it appears that in the solar neighbourhood, the common properties of the oldest clusters that have managed to survive include a large initial mass and fortuitous orbital conditions (cf. van den Bergh & McClure 1980). However, in different parts of the Galaxy, such as the outer Galaxy, the ability to observe clusters is linked to possible observational biases, which favour the detection of massive, distant clusters high on the plane.
5. Summary and conclusions
We conducted a purely observational study using high-quality spectroscopic Gaia DR3 data to identify the differences between the kinematics of a selected population of field stars and open clusters. For a meaningful comparison between the kinematic and dynamical properties of clusters and field stars, we restricted our sample to the radial region [7.5–9 kpc]. Furthermore, we restricted our sample to clusters older than 1 Gyr because our aim was to estimate the effect of migration, which is negligible for younger clusters. We selected a sample of field stars around the MSTO so as to have a better determination of their ages. We compared the velocity components, the orbital parameters, and orbital actions of our sample of ∼66 000 field stars and 41 open clusters. We conducted a statistical analysis in order to test the significance of the results. Open star clusters younger than 2–3 Gyr maintain circular orbits and have a dominant tangential component Vϕ in their velocity compared to field stars with similar ages. This corresponds to more circular orbits (lower eccentricity and lower height from the Galactic plane), and it is also reflected in the orbital actions. In particular, we observed lower JR and JZ for the clusters with ages below 2–3 Gyr than for field stars of the same age. On the other hand, older clusters are more rare, are characterised by more perturbed orbits, and are typically found higher on the plane. These characteristics together with being (or having been) massive seem to have been essential to ensuring the survival of the clusters for several gigayears. Thus, although they are still chemical tracers of the Galaxy’s past composition, the oldest clusters do not reflect the composition of the places where they are currently found. As already noticed in Magrini et al. (2023), the radial metallicity gradient of clusters older than 3 Gyr shows a higher level of scatter, and it is not obvious as to how to use it to study the temporal evolution of the gradient unless kinematic constraints are also considered.
Acknowledgments
The authors thank the anonymous referee for her/his constructive and insightful suggestions which greatly improved the paper. This work has made use of data from the European Space Agency (ESA) mission Gaia (https://www.cosmos.esa.int/gaia), processed by the Gaia Data Processing and Analysis Consortium (DPAC, https://www.cosmos.esa.int/web/gaia/dpac/consortium). Funding for the DPAC has been provided by national institutions, in particular the institutions participating in the Gaia Multilateral Agreement. This work also made use of SciPy (Virtanen et al. 2020), Astropy (Astropy Collaboration 2018), SCIKIT-LEARN Machine Learning (Pedregosa et al. 2011), StatsModels (Seabold & Perktold 2010), Seaborn (Waskom 2021), TopCat (Taylor et al. 2005), Pandas (Pandas Development Team 2020) and Matplotlib (Hunter 2007). C.V.V. and L.S. thank the EU programme Erasmus+ Staff Mobility for their support. C.V.V. and G.T. acknowledge funding from the Lithuanian Science Council (LMTLT, grant No. P-MIP-23-24). L.M. and C.V.V. thank INAF for the support (MiniGrant Checs).
References
- Ahn, C. P., Alexandroff, R., Allende Prieto, C., et al. 2014, ApJS, 211, 17 [NASA ADS] [CrossRef] [Google Scholar]
- Allison, R. J., Goodwin, S. P., Parker, R. J., Portegies Zwart, S. F., & de Grijs, R. 2010, MNRAS, 407, 1098 [NASA ADS] [CrossRef] [Google Scholar]
- Andrae, R., Fouesneau, M., Creevey, O., et al. 2018, A&A, 616, A8 [NASA ADS] [CrossRef] [EDP Sciences] [Google Scholar]
- Angelo, M. S., Santos, J. F. C., Jr., Maia, F. F. S., & Corradi, W. J. B. 2023, MNRAS, 522, 956 [NASA ADS] [CrossRef] [Google Scholar]
- Astropy Collaboration (Price-Whelan, A. M., et al.) 2018, AJ, 156, 123 [Google Scholar]
- Bailer-Jones, C. A. L., Rybizki, J., Fouesneau, M., Demleitner, M., & Andrae, R. 2021, AJ, 161, 147 [Google Scholar]
- Baumgardt, H. 2009, in Globular Clusters - Guides to Galaxies, eds. T. Richtler, & S. Larsen, 387 [CrossRef] [Google Scholar]
- Baumgardt, H., & Makino, J. 2003, MNRAS, 340, 227 [NASA ADS] [CrossRef] [Google Scholar]
- Binney, J., & Tremaine, S. 2008, Galactic Dynamics, 2nd edn. (Princeton: Princeton University Press) [Google Scholar]
- Boesgaard, A. M., Lum, M. G., & Deliyannis, C. P. 2015, ApJ, 799, 202 [NASA ADS] [CrossRef] [Google Scholar]
- Boser, B. E., Guyon, I. M., & Vapnik, V. N. 1992, in Proceedings of the Fifth Annual Workshop on Computational Learning Theory, COLT ’92 (New York: Association for Computing Machinery), 144 [CrossRef] [Google Scholar]
- Bovy, J. 2015, ApJS, 216, 29 [NASA ADS] [CrossRef] [Google Scholar]
- Bragaglia, A., Sneden, C., Carretta, E., et al. 2014, ApJ, 796, 68 [CrossRef] [Google Scholar]
- Buckner, A. S. M., & Froebrich, D. 2014, MNRAS, 444, 290 [Google Scholar]
- Buder, S., Sharma, S., Kos, J., et al. 2021, MNRAS, 506, 150 [NASA ADS] [CrossRef] [Google Scholar]
- Cai, M. X., Gieles, M., Heggie, D. C., & Varri, A. L. 2016, MNRAS, 455, 596 [NASA ADS] [CrossRef] [Google Scholar]
- Cantat-Gaudin, T., Anders, F., Castro-Ginard, A., et al. 2020, A&A, 640, A1 [NASA ADS] [CrossRef] [EDP Sciences] [Google Scholar]
- Carraro, G., & Chiosi, C. 1994, A&A, 287, 761 [NASA ADS] [Google Scholar]
- Carrera, R., Pasquato, M., Vallenari, A., et al. 2019, A&A, 627, A119 [NASA ADS] [CrossRef] [EDP Sciences] [Google Scholar]
- Carretta, E., Bragaglia, A., & Gratton, R. G. 2007, A&A, 473, 129 [NASA ADS] [CrossRef] [EDP Sciences] [Google Scholar]
- Chen, Y. Q., & Zhao, G. 2020, MNRAS, 495, 2673 [NASA ADS] [CrossRef] [Google Scholar]
- Chen, X., Ge, Z., Chen, Y., et al. 2022, ApJ, 929, 124 [CrossRef] [Google Scholar]
- Costa Silva, A. R., Delgado Mena, E., & Tsantaki, M. 2020, A&A, 634, A136 [EDP Sciences] [Google Scholar]
- Davenport, J. R. A., & Sandquist, E. L. 2010, ApJ, 711, 559 [NASA ADS] [CrossRef] [Google Scholar]
- de Grijs, R., & Parmentier, G. 2007, Chin. J. Astron. Astrofis., 7, 155 [CrossRef] [Google Scholar]
- de la Fuente Marcos, R., de la Fuente Marcos, C., & Reilly, D. 2014, Ap&SS, 349, 379 [NASA ADS] [CrossRef] [Google Scholar]
- Delgado Mena, E., Tsantaki, M., Adibekyan, V. Z., et al. 2017, A&A, 606, A94 [NASA ADS] [CrossRef] [EDP Sciences] [Google Scholar]
- De Silva, G. M., Freeman, K. C., Bland-Hawthorn, J., et al. 2015, MNRAS, 449, 2604 [NASA ADS] [CrossRef] [Google Scholar]
- Friel, E. D. 1995, ARA&A, 33, 381 [Google Scholar]
- Fujii, M. S., & Baba, J. 2012, MNRAS, 427, L16 [NASA ADS] [Google Scholar]
- Fukushige, T., & Heggie, D. C. 2000, MNRAS, 318, 753 [CrossRef] [Google Scholar]
- Gaia Collaboration (Brown, A. G. A., et al.) 2021, A&A, 649, A1 [NASA ADS] [CrossRef] [EDP Sciences] [Google Scholar]
- Gaia Collaboration (Recio-Blanco, A., et al.) 2023, A&A, 674, A38 [CrossRef] [EDP Sciences] [Google Scholar]
- Gao, X.-H., Chen, L., & Hou, Z.-J. 2014, Chin. Astron. Astrofis., 38, 257 [CrossRef] [Google Scholar]
- Geller, A. M., Latham, D. W., & Mathieu, R. D. 2015, AJ, 150, 97 [Google Scholar]
- Gieles, M., & Renaud, F. 2016, MNRAS, 463, L103 [Google Scholar]
- Gieles, M., Portegies Zwart, S. F., Baumgardt, H., et al. 2006, MNRAS, 371, 793 [Google Scholar]
- Gieles, M., Athanassoula, E., & Portegies Zwart, S. F. 2007, MNRAS, 376, 809 [CrossRef] [Google Scholar]
- GRAVITY Collaboration (Abuter, R., et al.) 2020, A&A, 636, L5 [NASA ADS] [CrossRef] [EDP Sciences] [Google Scholar]
- Grebel, E. K. 2000, in Massive Stellar Clusters, eds. A. Lançon, & C. M. Boily, ASP Conf. Ser., 211, 262 [NASA ADS] [Google Scholar]
- Gustafsson, B., Church, R. P., Davies, M. B., & Rickman, H. 2016, A&A, 593, A85 [NASA ADS] [CrossRef] [EDP Sciences] [Google Scholar]
- Howes, L. M., Lindegren, L., Feltzing, S., Church, R. P., & Bensby, T. 2019, A&A, 622, A27 [NASA ADS] [CrossRef] [EDP Sciences] [Google Scholar]
- Hunter, J. D. 2007, Comput. Sci. Eng., 9, 90 [NASA ADS] [CrossRef] [Google Scholar]
- Jílková, L., Carraro, G., Jungwiert, B., & Minchev, I. 2012, A&A, 541, A64 [Google Scholar]
- Jönsson, H., Holtzman, J. A., Allende Prieto, C., et al. 2020, AJ, 160, 120 [Google Scholar]
- Khoperskov, S., Mastrobuono-Battisti, A., Di Matteo, P., & Haywood, M. 2018, A&A, 620, A154 [NASA ADS] [CrossRef] [EDP Sciences] [Google Scholar]
- Kolmogorov, A. 1933, Giornale dell’ Istituto Italiano degli Attuari, 4, 83 [Google Scholar]
- Kordopatis, G., Schultheis, M., McMillan, P. J., et al. 2023, A&A, 669, A104 [NASA ADS] [CrossRef] [EDP Sciences] [Google Scholar]
- Kruijssen, J. M. D. 2012, MNRAS, 426, 3008 [Google Scholar]
- Kubryk, M., Prantzos, N., & Athanassoula, E. 2013, ArXiv e-prints [arXiv:1309.2437] [Google Scholar]
- Lamers, H. J. G. L. M., Gieles, M., & Portegies Zwart, S. F. 2005, A&A, 429, 173 [NASA ADS] [CrossRef] [EDP Sciences] [Google Scholar]
- Li, H., Gnedin, O. Y., Gnedin, N. Y., et al. 2017, ApJ, 834, 69 [NASA ADS] [CrossRef] [Google Scholar]
- Loebman, S. R., Debattista, V. P., Nidever, D. L., et al. 2016, ApJ, 818, L6 [NASA ADS] [CrossRef] [Google Scholar]
- Magrini, L., Randich, S., Kordopatis, G., et al. 2017, A&A, 603, A2 [NASA ADS] [CrossRef] [EDP Sciences] [Google Scholar]
- Magrini, L., Viscasillas Vázquez, C., Spina, L., et al. 2023, A&A, 669, A119 [NASA ADS] [CrossRef] [EDP Sciences] [Google Scholar]
- McMillan, P. J. 2017, MNRAS, 465, 76 [NASA ADS] [CrossRef] [Google Scholar]
- Meng, X., & Gnedin, O. Y. 2022, MNRAS, 515, 1065 [NASA ADS] [CrossRef] [Google Scholar]
- Mieske, S., & Baumgardt, H. 2007, A&A, 475, 851 [NASA ADS] [CrossRef] [EDP Sciences] [Google Scholar]
- Moitinho, A. 2010, in Star Clusters: Basic Galactic Building Blocks Throughout Time and Space, eds. R. de Grijs, & J. R. D. Lépine, 266, 106 [Google Scholar]
- Moyano Loyola, G. R. I., & Hurley, J. R. 2013, MNRAS, 434, 2509 [CrossRef] [Google Scholar]
- Palla, M., Santos-Peral, P., Recio-Blanco, A., & Matteucci, F. 2022, A&A, 663, A125 [NASA ADS] [CrossRef] [EDP Sciences] [Google Scholar]
- Pandas Development Team 2020, https://doi.org/10.5281/zenodo.10045529 [Google Scholar]
- Pedregosa, F., Varoquaux, G., Gramfort, A., et al. 2011, J. Mach. Learn. Res., 12, 2825 [Google Scholar]
- Portegies Zwart, S. F., Makino, J., McMillan, S. L. W., & Hut, P. 2002, ApJ, 565, 265 [NASA ADS] [CrossRef] [Google Scholar]
- Recio-Blanco, A., de Laverny, P., Allende Prieto, C., et al. 2016, A&A, 585, A93 [NASA ADS] [CrossRef] [EDP Sciences] [Google Scholar]
- Recio-Blanco, A., de Laverny, P., Palicio, P. A., et al. 2023, A&A, 674, A29 [NASA ADS] [CrossRef] [EDP Sciences] [Google Scholar]
- Renaud, F. 2018, New Astron. Rev., 81, 1 [CrossRef] [Google Scholar]
- Russeil, D., Zavagno, A., Mège, P., et al. 2017, A&A, 601, L5 [NASA ADS] [CrossRef] [EDP Sciences] [Google Scholar]
- Seabold, S., & Perktold, J. 2010, in 9th Python in Science Conference [Google Scholar]
- Sellwood, J. A., & Binney, J. J. 2002, MNRAS, 336, 785 [Google Scholar]
- Smirnov, N. V. 1939, Bull. Moscow Univ., 2, 3 [Google Scholar]
- Spina, L., Ting, Y. S., De Silva, G. M., et al. 2021, MNRAS, 503, 3279 [CrossRef] [Google Scholar]
- Taylor, M. B. 2005, in Astronomical Data Analysis Software and Systems XIV, eds. P. Shopbell, M. Britton, & R. Ebert, ASP Conf. Ser., 347, 29 [Google Scholar]
- Terlevich, E. 1987, MNRAS, 224, 193 [NASA ADS] [CrossRef] [Google Scholar]
- Trick, W. H., Coronado, J., & Rix, H.-W. 2019, MNRAS, 484, 3291 [NASA ADS] [CrossRef] [Google Scholar]
- van den Bergh, S., & McClure, R. D. 1980, A&A, 88, 360 [NASA ADS] [Google Scholar]
- Virtanen, P., Gommers, R., Oliphant, T. E., et al. 2020, Nat. Methods, 17, 261 [Google Scholar]
- Viscasillas Vázquez, C., Magrini, L., Casali, G., et al. 2022, A&A, 660, A135 [NASA ADS] [CrossRef] [EDP Sciences] [Google Scholar]
- Waskom, M. L. 2021, J. Open Source Softw., 6, 3021 [CrossRef] [Google Scholar]
- Wu, T.-F., Lin, C.-J., & Weng, R. C. 2004, J. Mach. Learn. Res., 5, 975 [Google Scholar]
- Yoon, Y., Im, M., Lee, G.-H., Lee, S.-K., & Lim, G. 2019, Nat. Astron., 3, 844 [NASA ADS] [CrossRef] [Google Scholar]
- Zhang, H., Chen, Y., & Zhao, G. 2021, ApJ, 919, 52 [NASA ADS] [CrossRef] [Google Scholar]
Appendix A: Complementary material
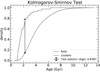 |
Fig. A.1. Kolmogorov-Smirnov (K-S) test comparing the cumulative distributions of age for the two samples. The age distribution of field stars is indicated with a black line and for clusters with a blue line. The vertical bars represent the values of the test statistic, which is the maximum absolute difference between the two cumulative distributions. |
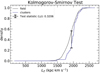 |
Fig. A.10. Kolmogorov-Smirnov test for LZ. Symbols and colours as in Fig. A.1. |
Properties of the open clusters used in this study.
All Tables
Linear regression coefficients (slope and y-intercept) obtained using the least squares method, as well as Pearson and Spearman correlation coefficients and their p-values for both cluster and field star samples.
All Figures
|
Fig. 1. Relationships of the calibrated GSP-spec parameters for the ∼4000 member stars of open clusters with HQ = 1 and/or MQ = 1 quality flags. |
| In the text | |
|
Fig. 2. Relationships of ages and Galactocentric distances for the ∼1000 open clusters. The dashed red lines indicate the cut-off in age and RGC. |
| In the text | |
|
Fig. 3. Tinsley–Wallerstein diagram for the ∼200 000 MSTO field stars (grey symbols) and ∼170 open clusters (pink symbols). Both are potentially from the thin disc and have similar characteristics. The clusters with a green edge represent those in the solar region (∼40 open clusters). |
| In the text | |
|
Fig. 4. Approximately 900 000 MSTO field stars in the [α/Fe] versus [M/H] plane. The stars are colour coded according to their probability of belonging to the thin disc. |
| In the text | |
|
Fig. 5. Kiel diagram for the more than five million field stars of Gaia DR3. The location of the ∼900 000 MSTO stars is indicated with a red box. |
| In the text | |
|
Fig. 6. Relationships between the properties of the ∼70 000 selected field stars: number of stars, ages, and Galactocentric distances. The red dashed lines indicate the cut-off in age and RGC. |
| In the text | |
|
Fig. 7. Space velocities (VR, Vϕ and |VZ|) for ∼66 000 field stars from our selected sample and 41 open clusters in the solar region. The data are presented in equally distributed bins (q = 14) for field stars (lime). In the background, the field stars are also shown on a density plot that is coded according to the black to white colour bar. The size of the symbols for clusters (blue circles) are proportional to the square root of their number of members ( |
| In the text | |
|
Fig. 8. Orbital parameters (R, e and Zmax) for ∼66 000 field stars from our selected sample and ∼40 open clusters in the solar region. The data are presented in equally distributed bins (q = 14) for field stars (lime squares). In the background, the field stars are also shown on a density plot that is coded according to the black to white colour bar. The symbols and colours are the same as in Fig. 7. |
| In the text | |
|
Fig. 9. Orbital actions (JR, JZ and LZ) for ∼66 000 field stars from our selected sample and ∼40 open clusters in the solar region. The data are presented in equally distributed bins (q = 14) for field stars (lime). In the background, the field stars are also shown on a density plot that is coded according to the black to white colour bar. The symbols and colours are the same as in Fig. 7. |
| In the text | |
|
Fig. 10. Our selected sample of 41 open clusters on the thin disc and solar region sized by the total number of members, coloured by age, and labelled by cluster name and number of member stars considered in this study. |
| In the text | |
|
Fig. A.1. Kolmogorov-Smirnov (K-S) test comparing the cumulative distributions of age for the two samples. The age distribution of field stars is indicated with a black line and for clusters with a blue line. The vertical bars represent the values of the test statistic, which is the maximum absolute difference between the two cumulative distributions. |
| In the text | |
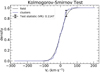 |
Fig. A.2. Kolmogorov-Smirnov test for Vr. Symbols and colours are the same as in Fig. A.1. |
| In the text | |
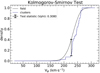 |
Fig. A.3. Kolmogorov-Smirnov test for Vϕ. Symbols and colours as in Fig. A.1. |
| In the text | |
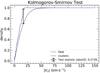 |
Fig. A.4. Kolmogorov-Smirnov test for |VZ|. Symbols and colours as in Fig. A.1. |
| In the text | |
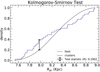 |
Fig. A.5. Kolmogorov-Smirnov test for R. Symbols and colours as in Fig. A.1. |
| In the text | |
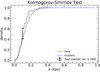 |
Fig. A.6. Kolmogorov-Smirnov test for e. Symbols and colours as in Fig. A.1. |
| In the text | |
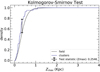 |
Fig. A.7. Kolmogorov-Smirnov test for Zmax. Symbols and colours as in Fig. A.1. |
| In the text | |
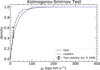 |
Fig. A.8. Kolmogorov-Smirnov test for JR. Symbols and colours as in Fig. A.1. |
| In the text | |
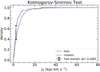 |
Fig. A.9. Kolmogorov-Smirnov test for JZ. Symbols and colours as in Fig. A.1. |
| In the text | |
|
Fig. A.10. Kolmogorov-Smirnov test for LZ. Symbols and colours as in Fig. A.1. |
| In the text | |
Current usage metrics show cumulative count of Article Views (full-text article views including HTML views, PDF and ePub downloads, according to the available data) and Abstracts Views on Vision4Press platform.
Data correspond to usage on the plateform after 2015. The current usage metrics is available 48-96 hours after online publication and is updated daily on week days.
Initial download of the metrics may take a while.