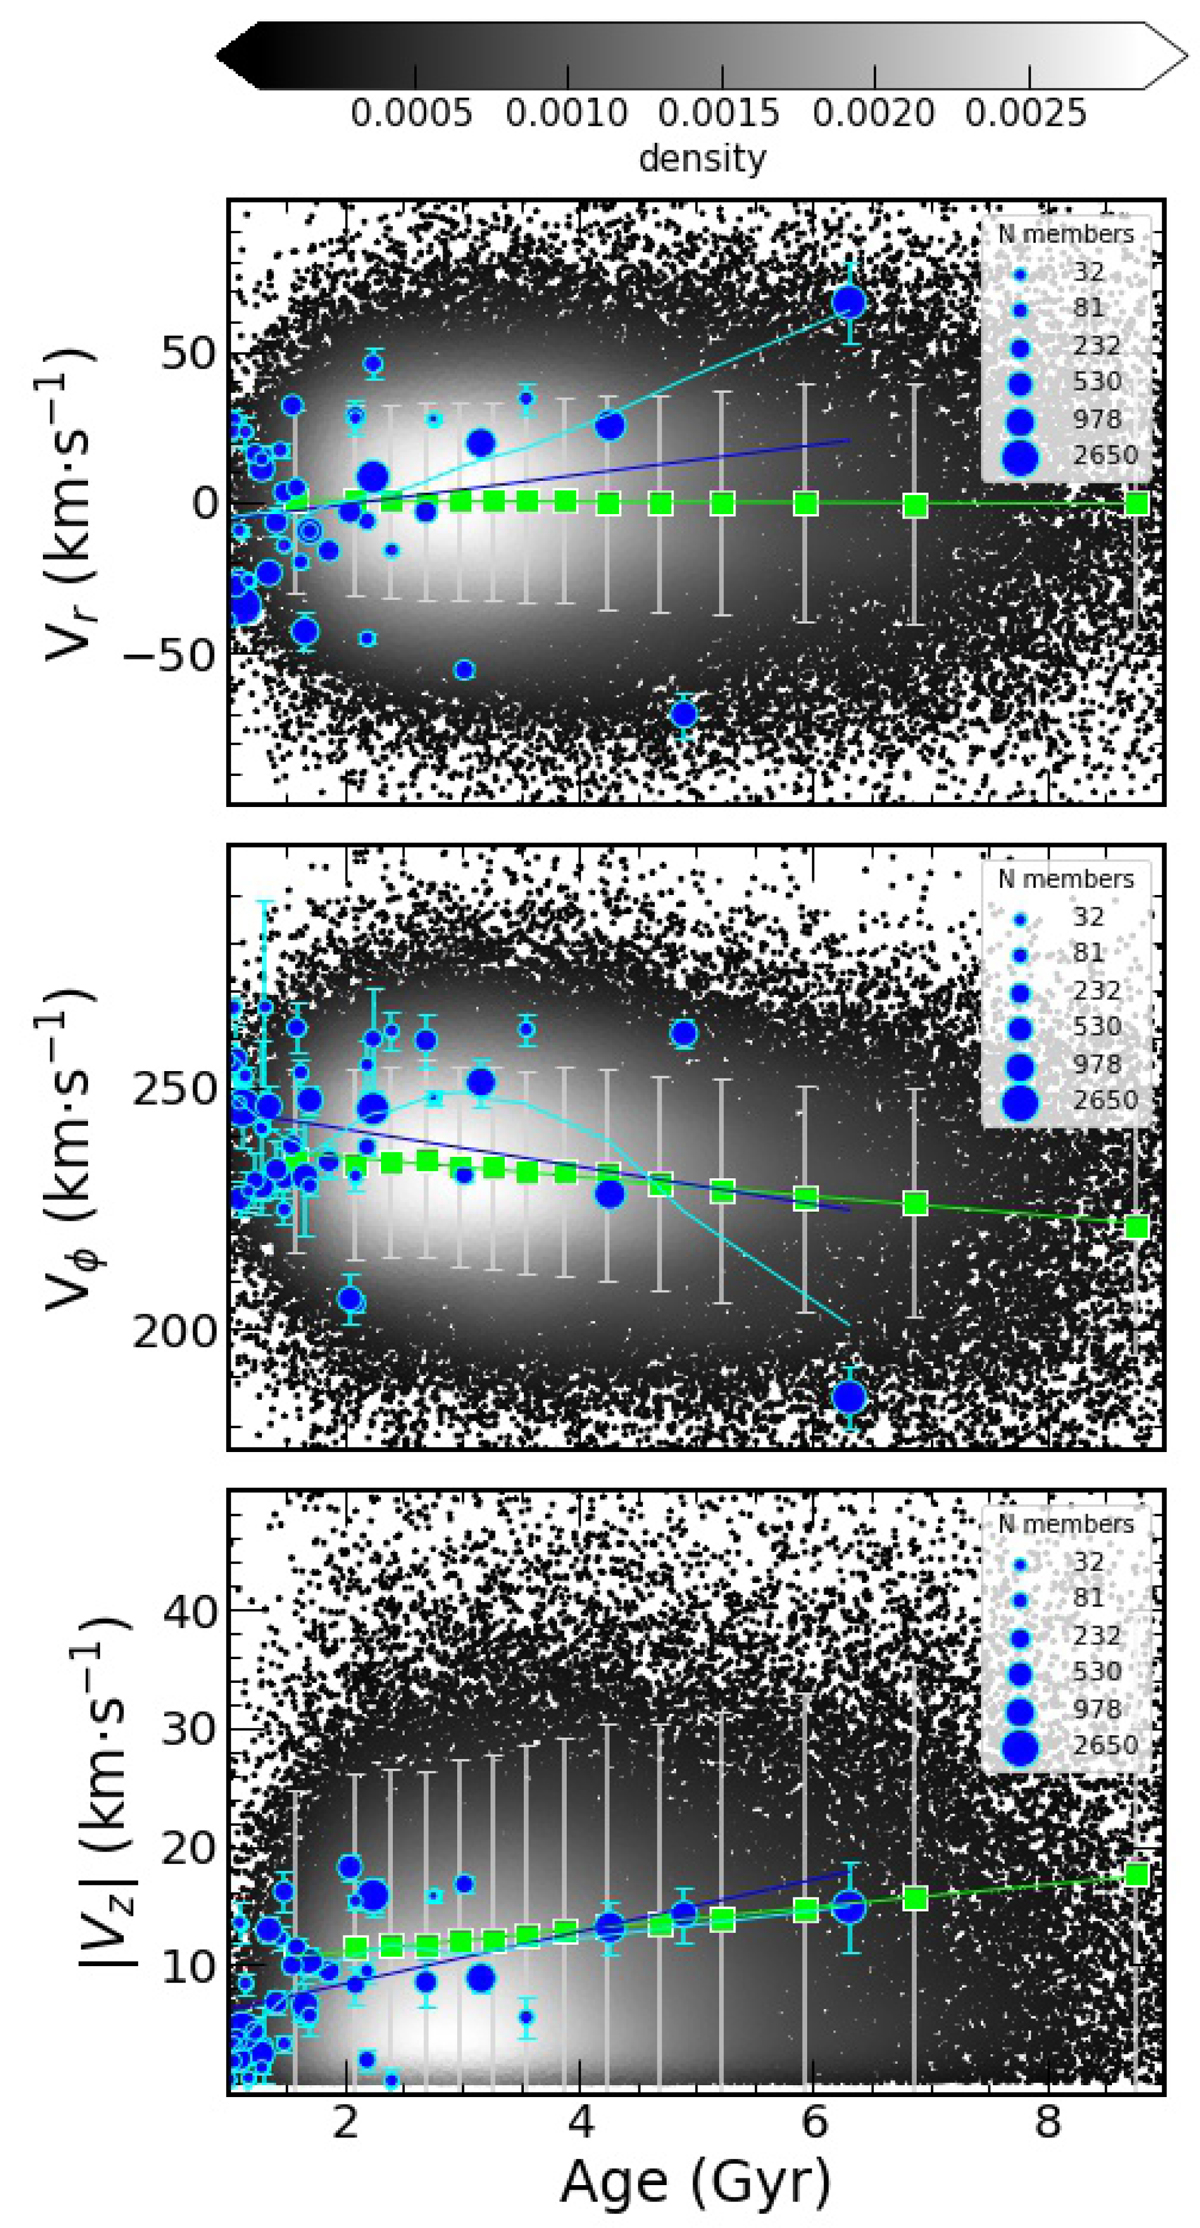
Fig. 7.
Download original image
Space velocities (VR, Vϕ and |VZ|) for ∼66 000 field stars from our selected sample and 41 open clusters in the solar region. The data are presented in equally distributed bins (q = 14) for field stars (lime). In the background, the field stars are also shown on a density plot that is coded according to the black to white colour bar. The size of the symbols for clusters (blue circles) are proportional to the square root of their number of members (![]() ), shown in the legend with their total number of members. The straight lines represent the linear fits (green for field stars and blue for open clusters), and the curve (cyan) is a nonparametric LOWESS model to the clusters’ data.
), shown in the legend with their total number of members. The straight lines represent the linear fits (green for field stars and blue for open clusters), and the curve (cyan) is a nonparametric LOWESS model to the clusters’ data.
Current usage metrics show cumulative count of Article Views (full-text article views including HTML views, PDF and ePub downloads, according to the available data) and Abstracts Views on Vision4Press platform.
Data correspond to usage on the plateform after 2015. The current usage metrics is available 48-96 hours after online publication and is updated daily on week days.
Initial download of the metrics may take a while.