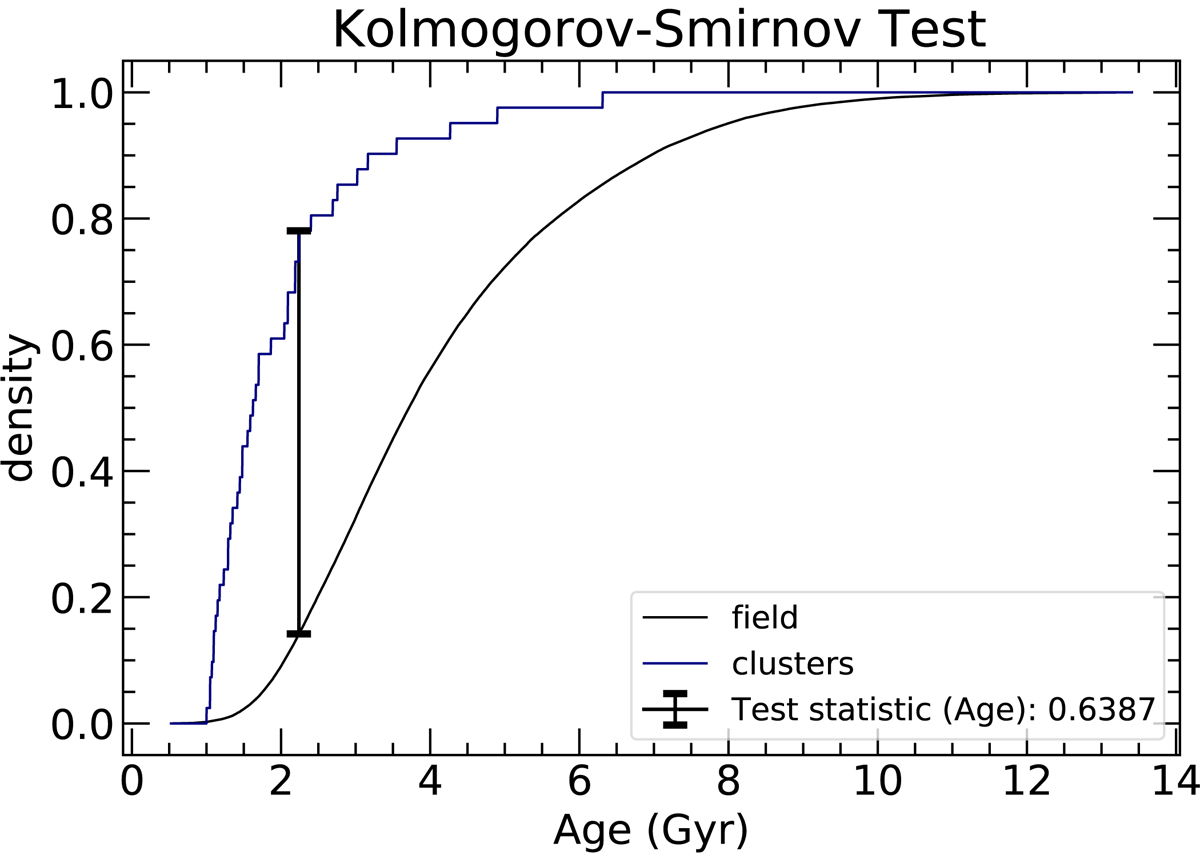
Fig. A.1.
Download original image
Kolmogorov-Smirnov (K-S) test comparing the cumulative distributions of age for the two samples. The age distribution of field stars is indicated with a black line and for clusters with a blue line. The vertical bars represent the values of the test statistic, which is the maximum absolute difference between the two cumulative distributions.
Current usage metrics show cumulative count of Article Views (full-text article views including HTML views, PDF and ePub downloads, according to the available data) and Abstracts Views on Vision4Press platform.
Data correspond to usage on the plateform after 2015. The current usage metrics is available 48-96 hours after online publication and is updated daily on week days.
Initial download of the metrics may take a while.