| Issue |
A&A
Volume 671, March 2023
|
|
|---|---|---|
| Article Number | A83 | |
| Number of page(s) | 13 | |
| Section | Cosmology (including clusters of galaxies) | |
| DOI | https://doi.org/10.1051/0004-6361/202244652 | |
| Published online | 09 March 2023 | |
A newly identified galaxy group thanks to tidal streams of intragroup light⋆
1
Dipartimento di Fisica dell’Università degli Studi di Trieste – Sezione di Astronomia, Via Tiepolo 11, 34143 Trieste, Italy
2
INAF – Osservatorio Astronomico di Trieste, Via Tiepolo 11, 34143 Trieste, Italy
e-mail: marisa.girardi@inaf.it
3
Dipartimento di Fisica e Astronomia “G. Galilei”, Università di Padova, Vicolo dell’Osservatorio 3, 35122 Padova, Italy
4
INAF – Osservatorio Astronomico di Padova, Vicolo dell’Osservatorio 2, 35122 Padova, Italy
5
Fundación Galileo Galilei – INAF (Telescopio Nazionale Galileo), Rambla José Ana Fernández Perez 7, 38712 Breña Baja (La Palma), Canary Islands, Spain
6
Instituto de Astrofísica de Canarias, C/Vía Láctea s/n, 38205 La Laguna (Tenerife), Canary Islands, Spain
7
Departamento de Astrofísica, Univ. de La Laguna, Av. del Astrofísico Francisco Sánchez s/n, 38205 La Laguna, Tenerife, Spain
8
INAF – Istituto di Astrofisica Spaziale e Fisica Cosmica di Milano, Via A. Corti 12, I-20133 Milano, Italy
9
Dipartimento di Fisica E.R. Caianiello, Università Degli Studi di Salerno, Via Giovanni Paolo II, 84084 Fisciano, SA, Italy
10
INAF – Osservatorio Astronomico di Capodimonte, Via Moiariello 16, 80131 Napoli, Italy
11
Dipartimento di Fisica e Scienze della Terra, Università di Ferrara, Via Saragat 1, 44122 Ferrara, Italy
Received:
1
August
2022
Accepted:
24
January
2023
Context. In the accretion-driven growth scenario, part of the intracluster light is formed in the group environment.
Aims. We report the serendipitous discovery of a group of galaxies with signs of diffuse light in the foreground of the known galaxy cluster MACS J0329−0211 at z ∼ 0.45.
Methods. Our investigation began with the detection of diffuse light streams around a pair of bright galaxies in the southeastern region of a Suprime-Cam image of the galaxy cluster MACS J0329-0211. Our analysis is based on the extended CLASH-VLT redshift catalog and on new spectroscopic data obtained ad hoc with the Italian Telescopio Nazionale Galileo. We use the density reconstruction method to analyze the redshift distribution of the galaxies in the region around the galaxy pair. We also use available photometric and X-ray data to better characterize the properties of the group.
Results. Thanks to the large amount of redshift data collected in this region, we have been able to discover the existence of a group of galaxies, here called GrG J0330−0218, which is associated with the pair of galaxies. These are the two brightest group galaxies (BGG1 and BGG2). We extracted 41 group members from the redshift catalog and estimate a mean redshift z = 0.1537 and a line-of-sight velocity dispersion σv ∼ 370 km s−1. In the phase-space diagram, the distribution of the galaxies of GrG J0330-0218 follows the characteristic trumpet-shaped pattern, which is related to the escape velocity of galaxy clusters, suggesting that the group is a virialized structure. Under this assumption, the mass of the group is M200 ∼ 6 × 10¹³ M⊙. We also measured a mass-to-light ratio of ∼130 M⊙/L⊙ and a luminosity fraction of diffuse light of ∼20% within 0.5 R200.
Conclusions. We conjecture that galaxy pairs that are surrounded by diffuse light, probably due to tidal interactions, can serve as signposts for groups.
Key words: galaxies: groups: individual: GrG J0330−0218 / galaxies: groups: general / galaxies: clusters: general / galaxies: clusters: individual: MACS J0329−0211 / galaxies: kinematics and dynamics
Full Table 1 is only available at the CDS via anonymous ftp to cdsarc.cds.unistra.fr (130.79.128.5) or via https://cdsarc.cds.unistra.fr/viz-bin/cat/J/A+A/671/A83
© The Authors 2023
 Open Access article, published by EDP Sciences, under the terms of the Creative Commons Attribution License (https://creativecommons.org/licenses/by/4.0), which permits unrestricted use, distribution, and reproduction in any medium, provided the original work is properly cited.
This article is published in open access under the Subscribe to Open model. Subscribe to A&A to support open access publication.
1. Introduction
Galaxy clusters evolve and increase in mass through a hierarchical merging process from poor groups to rich clusters. As shown by numerical simulations, accretion of smaller systems at the galaxy or group scale is the main channel of cluster growth (e.g., Benavides et al. 2020 and references therein). In this scenario, some of the intracluster diffuse light could originate from the group environment.
Diffuse light is the light from stars that float freely in the gravitational potential of galaxy systems and that are not bound to a galaxy. For simplicity, we use the term ICL when referring to both intragroup and intracluster light. Diffuse light in galaxy systems was first discovered by Zwicky (1951) in the Coma cluster and studied in the following years. We refer to Contini (2021) and Montes (2022) as two very recent reviews on this topic. Most of the ICL in clusters is concentrated around the brightest cluster galaxy (BCG) where it is considered to be an extended component over the Sérsic light profile of the BCG itself.
To detect ICL there are three methods used in the literature. The most commonly used method for calculating the ICL is that based on a surface brightness cut (e.g., Feldmeier et al. 2004; Burke et al. 2012; Furnell et al. 2021). It assumes that all light below a certain surface brightness can be fully attributed to the ICL. The disadvantage of this method is that images with different exposure times for the same galaxy cluster give different amounts of the ICL (e.g., Montes & Trujillo 2018). Moreover, it does not account for the ICL that overlaps with the BCG in the transition region. As an alternative method, BCG and ICL light can be described by adding separate models for the two components. This method based on the surface brightness profile fit can be heavily degenerate (e.g., Janowiecki et al. 2010). Moreover, as pointed out by Montes & Trujillo (2018), it also fails to account for ICL not concentrated around the BCG, asymmetries in the light distribution, and substructures such as tidal streams. The third approach is based on 2D techniques, such as fitting algorithms to take into account most of the galaxies in the cluster (e.g., Giallongo et al. 2014; Presotto et al. 2014; Cattapan et al. 2019) or wavelet-like decomposition techniques (e.g., Ellien et al. 2021).
Indeed, it is not easy to understand whether the observed diffuse light is bound to the BCG or to the cluster (true ICL), if one uses only imaging (e.g., Kluge et al. 2021; Montes et al. 2021). As numerical simulations suggest (e.g., Dolag et al. 2010), the population of ICL stars should have a higher velocity dispersion than BCG stars and be more similar to that of the host cluster. This can be observed in a few cases where detailed spectroscopic studies can be performed, such as when studying the kinematics of planetary nebulae or globular clusters around nearby BCGs (e.g., Arnaboldi et al. 1996; Longobardi et al. 2018; Alamo-Martínez et al. 2021). However, these tracers can only be used for very low redshift objects (z ≪ 0.1). To our knowledge, there is only one cluster in which ICL occurs at the cluster center without the presence of a BCG, namely Abell 545 (Struble 1988; Barrena et al. 2011 and references therein). This case is clear evidence that diffuse light is bound to the gravitational potential of the cluster.
Among the mechanisms for ICL formation in galaxy clusters, the most important are mass loss during galaxy mergers, tidal disruption of dwarf galaxies, tidal stripping of intermediate and massive galaxies, and accretion of ICL from groups also called preprocessing (see e.g., Contini 2021). Numerical simulations suggest that half of the ICL comes from galaxies associated with the family merger tree of BCGs in clusters (e.g., Murante et al. 2007) and that stellar stripping by an established cluster potential is stronger in the innermost region of the haloes and in clusters than in groups (Contini et al. 2018). On the other hand the mechanisms related to galaxy mergers and galaxy-galaxy encounters are favored in the group environment where the encounter velocity is low and comparable to the internal velocity of stars in galaxies. In fact, numerical simulations show as slow interactions between galaxies in the group environment lead to strong tidal stripping and the formation of tidal tails and streams that decay with time and evolve into a more diffuse and amorphous ICL envelope in the cluster environment (Rudick et al. 2006, 2009).
According to Rudick et al. (2009), 40% of the cluster ICL is generated in streams and Contini et al. (2014) calculated that preprocessing can contribute up to 30% of the total ICL in massive clusters. The complex substructure of diffuse light in the Virgo cluster also suggests that ICL is related to the hierarchical nature of cluster assembly and is not the product of uniform accretion around a central galaxy (Mihos et al. 2005). The analysis of James Webb Space Telescope (JWST) data allows the detection of a lot of substructures in the ICL of distant clusters suggesting that one can observe the formation of the diffuse extended component in clusters (Montes & Trujillo 2022). Despite the presumed importance of the preprocessing mechanism for ICL formation in clusters, there is little evidence for ICL in groups. Mihos et al. (2016) describes several cases of loose groups that show little evidence for ICL despite refined studies. ICL detection has been reported in a few cases (e.g., Castro-Rodríguez et al. 2003; Spavone et al. 2018; Cattapan et al. 2019; Raj et al. 2020). On the other hand, ICL detection is quite common in compact groups such as Stephan’s quintet (Mendes de Oliveira et al. 2001), Seyfert’s sextet (Durbala et al. 2008), and several other cases (e.g., Da Rocha & Mendes de Oliveira 2005; Cortese et al. 2006; Da Rocha et al. 2008; Poliakov et al. 2021; Ragusa et al. 2021), though not in all compact groups (e.g., Aguerri et al. 2006).
While inspecting an image taken with the Subaru Prime Focus Camera (Suprime-Cam) and centered on the galaxy cluster MACS J0329−0211 at z ∼ 0.45 (hereafter MACS0329), we detected two bright galaxies in the southeastern region, likely in the foreground of MACS0329 and surrounded by strong diffuse light. In addition to the large amount of spectroscopic data in the region of MACS0329 obtained in the CLASH-VLT project, we performed new optical observations to obtain new spectroscopic data with the Italian Telescopio Nazionale Galileo (TNG) in the region around the two galaxies. Here we report the discovery of a group of galaxies, hereafter called GrG J0330−0218, associated with this pair of bright galaxies.
The paper is structured as follows. We describe the new observations and all optical data in Sect. 2. We present the selection of group members and the redshift catalog in Sect. 3. In Sects. 4 and 5 we present our results on the group structure, the two dominant galaxies, and the ICL. We give a brief overview of the study of the large-scale environment of GrG J0330−0218 in Sect. 6. Section 7 is devoted to the interpretation and discussion of our results. In Sect. 8, we give a brief summary and derive our conclusions. In this work we use H0 = 70 km s−1 Mpc in a flat cosmology with Ω0 = 0.3 and ΩΛ = 0.7. In the assumed cosmology, 1′ corresponds to ∼160 kpc at the group redshift. Recall that the velocities we derive for the galaxies are line-of-sight velocities determined from the redshift, V = cz. Unless otherwise stated, we report errors with a confidence level (c.l.) of 68%.
2. Observations and data
Figure 1 shows the southeastern region of the Suprime-Cam image centered on MACS0329 where we detected two bright galaxies surrounded by diffuse light. These two galaxies are listed by NED1 as the galaxy pair APMUKS(BJ) B032735.21−02283 (Maddox et al. 1990). Since these two galaxies will prove to be the two brightest galaxies of a group in the foreground of MACS0329, we refer to them as BGGs (BGG1 to the north and BGG2 to the south).
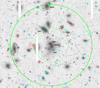 |
Fig. 1. Southeastern region of the Suprime-Cam RC-band image of the cluster MACS0329 (north top and east left) showing the group region within 0.5 R200 ∼ 2.4′ (enclosed in the large, thick green circle). The thin green circle indicates the 1′ radius region (1′∼160 kpc at the group redshift). Galaxies with available redshift are highlighted with small circles, in particular red or cyan circles in the case of members or nonmembers according to the selection procedure (see Sects. 2 and 3). Labels indicate objects discussed in the text. |
2.1. New spectroscopic TNG data
Long-slit spectroscopic observations of galaxies in the field of GrG J0330−0218 were performed in November and December 2015 and in January 2016 at the TNG. As instrument, we used the Device Optimized for LOw REsolution Spectroscopy (DOLoRes) with the LR-B grism. With LR-B Grm1 all the relevant spectral features can be observed at the group redshift, while the resolution is enough for the measurement of accurate galaxy redshifts. In total, we acquired spectra for 18 galaxies with exposure times between 900 s and 1800 s. These observations focused on the two galaxies BGG1 and BGG2 and on bright galaxies in their vicinity. The spectra of the two BGGs are shown in Fig. 2.
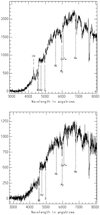 |
Fig. 2. TNG spectra of BGG1 and BGG2 in the upper and lower panels, respectively. ADU in y-axis. |
Spectral reduction and radial velocity estimation were performed using the standard IRAF2 tasks and the cross-correlation technique (Tonry & Davis 1979). In our experience with DOLoRes in spectroscopic mode, the nominal velocity errors provided by the cross-correlation technique must be multiplied by a factor of 2–2.5 (e.g., Girardi et al. 2022). In this case, comparison of multiple velocity measurements for four galaxies suggests that we should be more conservative and allow for errors equal to the nominal errors multiplied by a factor of 3. In total, we obtained velocity estimates for 18 galaxies. The median value of the uncertainties in the velocity measurements is 112 km s−1.
2.2. CLASH-VLT spectroscopic data
The galaxy cluster MACS0329 is part of the “Cluster Lensing And Supernova survey with Hubble” project (CLASH, Postman et al. 2012) and was surveyed with VIMOS as part of ESO Large Program 186.A-0798 “Dark Matter Mass Distributions of Hubble Treasury Clusters and the Foundations of LCDM Structure Formation Models” (PI: P. Rosati). This program is the panoramic spectroscopic survey of the 13 CLASH clusters visible from ESO-Paranal, named CLASH-VLT (Rosati et al. 2014, and in prep.). VIMOS was used with both the low-resolution blue grism (LRb) and the medium-resolution grism (MR) with typical cz errors of 150 and 75 km s−1, respectively (Balestra et al. 2016). Each redshift was also assigned a quality flag. Exact details of the CLASH-VLT data reduction can be found in the study by Mercurio et al. (2021). The wide-field VLT-VIMOS spectroscopy was complemented by VLT-MUSE spectroscopy with integral field in the central cluster regions (Caminha et al. 2019) with typical cz errors of 40 km s−1 (Inami et al. 2017).
For the MACS0329 field, we consider the 1712 galaxies of the CLASH-VLT catalog with redshift between 0 and 1. Of these, 1637 galaxies are from VIMOS, 74 from MUSE, and one additional bright galaxy is from a TNG long-slit observation. In particular, we only considered VIMOS redshifts with a quality flag QF ≥ 2, that is, redshifts with a reliability ≳80%.
2.3. Photometric data
We used photometric information from Suprime-Cam data for the MACS0329 field. Data were retrieved from CLASH page3, available at the Mikulski Archive for Space Telescopes (MAST). A full description of the reduction of the Suprime-Cam images can be found in the data section of the CLASH website4. Briefly, the images were reduced by one of us using the techniques described in Nonino et al. (2009) and Medezinski et al. (2013). The total area covered by the images is 34 × 27 arcmin2. Zeropoints are in the AB system. In particular, we retrieved the image in the RC band with an exposure of 2400 s and a depth of 26.48 mag. The corresponding photometric catalog can be found on the website CLASH catalogs5.
We also used data from the Panoramic Survey Telescope and Rapid Response System (Pan-STARRS, Flewelling et al. 2020). In particular, we extracted r, g, and i band magnitudes from the PS1-DR2 data release6.
3. Selection of group members and catalog
Based on the measured spectra, the two BGGs are very close in velocity space at z ∼ 0.153. The redshift distribution of the 1712 galaxies in the CLASH-VLT redshift catalog was analyzed using the 1D adaptive-kernel method of Pisani (1993, hereafter 1D-DEDICA). This distribution reveals a peak of galaxies at z ∼ 0.45 corresponding to MACS0329, as well as several other foreground and background structures (Girardi et al., in prep.). Among these structures, the 1D-DEDICA method detects a foreground peak at z = 0.153. It consists of 59 galaxies, 32 of which are located in the southeastern region of MACS0329. We added these 59 galaxies from CLASH-VLT to the 18 galaxies from TNG. Our initial combined redshift catalog thus consists of 77 galaxies. Most of the TNG galaxies are brighter than RC = 20 mag, while the data from CLASH-VLT include galaxies down to RC ∼ 24 mag.
To select group members among the 77 galaxies in our combined redshift catalog, we used the two-step method known as Peak+Gap (P+G, Girardi et al. 2015). The first step is to apply the 1D-DEDICA method with adaptive-kernel. With this, we detect a peak at z ∼ 0.1536 with 41 galaxies in the range 45 269 ≤ V ≤ 46 858 km s−1 (see Figs. 3 and 4). The nonmembers are 28 foreground and 8 background galaxies. In particular, there is a foreground peak at z ∼ 0.1435, that is, at more than 2600 km s−1 in the foreground (cf. Sect. 6).
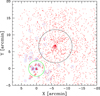 |
Fig. 3. Spatial distribution of all galaxies with redshift in the MACS0329 field. The large black circle indicates the R200 radius of the cluster. Red triangles and dots show galaxies with TNG and CLASH-VLT redshifts, 18 and 1712, respectively. The symbols outlined with blue circles indicate the 41 group member galaxies. The point 0,0 in the diagram indicates the center of GrG J0330−0218 and the green circle indicates the 0.5 R200 radius of the group (see also Fig. 1). |
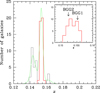 |
Fig. 4. Distribution of galaxies in our combined redshift catalog of 77 galaxies in the range z = 0.12–0.22. The histogram with the thick red line refers to the 41 galaxies that belong to the density peak of GrG J0330−0218, which was identified with the 1D-DEDICA reconstruction method (faint green line). The inset shows the 41 member galaxies with the redshifts of BGG1 and BGG2 indicated. |
In a second step, we combine the space and velocity information in the “shifting gapper” procedure (Fadda et al. 1996; Girardi et al. 1996). Of the galaxies that lie within an annulus around the center of the system, this procedure excludes those that are too far away in velocity from the main body of galaxies (i.e., are farther away than a fixed velocity distance called the velocity gap). The position of the annulus is shifted with increasing distance from the center of the cluster. The procedure is repeated until the number of cluster members converges to a stable value. Fadda et al. (1996) suggested a velocity gap of 1000 km s−1 in the cluster rest-frame and an annulus size of 0.6 Mpc or more to include at least 15 galaxies. Since the two BGGs have comparable luminosities, we determine the center of the group by averaging their positions in right ascension (RA) and declination (Dec) [RA = 03h30m06s.73, Dec = −02° 18′24″.8 (J2000.0)].
Following the procedure described above, the 41 group members are confirmed. Since a group is expected to have a small velocity dispersion, we also used the above procedure with a smaller velocity gap down to 500 km s−1, always confirming the 41 group members. The position of the galaxies in the project phase-space is shown in Fig. 5. To highlight the region of the cluster members, we also plot the escape velocity curves, which were obtained using the recipe of den Hartog & Katgert (1996). We used the mass estimate calculated in the following section and assumed a Navarro–Frenk–White mass density profile (NFW, Navarro et al. 1997). Table 1, available in full at CDS, lists the velocity catalog for the member galaxies.
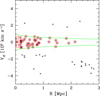 |
Fig. 5. Rest-frame velocity Vrf = (V − ⟨V⟩)/(1 + z) vs. projected group-centric distance R for galaxies with redshifts in the range ±5000 km s−1 (black crosses). The red circles show the 41 members of GrG J0330−0218. The large red squares refer to BGG1 and BGG2. The green curves contain the region where |Vrf| is smaller than the escape velocity (see text). |
Radial velocities of 41 member galaxies of GrG J0330−0218
4. Group structure and properties
4.1. Global properties and galaxy population from optical data
Analysis of the velocity distribution of the 41 group members was performed using the biweight estimators for location and scale included in ROSTAT (statistical routines of Beers et al. 1990). Our measurement of the mean redshift of the group is ⟨z⟩ = 0.1537 ± 0.0001 (i.e., ⟨V⟩ = 46 067 ± 41 km s−1). We estimate the velocity dispersion, σV, by applying the cosmological correction and the standard correction for velocity errors (Danese et al. 1980). We obtain  , where the errors are estimated using a bootstrap technique.
We derive the mass M200 within R2007 using the theoretical relation between M200 and the velocity dispersion verified in simulated clusters (Eq. (1) of Munari et al. 2013). To obtain a first estimate of the radius R200 and the group mass M200 contained therein, we applied the relation of Munari et al. (2013) to the global value of σV which we obtained above. We considered the galaxies within this first estimate of R200 to calculate a new value for the velocity dispersion. The procedure is repeated until we obtain a stable result that estimates  for 28 galaxies within
  . We derive
  . The uncertainties for R200 and M200 are calculated using the error propagation of σV, 200 (R200 ∝ σV, 200 and
  ) and an additional uncertainty of 10% for the mass due to the scatter in the relation of Munari et al. (2013). The properties of the group are shown in Table 2.
Global properties of GrG J0330−0218.
Using a number of indicators such as kurtosis, skewness, tail index, and asymmetry index (Bird & Beers 1993), the analysis of the velocity distribution shows no evidence of possible deviations from the Gaussian distribution. We find no evidence of substructure in the 3D distribution (velocity+positions) using the classical Δ-test of Dressler & Shectman (1988) or slightly modified versions (Girardi et al. 2010).
BGG1 has a higher velocity than the mean cluster velocity, as shown in Fig. 4 (inset). According to the Indicator test (Gebhardt & Beers 1991), the velocity of BGG1 is peculiar at the > 99% c.l.. However, if we consider the two dominant galaxies BGG1 and BGG2 together, that is, their average velocity and not only the velocity of BGG1, we do not find any peculiarity.
We have also analyzed the position of the group galaxies in the color-magnitude diagrams. We can assign Pann-STARRS magnitudes to all member galaxies, except for two very faint galaxies with RC > 23 mag. Figure 6 shows the distribution of member galaxies in the color-magnitude diagrams r − i vs. r and g − r vs. r. In Fig. 6 the magnitudes are corrected for Galactic foreground extinction (Schlafly & Finkbeiner 2011). The color-magnitude relations can be seen down to faint magnitudes r ∼ 20 mag. We use the galaxies with r < 20 and the 2σ rejection procedure of Boschin et al. (2012) to fit r − i = 1.115 − 0.039 × r and g − r = 1.308 − 0.032 × r.
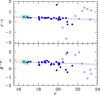 |
Fig. 6. Pan-STARRS aperture-color vs. Kron-like magnitude diagrams r − i vs. r and g − r vs. r in lower and upper panels, respectively. All member galaxies are shown with the exception of two very faint galaxies for which PS1 magnitudes are not available. The full circles indicate data obtained from PS1 mean data and open circles those available only as stacked data. The large green squares indicate BGG1 and BGG2. The blue dashed lines show the color-magnitude relations obtained for the member galaxies. The red dotted lines show the relations taken from the literature (see Sect. 7). |
Then we calculated the total luminosity of the galaxies Lgals within 0.5 R200. There, the redshift completeness is about ∼75% at the magnitude limit of 19.68 = rBGG1 + 3. Of the 21 Pan-STARRS galaxies brighter than the magnitude limit, we have the redshift for 16 galaxies: nine and seven galaxies are members and nonmembers, respectively. Of the five galaxies with no spectroscopic redshift, the giant spiral galaxy with a diameter  at the eastern 0.5 R200 limit is likely a foreground galaxy (labeled with “Spi” in Fig. 1). We classify it as a nonmember galaxy. This assumption is also confirmed by our estimate of the photometric redshift zphot = 0.11 ± 0.02 obtained with the algorithm of Tarrío & Zarattini (2020). We thus define two samples of galaxies: one consisting of the nine spectroscopic members and one consisting of the nine members plus the four galaxies without redshift. We corrected magnitudes for extinction, the K-correction, and the evolution correction (Eq. (2) in Girardi et al. 2014), and summed the luminosities of all galaxies to obtain a range of values for the global galaxy luminosity within the magnitude limit, Lobs. The contribution from the fainter galaxies is estimated using the Schechter luminosity function according to the procedure in Girardi et al. (2014). We obtain Lgals = Lobs + Lfaint = 4.0 × 10¹¹ L⊙ and 4.6 × 10¹¹ L⊙ for the two samples of 9 and 13 galaxies, respectively. A 17% of luminosity is due to the magnitude corrections and a 19–25% is due to the extrapolation to faint galaxies. We used the NFW profile to calculate the projected mass within 0.5 R200 and obtained a mass-to-light ratio M/L ∼ 130 M⊙/L⊙.
4.2. Analysis of X-ray data
GrG J0330−0218 was serendipitously observed by Chandra with the Advanced CCD Imaging Spectrometer (ACIS, Garmire et al. 2003) within the field of view of four observations of MACS J0329.6−0211 (Observations ID: 7719, 3257, 3582, 6108). The data set was reprocessed and cleaned following the steps described in Bartalucci et al. (2017), see their Appendix A). We briefly report the procedures here. Data were processed using Chandra Interactive Analysis of Observations (CIAO, Fruscione et al. 2006) version 4.13 using the latest calibration files updated to version 4.9.6. High-energy particle contamination was reduced by using the Very Faint mode8. Observational periods affected by flares were removed following the procedures of Hickox & Markevitch (2006) and Markevitch et al. (2006). The four observations were merged after the cleaning procedure to maximize the statistics. The resulting total cleaned exposure time is 55 ks. The exposure-corrected image in the 0.5–2.5 keV band was obtained by combining the four observations.
GrG J0330−0218 is in the outermost part of the field of view. The distance to the aim-point is on average 10′, and for this reason any diffuse emission of the group is expected to be weak. At the position of GrG J0330−0218, the only emission visible on the image is point-source like and centered on BGG1. We investigated the nature of this emission by comparing the surface brightness profile extracted from the group with that of a point source at the same distance from the aim-point. The profile of the group was extracted from concentric annuli centered on the BGG1 position, thus considering both BGG1 and possible intragroup medium. We computed the background-subtracted and exposure-corrected average surface brightness profiles in each annulus. The technique of extraction is detailed in Bartalucci et al. (2017). The direct comparison of the background-subtracted and exposure-corrected surface brightness profiles is shown in Fig. 7. We scaled the surface brightness profiles intensity by their maximum value and we applied an offset of to the radial grids so that the first bins of the profiles coincide. The group emission is systematically above the point source at  , ∼12″, and the point source profile decreases rapidly. The 90% average encircled energy fraction at 1.49 keV is within ∼10 arcsec9, which is consistent with the point source profile. The group emission extends to 1′, indicating the presence of a faint extended emission. In addition, the surface brightness profiles are binned to have at least 3σ in each bin. That is, we have found that the surface brightness profile extracted from the group is consistent with extended emission. The extended emission is centered exactly on the galaxy BGG1. We cannot tell whether the observed extended emission is originated from the diffuse hot gas embedded in the halo of the group or rather from BGG1 itself. A dedicate observation is needed to separate the two components and determine the key thermodynamic quantities.
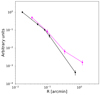 |
Fig. 7. Surface brightness profiles of the two X-ray sources. The group and point sources are shown by magenta and black lines. Both profiles are extracted in the 0.7–2.5 keV band. |
5. Bright group galaxies and diffuse light
Inspection of the Suprime-Cam RC image reveals a clear signature of diffuse light around the two central galaxies (see Fig. 1). In particular, one can see a distinct tail in the southeastern part of BGG2. In Sect. 5.1, we first focus on the photometric decomposition of the surface brightness profiles of the two BGGs to understand the morphological type of these galaxies. Then, in Sect. 5.2 the ICL is calculated using the surface brightness cut technique (hereafter SB cut).
5.1. Photometric decomposition of the two dominant galaxies
The photometric decompositions were performed using the GASP2D code (Méndez-Abreu et al. 2008, 2014, 2017). The method is able to fit several components to the surface brightness profile of the galaxy. In particular, the latest version of GASP2D is able to account for a bulge, a disk with no or negative or positive bending, up to two bars, and a nuclear source to mimic the AGN in the central region. Details of the method and its configuration can also be found in de Lorenzo-Cáceres et al. (2020). The PSF is taken into account in the decomposition. In particular, we measure the FWHM of a set of nonsaturated stars in the image (identified using SDSS data) with a Moffat function. The resulting mean PSF is used in GASP2D as a kernel to be convoluted with the model of each galaxy, thus the final model is seeing-corrected (Méndez-Abreu et al. 2017). The sky level was evaluated using the IRAF task imexam: we measured 10 different (empty) regions of the sky, getting for each region the mean value over an area of 25 pixels. We then computed the average value of the sky from these 10 measurements. In Figs. 8 and 9 we show the results of the photometric decomposition of BGG1 and BGG2, respectively.
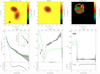 |
Fig. 8. Photometric decomposition of BGG1. The image of the region, the model of the galaxy, and the residuals of the subtraction of the model from the image are shown in the upper panels (left, middle, and right panels). In the bottom-left panel, the ellipse-averaged surface brightness radial profile of the galaxy (black dots) and best-fit model (green solid line) are shown. Moreover, the light contributions of the bulge (dashed blue line) and disc (dotted red line) is also presented. The inset shows a zoom to the central regions of the data and the fit using a logarithmic scale for the radial distances. In the bottom-central plot the ellipticity profile and fit are shown, whereas in the bottom-right panel we present the PA profile and fit. The color code of these two last plots is the same as for the bottom-left one. |
The most interesting result of the decomposition is that BGG1 clearly has a disk component. Disks are fragile structures, but they are not uncommon in groups where low relative velocity encounters occur. Confirmation of the presence of a disk is found in the spectrum of this BGG1, which is shown in Fig. 2. The [OII] emission line is clearly visible, suggesting that some star formation is underway. In addition, some spiral arms are visible in the northeastern side of BGG1, again confirming the presence of a disk in this galaxy. We note that a good fit can also be obtained by adding a bar in the central region, but the data are not sufficient to assess whether the presence of the bar really improves the fit (e.g., the bar is real) or if it is an unnecessary component. Therefore, to be conservative, we opted for the simpler decomposition with only two components (bulge and disk). However, it is known that tidal interactions between two galaxies can trigger the formation of a bar, especially if both galaxies are massive (Noguchi 1987). For this reason, the possible presence of a bar should not be considered surprising. It is also interesting to note that there is a clear tilt between the position angle (PA) of the bulge and that of the disk. The bulge is moderately elliptical and perpendicular to the disk component (PA = 170 deg for the bulge, PA = 80 deg for the disk), another indication that the presence of a bar cannot be completely ruled out.
On the other hand, BGG2 appears to be a simple early-type galaxy. The surface brightness profile can be fitted using a single Sérsic component with n = 4.
5.2. ICL computation
To estimate the amount of ICL in GrG J0330−0218 we used the SB cut method. We started with the original image in galaxy counts, corrected for bias and flat field, and sky subtracted. Then, we ran Sextractor (Bertin & Arnouts 1996) over the image to find all objects in the image (stars and galaxies). The value of each pixel was converted to magnitudes using the calibration constant, which was determined by comparing the unsaturated stars in the Suprime-Cam image with the same stars from Pan-STARRS (the stars were selected using the parameter CLASS_STAR). With the calibration constant in hand, we can assign a magnitude to each pixel in our image, and knowing that the pixel size is 0.2 arcsec, it is easy to determine the area of the pixel. With this information, we were able to select all pixels that were above a certain SB cut.
Both observations and simulations have shown that this method is effective for an ICL surface brightness μV > 26.5 mag arcsec−2 (Feldmeier et al. 2004; Rudick et al. 2011; Cui et al. 2014). However, other values are found in the literature. For instance, the accurate study of the light profile for NGC 1533 in the Dorado group shows that the stellar envelope can be detected at about one mag brighter (μr = 25 mag arcsec−2, Cattapan et al. 2019). Using the wavelet technique, the mean surface brightness of the ICL component in compact groups HCG 79 and HCG 95 are μR = 23.9 mag arcsec−2 and μR = 25.5 mag arcsec−2, respectively (Da Rocha & Mendes de Oliveira 2005). Furnell et al. (2021) suggest a SB cut μB = 25 mag arcsec−2.
We ran several tests and decided on a cut at RC = 25.75 mag arcsec−2 (r = 26 mag arcsec−2). We have found that some diffuse (visible to the eye) light was cut away, especially in the southeastern stream, when fainter values of SB cuts were used. Adding the surface brightness cosmological dimming, 2.5 × (1 + z)4, and applying the K-correction (Fukugita et al. 1995), the rest-frame SB cut is RC ∼ 25 mag arcsec−2 (r ∼ 25.25 mag arcsec−2).
In Fig. 10, we show in gray the pixels that pass through the cut, that is, pixels fainter than the selected cutoff and brighter than the mean sky plus 3σ. All black pixels are brighter than our SB cut and white pixels are fainter than our sky cut. We calculate the ICL within 0.5 R200 and all pixels beyond this radius are excluded from the computation. We note that we also applied roughly masks. In particular, for the two very bright saturated stars we checked that our masks are large enough to mask all the light from the wings of the PSF by measuring the sky just outside the mask limits. We computed the mean value of the sky for each of the four sides (top, bottom, left, right) using imexam in more than ten points per side and we then computed the mean values. We verified that all the mean values are below the threshold of the sky plus 3σ that we used as the lower limit for our SB measurements. We computed a maximum and a minimum value for the ICL: the former was computed by applying rectangular masks to the two saturated bright stars and all the nonmember galaxies (cyan circles and the large spiral labeled with “Spi” in Fig. 1). The corresponding masks are shown in red in Fig. 10. The minimum value was computed by also masking all the galaxies brightest than rBGG1 + 3 with no available redshift, that is, treating them as nonmember galaxies (light blue masks in Fig. 10).
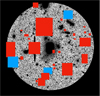 |
Fig. 10. Image highlighting the ICL within 0.5 R200. Gray pixels represent the ICL. Black pixels are brighter than 26 mag arcsec−2 and white pixels are fainter than our estimate of the sky plus 3σ (see text). Red regions mask the two bright saturated stars and all nonmember galaxies. Light blue regions mask bright galaxies without redshift. |
The total ICL was then calculated using only the gray pixels of the image. Specifically, all of these pixels were added together and the result was converted to an absolute magnitude. Finally, the total luminosity of the ICL was calculated.
We find LICL in the range 0.91–0.96 × 10¹¹ L⊙ (in r band). After applying the same 17% magnitude corrections as for Lgals (cf. Sect. 4.1), we can estimate the fraction of light confined in the ICL with respect to the total amount of light in the group (galaxies plus ICL) within 0.5 R200 as follows: fICL = LICL/(Lgals + LICL)∼19–22%. We also evaluate the fraction of light in the BGGs plus ICL, fICL + BGGs = LICL + BGGs/(Lgals + LICL)∼50–56%.
Our estimate of ICL in GrG 0330−0218 is not expected to be affected from the presence of MACS0329. In the cluster rest-frame GrG 0330−0218 is projected at 3.2 Mpc from the cluster center (∼1.7 R200 of MAC0329, Umetsu et al. 2018) and the whole 0.5 R200 group region here analyzed is out of the cluster R200 (see Fig. 3), while ICL is generally reported to be important in the cluster core. For instance, Zibetti et al. (2005) are able to detect ICL out to 700 kpc from the cluster center, but at that radius the measured SB is about five mag arcsec−2 fainter than at 100 kpc.
6. Large-scale environment
We used NED to analyze the 30′ region around GrG J0330−0218 and search for close structures. About 1′ east and 22′ southeast of the group are the two clusters NSC J033011−021803 and NSC J033125−022751, listed by Gal et al. (2009) with a photometric redshift of zphot = 0.1233. The redshift difference from our spectroscopic redshift of GrG J0330−0218 is comparable to the rms given by Gal et al. (2009). Thus, it is quite possible that NSC J033011−021803 could be the detection of GrG J0330−0218 or a combination of this group and foreground galaxies. The center of NSC J033125−022751 lies outside the region covered by CLASH-VLT and TNG acquired redshift data.
NED also lists the Zwicky cluster ZwCl 0328.5−0205, 27′ northeast of GrG J0330−0218. In October 2018, using DOLoRes and the LR-B grism at TNG, we made long-slit spectroscopic observations of the two dominant galaxies at the center of ZwCl 0328.5−0205 (G1=WISEA J033116.12−015614.4 and G2=WISEA J033113.91−015648.2) with exposure times of 2 × 1800 s. We obtained cz = 43 277 ± 67 km s−1 and cz = 44 146 ± 48 km s−1, respectively. The mean redshift of G1 and G2 is z = 0.1458, which can be considered as the redshift of ZwCl 0328.5−0205. Our analysis of the redshift distribution shows a peak in the foreground with respect to GrG J0330−0218 (see Fig. 4). This peak is located at z = 0.1435, very close to the redshift of ZwCl 0328.5−0205. We conclude that the galaxies forming this peak probably belong to the outermost regions of this cluster, at ≳4 Mpc from the cluster center.
7. GrG J0330−0218, its nature, and destiny
Despite its small mass, GrG J0330−0218 appears to be a well-defined galaxy system. In the phase-space diagram, the distribution of member galaxies shows the familiar, characteristic trumpet-shaped pattern associated with the escape velocity of galaxy clusters, suggesting that the group is a virialized structure (e.g., Regos & Geller 1989; den Hartog & Katgert 1996). The mass-to-light ratio is also consistent with results on poor clusters (e.g., Popesso et al. 2005).
The red sequence is visible down to r ∼ 20 mag, about 2.5 mag below the value of M* in the luminosity function (see Fig. 6). Our fitted relations agree well with those reported in the literature for SDSS bands and for galaxy clusters at comparable redshift (red dashed lines in Fig. 6). The r − i vs. r relation is obtained from the results of Barrena et al. (2012), that is, with the fixed characteristic slope and the intercept related to the redshift of the system. The g − r vs. r relation is the one given by Goto et al. (2002) in their Fig. 3 for the cluster Abell 1577 at z ∼ 0.14. This agreement is consistent with the fact that galaxies in different environments appear to show similar red sequences (e.g., Martínez et al. 2010 and references therein).
As for the X-ray emitting gas, we show the existence of an extended component centered on BGG1 out to 1′∼160 kpc ∼ 0.2 R200. In groups, the peak of the X-ray emission usually coincides with a luminous elliptical or S0 galaxy, which tends to be the optically most luminous group member. Expected temperature of the intragroup medium is < 2 keV (e.g., Mulchaey 2000 and references therein). The fact that the expected temperature of the intragroup medium is similar to the temperature of gas in galaxies makes difficult to disentangle the intragroup and galaxy emissions. For instance, in GrG J0330−0218 we expect a temperature in the range 1–2 keV (e.g., Fig. 4 Lovisari et al. 2021 using the rescaling M500 = 0.75 M200). BGG1 has a disk and possibly some spiral arms. From the photometric decomposition we obtain the bulge-to-total luminosity ratio B/T ∼ 0.3 which is typical of early-type spirals (e.g., Sab–Sb according to Oohama et al. 2009). The modest [OII] emission line also excluded late-type spirals (cf. our Fig. 2 – upper panel with reference spectra by Kennicutt 1992). For early-type spirals one does not expect the X-ray halo typical of a giant elliptical, but at most a halo out to few tens of kpc and generally at temperature ≲0.7 keV, as obtained from dedicate observations (e.g., 20 kpc for Sa Sombrero galaxy by Li et al. 2007; 50 kpc for Sb NGC 6753 by Bogdán et al. 2017). Therefore we would be attempted to explain the extended emission in GrG J0330−0218 with the presence of the intragroup gas, but the scenario is more complicated than this. In fact, the observed X-ray emitting region includes both BGG1 and BGG2 and these galaxies are in interaction, which is expected to enhance the level of X-ray emission (e.g., Fabbiano et al. 2004; Richings et al. 2010). In groups Desjardins et al. (2013) have also shows that X-ray emission comes from diffuse features linked to individual galaxies likely as a result of the interaction. With the available data, we cannot separate the intragroup component from the galaxy emission and need ad hoc data to give any conclusion about the existence and properties of the intragroup gas in GrG J0330−0218.
The central region of GrG J0330−0218 is very compact and isolated. We have verified that it formally meets the photometric criteria for compact groups (Hickson 1982). A compact group should have N ≥ 4, ΘN ≥ 3 ΘG, and μG < 26.0 mag arcsec−2, where N is the number of galaxies within 3 mag of the brightest galaxy, μG is the total magnitude of these galaxies per arcsec2 averaged over the smallest circle (with angular diameter ΘG) containing their geometric centers, and ΘN is the angular diameter of the largest concentric circle that contains no other (external) galaxy within the above magnitude range or brighter. In our case, in the central region of GrG J0330−0218 there are at least four galaxies in the central region in the required magnitude range (between mBGG1 and mBGG1 + 3). These galaxies are the pair of dominant galaxies and two close galaxies in the south, the ID. 14 and one nonmember galaxy (labeled with “Snm” in Fig. 1). This leads to a surface brightness μG ∼ 23.5 mag arcsec−2 within a circle of radius ΘG ∼ 18″. The bright foreground galaxy in the north-northeast (labeled with “Nnm” in Fig. 1) is the closest external galaxy in distance and is located at ΘN ∼ 60″ > 3 ΘG. However, when considering spectroscopic information, the “Snm” galaxy is only projected there, and thus there are only N = 3 real three group members. Of consequence, the central region of the group can no longer be classified as a compact group. Rather, GrG J0330-0218 is better described as a loose group hosting a pair of luminous, dominant galaxies.
More interesting is the consideration of an “evolved” GrG J0330−0218, in which the two dominant galaxies have probably merged into a single, bright central galaxy (hereafter BGG1+2, rBGG1 + 2 = 16.08). Lin & Mohr (2004) studied the coevolution of brightest cluster galaxies (BCGs) and host galaxy systems using the Two Micron All Sky Survey (2MASS). Considering appropriate corrections and converting to the 2MASS K-band (r − K = 2.5), we obtain the K-band luminosity of BGG1+2 LK, BGG1 + 2 ∼ 4.8 × 10¹¹ L⊙. This agrees well with the relation proposed by Lin & Mohr (2004) that a system with M200 ∼ 0.6 × 10¹⁴ M⊙ has a LK, BCG in the range 4.7–5.1 × 10¹¹ L⊙ (see their Eq. (1)). Considering the evolved GrG J0330−0218, we can also discuss the possibility that this system can be classified as a fossil group from a photometric point of view, that is, if the magnitude difference between the first and the second brightest galaxy within 0.5 R200 is Δm12 ≥ 2 mag (Jones et al. 2003). The luminous galaxy BGG3 (ID. 3 with r = 17.15) to the north, in close proximity to 0.5 R200, is crucial for the classification of GrG J0330−0218. The distance between this galaxy and the center of the system is 0.373 Mpc, which should be compared to 0.5 R200 with  . In practice, the evolved GrG J0330-0218 could be classified as a fossil system with an uncertainty of 1σ. This fits well with a scenario in which the fossil state of galaxy systems is a transitional state, as suggested by a variety of observational studies (see Aguerri & Zarattini 2021 for a review).
As for the ICL content, the values reported in the literature are in a wide interval. The estimate of fICL, the fraction of ICL luminosity to total luminosity, ranges from 0 to 40% (see Fig. 3 of Montes 2022). This wide range is likely due to a real intrinsic variance in galaxy systems, but also to variations due to different methods (see our discussion in Sect. 1 and, e.g., Table 1 of Kluge et al. 2021 for a specific comparison). Other variations are due to the use of images of different depth and different definitions of the total luminosity of the system. All this makes a direct comparison of our value fICL ∼ 20% with observational works quite tricky. As an example, we can attempt a comparison with the results of Kluge et al. (2021) who used several methods and in particular several SB cuts analyzing a sample of 170 clusters. Within the 1-sigma error, our estimate agrees with their value fICL = 13 ± 13% obtained with SB cut at 26 g mag arcsec−2. Our estimate also fits well among the values computed in galaxy groups, which, as more massive systems, show a large spread ranging from 0 to 40% (see Fig. 9 of Ragusa et al. 2021). The analysis of Martínez-Lombilla et al. (2023) of a group at z ∼ 0.2 shows the variation in the fICL estimate when using two different methods. In the r band, the value of fICL goes from ∼4% to ∼9% when using a brighter cut (our rest-frame cut is also brighter) to ∼30% when using a 2D modeling method. Our estimate lies within the range.
We can make a more significant comparison using fICL + BGGs = 50–56%, which is a more robust quantity than the luminosity of ICL and BCG separately. After a small correction of −5%, our estimate of fICL + BGGs can be directly compared with the estimates obtained by Gonzalez et al. (2007) and Furnell et al. (2021) for 24 and 18 galaxy systems, respectively. The −5% correction is due to the fact that they make computations within a larger radius, R500 instead of 0.5 R200 (see Fig. 5 of Gonzalez et al. 2007). As shown in Fig. 4 of Gonzalez et al. (2007) and Fig. 13 of Furnell et al. (2021), fICL + BCG decreases for increasing system mass. Considering that GrG J0330−0218 has a velocity dispersion of σv ∼ 370 km s−1 and mass M200 ∼ 6 × 10¹⁴ M⊙, our value of fICL + BGGs agrees well with their results for systems of similar mass. Our estimate also fits in the range of values measured for galaxy systems at z = 0.1–0.2 (see Fig. 15 of Furnell et al. 2021).
As for the formation of ICL in GrG J0330−0218, we note that it can be compared to one of the prototypical cases described in the numerical simulations of Rudick et al. (2009), where two massive galaxies interact outside the cluster environment and produce streams of ICL. According to Rudick et al. (2009), the generation of streams is favored by the strong tidal fields associated with close interactions and mergers between pairs of galaxies. These streams are destined to grow very rapidly and then decay slowly when the interaction occurs outside a cluster core. However, as accretion-driven growth of large-scale structure proceeds, the ultimate fate of these streams is to contribute to diffuse light in clusters. As in GrG J0330−0218, when mapping the surface brightness to deep levels, images of groups are particularly rich of a lot of features such as streams, tails, or arclike structures (e.g., Spavone et al. 2018; Cattapan et al. 2019).
In the case of GrG J0330−0218, we note that it is projected about 4 Mpc from the center of the cluster ZwCl 0328.5−0205 and the velocity difference is ΔVrf < 2100 km s−1. Since galaxy clusters extend far beyond R200 (e.g., Biviano et al. 2002; Rines et al. 2013) and the expected infall velocity between galaxy clusters can be on the order of a few thousand of km s−1 (e.g., 3000 km s−1Sarazin 2002), GrG J0330−0218 may be destined to fall on the close Zwicky cluster, consistent with theoretical expectations that ICL produced in groups is destined to form ICL in clusters.
8. Summary and conclusions
We summarize our results on GrG J0330−0218, a foreground group of galaxies that we serendipitously discovered during our visual inspection of a Suprime-Cam image of the galaxy cluster MACS0329 at z ∼ 0.45. Our investigation began with the detection of diffuse light around a pair of bright, comparably luminous galaxies, which were then identified as the two brightest galaxies in the group, BGG1 to the north and BGG2 to the south. We used a large redshift sample obtained as part of the CLASH-VLT project and ad hoc observations from TNG (1712 and 18 galaxies, respectively) to obtain a sample of 41 member galaxies. Our main results are:
-
The mean redshift of the group is ⟨z⟩ = 0.1537 ± 0.0001 and the (line of sight) velocity dispersion is
 .
. -
The distribution of galaxies in the phase space diagram indicates that the group is a dynamically evolved system. We estimated the dynamical virial mass M200 ∼ 6 × 10¹³ M⊙ within R200 = 0.77 Mpc.
-
The group is also characterized by a typical value for its mass-to-light ratio, and the red sequence is clearly visible and extends down to 2.5 mag below the value of M*.
-
We find extended X-ray emission out to ∼0.2 R200 centered on BGG1.
-
We estimate the fraction of light in the ICL ∼20%, and the fraction included in ICL plus BGGs ∼50%, which are acceptable values within the variance of the values reported in the literature.
We would like to emphasize that we were able to discover this group only thanks to the combination of two factors. First, we interpreted the presence of diffuse light around the galaxy pair as a product of dynamical interaction. Second, thanks to the huge number of redshifts available from the CLASH-VLT project, we obtained a first indication of the presence of a foreground galaxy system in the region around the galaxy pair. These two facts have led us to better investigate the nature of the galaxy pair.
We conclude that it is worthwhile to analyze the bright pairs of galaxies surrounded by diffuse light in redshift space to check for the presence of parent groups. The ICL has the potential to provide a wealth of information about the formation and evolution of galaxy systems. Here we propose that galaxy pairs with ICL could be used as signposts for galaxy groups.
Fig. 4.12 of the Chandra proposal observatory guide cxc.harvard.edu/proposer/POG/html/chap4.html
Acknowledgments
We thank Alfonso Aguerri for useful suggestions on the ICL computation and Paula Tarrío for the calculation of the photometric redshift of the large spiral galaxy located east of the center of the group. We thank the referee for his/her useful and constructive comments. We acknowledge financial support through grants PRIN-MIUR 2017WSCC32, 2020SKSTHZ, INAF-Mainstreams 1.05.01.86.20. MG acknowledges financial support from the University of Trieste through the program FRA 2022. SZ is supported by Padova University grant Fondo Dipartimenti di Eccellenza ARPE 1983/2019. This publication is based on observations made on the island of La Palma with the Italian Telescopio Nazionale Galileo (TNG), which is operated by the Fundación Galileo Galilei – INAF (Istituto Nazionale di Astrofisica) and is located in the Spanish Observatorio of the Roque de Los Muchachos of the Instituto de Astrofísica de Canarias. This publication is based on observations collected at the European Southern Observatory under ESO Large Programme 186.A-0798. Based in part on data collected at Subaru Telescope and obtained from the SMOKA, which is operated by the Astronomy Data Center, National Astronomical Observatory of Japan. This work makes use of the Pan-STARRS1 Surveys (PS1) and the PS1 public science archive which have been made possible through contributions by the Institute for Astronomy, the University of Hawaii, the Pan-STARRS Project Office, the Max-Planck Society and other Institutions.
References
- Aguerri, J. A. L., & Zarattini, S. 2021, Universe, 7, 132 [NASA ADS] [CrossRef] [Google Scholar]
- Aguerri, J. A. L., Castro-Rodríguez, N., Napolitano, N., Arnaboldi, M., & Gerhard, O. 2006, A&A, 457, 771 [NASA ADS] [CrossRef] [EDP Sciences] [Google Scholar]
- Alamo-Martínez, K. A., Chies-Santos, A. L., Beasley, M. A., et al. 2021, MNRAS, 503, 2406 [CrossRef] [Google Scholar]
- Arnaboldi, M., Freeman, K. C., Mendez, R. H., et al. 1996, ApJ, 472, 145 [NASA ADS] [CrossRef] [Google Scholar]
- Balestra, I., Mercurio, A., Sartoris, B., et al. 2016, ApJS, 224, 33 [Google Scholar]
- Barrena, R., Girardi, M., Boschin, W., et al. 2011, A&A, 529, A128 [NASA ADS] [CrossRef] [EDP Sciences] [Google Scholar]
- Barrena, R., Girardi, M., Boschin, W., & Mardirossian, F. 2012, A&A, 540, A90 [NASA ADS] [CrossRef] [EDP Sciences] [Google Scholar]
- Bartalucci, I., Arnaud, M., Pratt, G. W., et al. 2017, A&A, 598, A61 [NASA ADS] [CrossRef] [EDP Sciences] [Google Scholar]
- Beers, T. C., Flynn, K., & Gebhardt, K. 1990, AJ, 100, 32 [Google Scholar]
- Benavides, J. A., Sales, L. V., & Abadi, M. G. 2020, MNRAS, 498, 3852 [Google Scholar]
- Bertin, E., & Arnouts, S. 1996, A&AS, 117, 393 [NASA ADS] [CrossRef] [EDP Sciences] [Google Scholar]
- Bird, C. M., & Beers, T. C. 1993, AJ, 105, 1596 [NASA ADS] [CrossRef] [Google Scholar]
- Biviano, A., Katgert, P., Thomas, T., & Adami, C. 2002, A&A, 387, 8 [NASA ADS] [CrossRef] [EDP Sciences] [Google Scholar]
- Bogdán, Á., Bourdin, H., Forman, W. R., et al. 2017, ApJ, 850, 98 [CrossRef] [Google Scholar]
- Boschin, W., Girardi, M., Barrena, R., & Nonino, M. 2012, A&A, 540, A43 [NASA ADS] [CrossRef] [EDP Sciences] [Google Scholar]
- Burke, C., Collins, C. A., Stott, J. P., & Hilton, M. 2012, MNRAS, 425, 2058 [Google Scholar]
- Caminha, G. B., Rosati, P., Grillo, C., et al. 2019, A&A, 632, A36 [NASA ADS] [CrossRef] [EDP Sciences] [Google Scholar]
- Castro-Rodríguez, N., Aguerri, J. A. L., Arnaboldi, M., et al. 2003, A&A, 405, 803 [NASA ADS] [CrossRef] [EDP Sciences] [Google Scholar]
- Cattapan, A., Spavone, M., Iodice, E., et al. 2019, ApJ, 874, 130 [Google Scholar]
- Contini, E. 2021, Galaxies, 9, 60 [NASA ADS] [CrossRef] [Google Scholar]
- Contini, E., De Lucia, G., Villalobos, Á., & Borgani, S. 2014, MNRAS, 437, 3787 [Google Scholar]
- Contini, E., Yi, S. K., & Kang, X. 2018, MNRAS, 479, 932 [NASA ADS] [Google Scholar]
- Cortese, L., Gavazzi, G., Boselli, A., et al. 2006, A&A, 453, 847 [NASA ADS] [CrossRef] [EDP Sciences] [Google Scholar]
- Cui, W., Murante, G., Monaco, P., et al. 2014, MNRAS, 437, 816 [Google Scholar]
- Danese, L., de Zotti, G., & di Tullio, G. 1980, A&A, 82, 322 [NASA ADS] [Google Scholar]
- Da Rocha, C., & Mendes de Oliveira, C. 2005, MNRAS, 364, 1069 [Google Scholar]
- Da Rocha, C., Ziegler, B. L., & Mendes de Oliveira, C. 2008, MNRAS, 388, 1433 [Google Scholar]
- de Lorenzo-Cáceres, A., Méndez-Abreu, J., Thorne, B., & Costantin, L. 2020, MNRAS, 494, 1826 [Google Scholar]
- den Hartog, R., & Katgert, P. 1996, MNRAS, 279, 349 [NASA ADS] [CrossRef] [Google Scholar]
- Desjardins, T. D., Gallagher, S. C., Tzanavaris, P., et al. 2013, ApJ, 763, 121 [NASA ADS] [CrossRef] [Google Scholar]
- Dolag, K., Murante, G., & Borgani, S. 2010, MNRAS, 405, 1544 [NASA ADS] [Google Scholar]
- Dressler, A., & Shectman, S. A. 1988, AJ, 95, 985 [Google Scholar]
- Durbala, A., del Olmo, A., Yun, M. S., et al. 2008, AJ, 135, 130 [NASA ADS] [CrossRef] [Google Scholar]
- Ellien, A., Slezak, E., Martinet, N., et al. 2021, A&A, 649, A38 [NASA ADS] [CrossRef] [EDP Sciences] [Google Scholar]
- Fabbiano, G., Baldi, A., King, A. R., et al. 2004, ApJ, 605, L21 [NASA ADS] [CrossRef] [Google Scholar]
- Fadda, D., Girardi, M., Giuricin, G., Mardirossian, F., & Mezzetti, M. 1996, ApJ, 473, 670 [NASA ADS] [CrossRef] [Google Scholar]
- Feldmeier, J. J., Mihos, J. C., Morrison, H. L., et al. 2004, ApJ, 609, 617 [Google Scholar]
- Flewelling, H. A., Magnier, E. A., Chambers, K. C., et al. 2020, ApJS, 251, 7 [NASA ADS] [CrossRef] [Google Scholar]
- Fruscione, A., McDowell, J. C., Allen, G. E., et al. 2006, Proc. SPIE, 6270, 62701V [Google Scholar]
- Fukugita, M., Shimasaku, K., & Ichikawa, T. 1995, PASP, 107, 945 [Google Scholar]
- Furnell, K. E., Collins, C. A., Kelvin, L. S., et al. 2021, MNRAS, 502, 2419 [NASA ADS] [CrossRef] [Google Scholar]
- Gal, R. R., Lopes, P. A. A., de Carvalho, R. R., et al. 2009, AJ, 137, 2981 [NASA ADS] [CrossRef] [Google Scholar]
- Garmire, G. P., Bautz, M. W., Ford, P. G., Nousek, J. A., & Ricker, Jr., G. R. 2003, SPIE Conf. Ser., 4851, 28 [NASA ADS] [Google Scholar]
- Gebhardt, K., & Beers, T. C. 1991, ApJ, 383, 72 [NASA ADS] [CrossRef] [Google Scholar]
- Giallongo, E., Menci, N., Grazian, A., et al. 2014, ApJ, 781, 24 [Google Scholar]
- Girardi, M., Fadda, D., Giuricin, G., et al. 1996, ApJ, 457, 61 [NASA ADS] [CrossRef] [Google Scholar]
- Girardi, M., Boschin, W., & Barrena, R. 2010, A&A, 517, A65 [NASA ADS] [CrossRef] [EDP Sciences] [Google Scholar]
- Girardi, M., Aguerri, J. A. L., De Grandi, S., et al. 2014, A&A, 565, A115 [NASA ADS] [CrossRef] [EDP Sciences] [Google Scholar]
- Girardi, M., Mercurio, A., Balestra, I., et al. 2015, A&A, 579, A4 [NASA ADS] [CrossRef] [EDP Sciences] [Google Scholar]
- Girardi, M., Boschin, W., Nonino, M., Innocentin, C., & De Grandi, S. 2022, A&A, 658, A159 [NASA ADS] [CrossRef] [EDP Sciences] [Google Scholar]
- Gonzalez, A. H., Zaritsky, D., & Zabludoff, A. I. 2007, ApJ, 666, 147 [Google Scholar]
- Goto, T., Sekiguchi, M., Nichol, R. C., et al. 2002, AJ, 123, 1807 [NASA ADS] [CrossRef] [Google Scholar]
- Hickox, R. C., & Markevitch, M. 2006, ApJ, 645, 95 [NASA ADS] [CrossRef] [Google Scholar]
- Hickson, P. 1982, ApJ, 255, 382 [NASA ADS] [CrossRef] [Google Scholar]
- Inami, H., Bacon, R., Brinchmann, J., et al. 2017, A&A, 608, A2 [NASA ADS] [CrossRef] [EDP Sciences] [Google Scholar]
- Janowiecki, S., Mihos, J. C., Harding, P., et al. 2010, ApJ, 715, 972 [Google Scholar]
- Jones, L. R., Ponman, T. J., Horton, A., et al. 2003, MNRAS, 343, 627 [NASA ADS] [CrossRef] [Google Scholar]
- Kennicutt, R. C., Jr. 1992, ApJS, 79, 255 [NASA ADS] [CrossRef] [Google Scholar]
- Kluge, M., Bender, R., Riffeser, A., et al. 2021, ApJS, 252, 27 [Google Scholar]
- Li, Z., Wang, Q. D., & Hameed, S. 2007, MNRAS, 376, 960 [NASA ADS] [CrossRef] [Google Scholar]
- Lin, Y.-T., & Mohr, J. J. 2004, ApJ, 617, 879 [Google Scholar]
- Longobardi, A., Arnaboldi, M., Gerhard, O., Pulsoni, C., & Söldner-Rembold, I. 2018, A&A, 620, A111 [NASA ADS] [CrossRef] [EDP Sciences] [Google Scholar]
- Lovisari, L., Ettori, S., Gaspari, M., & Giles, P. A. 2021, Universe, 7, 139 [NASA ADS] [CrossRef] [Google Scholar]
- Maddox, S. J., Sutherland, W. J., Efstathiou, G., & Loveday, J. 1990, MNRAS, 243, 692 [NASA ADS] [Google Scholar]
- Markevitch, M. 2006, in The X-ray Universe 2005, ed. A. Wilson, ESA Spec. Publ., 604, 723 [NASA ADS] [Google Scholar]
- Martínez, H. J., Coenda, V., & Muriel, H. 2010, MNRAS, 403, 748 [CrossRef] [Google Scholar]
- Martínez-Lombilla, C., Brough, S., Montes, M., et al. 2023, MNRAS, 518, 1195 [Google Scholar]
- Medezinski, E., Umetsu, K., Nonino, M., et al. 2013, ApJ, 777, 43 [NASA ADS] [CrossRef] [Google Scholar]
- Mendes de Oliveira, C., Plana, H., Amram, P., Balkowski, C., & Bolte, M. 2001, AJ, 121, 2524 [CrossRef] [Google Scholar]
- Méndez-Abreu, J., Aguerri, J. A. L., Corsini, E. M., & Simonneau, E. 2008, A&A, 478, 353 [NASA ADS] [CrossRef] [EDP Sciences] [Google Scholar]
- Méndez-Abreu, J., Debattista, V. P., Corsini, E. M., & Aguerri, J. A. L. 2014, A&A, 572, A25 [NASA ADS] [CrossRef] [EDP Sciences] [Google Scholar]
- Méndez-Abreu, J., Ruiz-Lara, T., Sánchez-Menguiano, L., et al. 2017, A&A, 598, A32 [NASA ADS] [CrossRef] [EDP Sciences] [Google Scholar]
- Mercurio, A., Rosati, P., Biviano, A., et al. 2021, A&A, 656, A147 [NASA ADS] [CrossRef] [EDP Sciences] [Google Scholar]
- Mihos, J. C. 2016, in The General Assembly of Galaxy Halos: Structure, Origin and Evolution, eds. A. Bragaglia, M. Arnaboldi, M. Rejkuba, & D. Romano, 317, 27 [Google Scholar]
- Mihos, J. C., Harding, P., Feldmeier, J., & Morrison, H. 2005, ApJ, 631, L41 [Google Scholar]
- Montes, M. 2022, Nat. Astron., 6, 308 [NASA ADS] [CrossRef] [Google Scholar]
- Montes, M., & Trujillo, I. 2018, MNRAS, 474, 917 [Google Scholar]
- Montes, M., & Trujillo, I. 2022, ApJ, 940, L51 [NASA ADS] [CrossRef] [Google Scholar]
- Montes, M., Brough, S., Owers, M. S., & Santucci, G. 2021, ApJ, 910, 45 [Google Scholar]
- Mulchaey, J. S. 2000, ARA&A, 38, 289 [NASA ADS] [CrossRef] [Google Scholar]
- Munari, E., Biviano, A., Borgani, S., Murante, G., & Fabjan, D. 2013, MNRAS, 430, 2638 [Google Scholar]
- Murante, G., Giovalli, M., Gerhard, O., et al. 2007, MNRAS, 377, 2 [Google Scholar]
- Navarro, J. F., Frenk, C. S., & White, S. D. M. 1997, ApJ, 490, 493 [Google Scholar]
- Noguchi, M. 1987, MNRAS, 228, 635 [NASA ADS] [Google Scholar]
- Nonino, M., Dickinson, M., Rosati, P., et al. 2009, ApJS, 183, 244 [NASA ADS] [CrossRef] [Google Scholar]
- Oohama, N., Okamura, S., Fukugita, M., Yasuda, N., & Nakamura, O. 2009, ApJ, 705, 245 [NASA ADS] [CrossRef] [Google Scholar]
- Pisani, A. 1993, MNRAS, 265, 706 [NASA ADS] [Google Scholar]
- Poliakov, D., Mosenkov, A. V., Brosch, N., Koriski, S., & Rich, R. M. 2021, MNRAS, 503, 6059 [Google Scholar]
- Popesso, P., Biviano, A., Böhringer, H., Romaniello, M., & Voges, W. 2005, A&A, 433, 431 [NASA ADS] [CrossRef] [EDP Sciences] [Google Scholar]
- Postman, M., Coe, D., Benítez, N., et al. 2012, ApJS, 199, 25 [Google Scholar]
- Presotto, V., Girardi, M., Nonino, M., et al. 2014, A&A, 565, A126 [NASA ADS] [CrossRef] [EDP Sciences] [Google Scholar]
- Ragusa, R., Spavone, M., Iodice, E., et al. 2021, A&A, 651, A39 [NASA ADS] [CrossRef] [EDP Sciences] [Google Scholar]
- Raj, M. A., Iodice, E., Napolitano, N. R., et al. 2020, A&A, 640, A137 [EDP Sciences] [Google Scholar]
- Regos, E., & Geller, M. J. 1989, AJ, 98, 755 [NASA ADS] [CrossRef] [Google Scholar]
- Richings, A. J., Fabbiano, G., Wang, J., & Roberts, T. P. 2010, ApJ, 723, 1375 [NASA ADS] [CrossRef] [Google Scholar]
- Rines, K., Geller, M. J., Diaferio, A., & Kurtz, M. J. 2013, ApJ, 767, 15 [NASA ADS] [CrossRef] [Google Scholar]
- Rosati, P., Balestra, I., Grillo, C., et al. 2014, The Messenger, 158, 48 [NASA ADS] [Google Scholar]
- Rudick, C. S., Mihos, J. C., & McBride, C. 2006, ApJ, 648, 936 [NASA ADS] [CrossRef] [Google Scholar]
- Rudick, C. S., Mihos, J. C., Frey, L. H., & McBride, C. K. 2009, ApJ, 699, 1518 [Google Scholar]
- Rudick, C. S., Mihos, J. C., & McBride, C. K. 2011, ApJ, 732, 48 [Google Scholar]
- Sarazin, C. L. 2002, in Merging Processes in Galaxy Clusters, eds. L. Feretti, I. M. Gioia, & G. Giovannini, Astrophys. Space Sci. Lib., 272, 1 [NASA ADS] [Google Scholar]
- Schlafly, E. F., & Finkbeiner, D. P. 2011, ApJ, 737, 103 [Google Scholar]
- Spavone, M., Iodice, E., Capaccioli, M., et al. 2018, ApJ, 864, 149 [Google Scholar]
- Struble, M. F. 1988, ApJ, 330, L25 [NASA ADS] [CrossRef] [Google Scholar]
- Tarrío, P., & Zarattini, S. 2020, A&A, 642, A102 [NASA ADS] [CrossRef] [EDP Sciences] [Google Scholar]
- Tonry, J. & Davis, M. 1979, AJ, 84, 1511 [NASA ADS] [CrossRef] [Google Scholar]
- Umetsu, K., Sereno, M., Tam, S.-I., et al. 2018, ApJ, 860, 104 [Google Scholar]
- Zibetti, S., White, S. D. M., Schneider, D. P., & Brinkmann, J. 2005, MNRAS, 358, 949 [Google Scholar]
- Zwicky, F. 1951, PASP, 63, 61 [NASA ADS] [CrossRef] [Google Scholar]
All Tables
All Figures
|
Fig. 1. Southeastern region of the Suprime-Cam RC-band image of the cluster MACS0329 (north top and east left) showing the group region within 0.5 R200 ∼ 2.4′ (enclosed in the large, thick green circle). The thin green circle indicates the 1′ radius region (1′∼160 kpc at the group redshift). Galaxies with available redshift are highlighted with small circles, in particular red or cyan circles in the case of members or nonmembers according to the selection procedure (see Sects. 2 and 3). Labels indicate objects discussed in the text. |
| In the text | |
|
Fig. 2. TNG spectra of BGG1 and BGG2 in the upper and lower panels, respectively. ADU in y-axis. |
| In the text | |
|
Fig. 3. Spatial distribution of all galaxies with redshift in the MACS0329 field. The large black circle indicates the R200 radius of the cluster. Red triangles and dots show galaxies with TNG and CLASH-VLT redshifts, 18 and 1712, respectively. The symbols outlined with blue circles indicate the 41 group member galaxies. The point 0,0 in the diagram indicates the center of GrG J0330−0218 and the green circle indicates the 0.5 R200 radius of the group (see also Fig. 1). |
| In the text | |
|
Fig. 4. Distribution of galaxies in our combined redshift catalog of 77 galaxies in the range z = 0.12–0.22. The histogram with the thick red line refers to the 41 galaxies that belong to the density peak of GrG J0330−0218, which was identified with the 1D-DEDICA reconstruction method (faint green line). The inset shows the 41 member galaxies with the redshifts of BGG1 and BGG2 indicated. |
| In the text | |
|
Fig. 5. Rest-frame velocity Vrf = (V − ⟨V⟩)/(1 + z) vs. projected group-centric distance R for galaxies with redshifts in the range ±5000 km s−1 (black crosses). The red circles show the 41 members of GrG J0330−0218. The large red squares refer to BGG1 and BGG2. The green curves contain the region where |Vrf| is smaller than the escape velocity (see text). |
| In the text | |
|
Fig. 6. Pan-STARRS aperture-color vs. Kron-like magnitude diagrams r − i vs. r and g − r vs. r in lower and upper panels, respectively. All member galaxies are shown with the exception of two very faint galaxies for which PS1 magnitudes are not available. The full circles indicate data obtained from PS1 mean data and open circles those available only as stacked data. The large green squares indicate BGG1 and BGG2. The blue dashed lines show the color-magnitude relations obtained for the member galaxies. The red dotted lines show the relations taken from the literature (see Sect. 7). |
| In the text | |
|
Fig. 7. Surface brightness profiles of the two X-ray sources. The group and point sources are shown by magenta and black lines. Both profiles are extracted in the 0.7–2.5 keV band. |
| In the text | |
|
Fig. 8. Photometric decomposition of BGG1. The image of the region, the model of the galaxy, and the residuals of the subtraction of the model from the image are shown in the upper panels (left, middle, and right panels). In the bottom-left panel, the ellipse-averaged surface brightness radial profile of the galaxy (black dots) and best-fit model (green solid line) are shown. Moreover, the light contributions of the bulge (dashed blue line) and disc (dotted red line) is also presented. The inset shows a zoom to the central regions of the data and the fit using a logarithmic scale for the radial distances. In the bottom-central plot the ellipticity profile and fit are shown, whereas in the bottom-right panel we present the PA profile and fit. The color code of these two last plots is the same as for the bottom-left one. |
| In the text | |
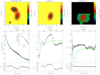 |
Fig. 9. Photometric decomposition of BGG2. The panels are the same as in Fig. 8. |
| In the text | |
|
Fig. 10. Image highlighting the ICL within 0.5 R200. Gray pixels represent the ICL. Black pixels are brighter than 26 mag arcsec−2 and white pixels are fainter than our estimate of the sky plus 3σ (see text). Red regions mask the two bright saturated stars and all nonmember galaxies. Light blue regions mask bright galaxies without redshift. |
| In the text | |
Current usage metrics show cumulative count of Article Views (full-text article views including HTML views, PDF and ePub downloads, according to the available data) and Abstracts Views on Vision4Press platform.
Data correspond to usage on the plateform after 2015. The current usage metrics is available 48-96 hours after online publication and is updated daily on week days.
Initial download of the metrics may take a while.