Fig. 6.
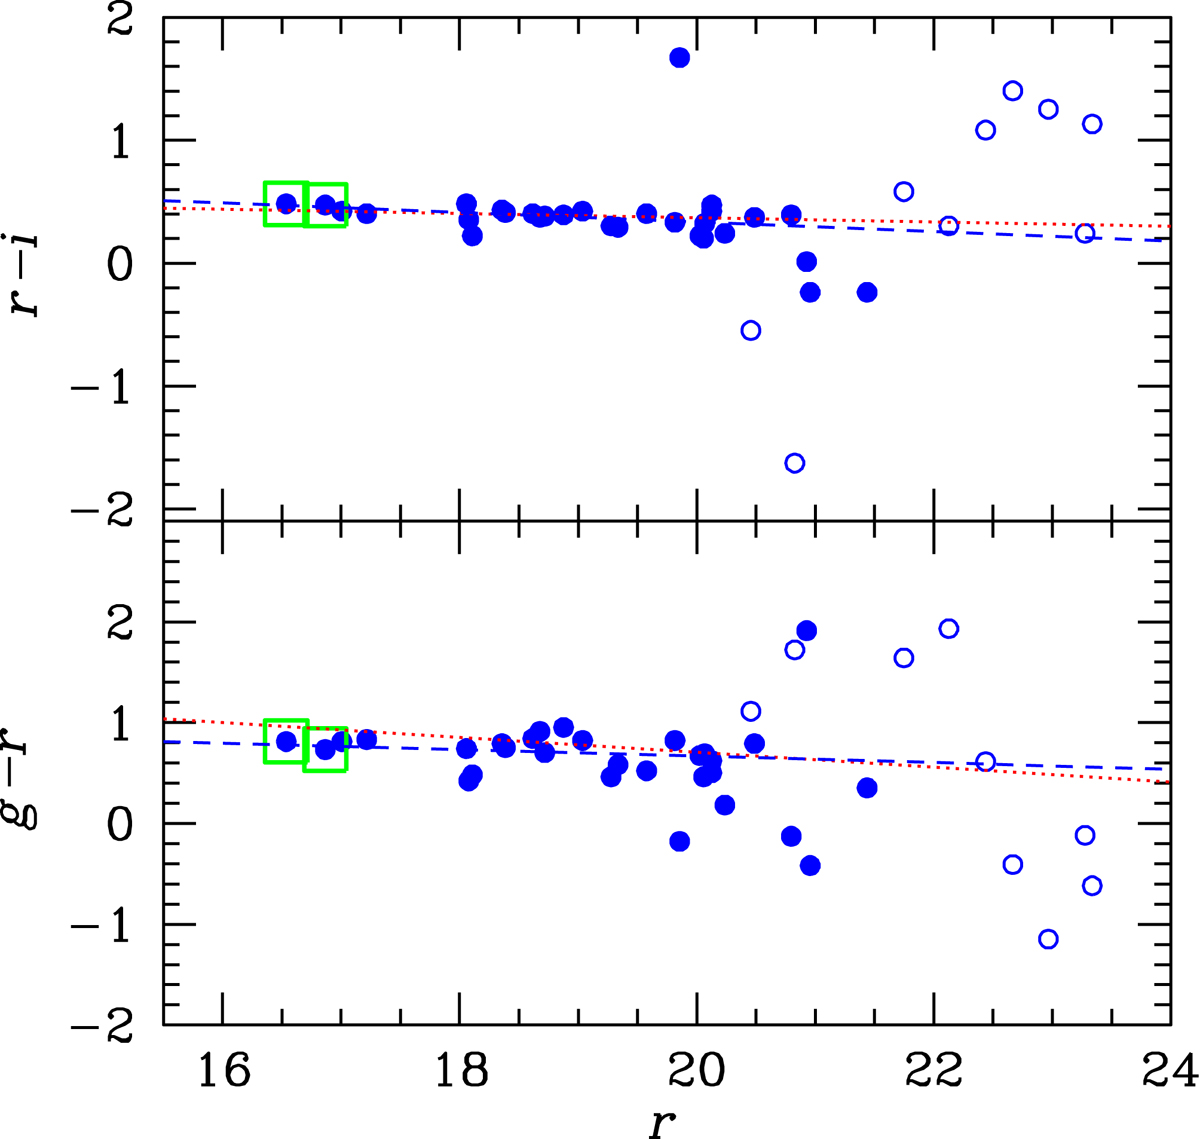
Download original image
Pan-STARRS aperture-color vs. Kron-like magnitude diagrams r − i vs. r and g − r vs. r in lower and upper panels, respectively. All member galaxies are shown with the exception of two very faint galaxies for which PS1 magnitudes are not available. The full circles indicate data obtained from PS1 mean data and open circles those available only as stacked data. The large green squares indicate BGG1 and BGG2. The blue dashed lines show the color-magnitude relations obtained for the member galaxies. The red dotted lines show the relations taken from the literature (see Sect. 7).
Current usage metrics show cumulative count of Article Views (full-text article views including HTML views, PDF and ePub downloads, according to the available data) and Abstracts Views on Vision4Press platform.
Data correspond to usage on the plateform after 2015. The current usage metrics is available 48-96 hours after online publication and is updated daily on week days.
Initial download of the metrics may take a while.