Fig. 8.
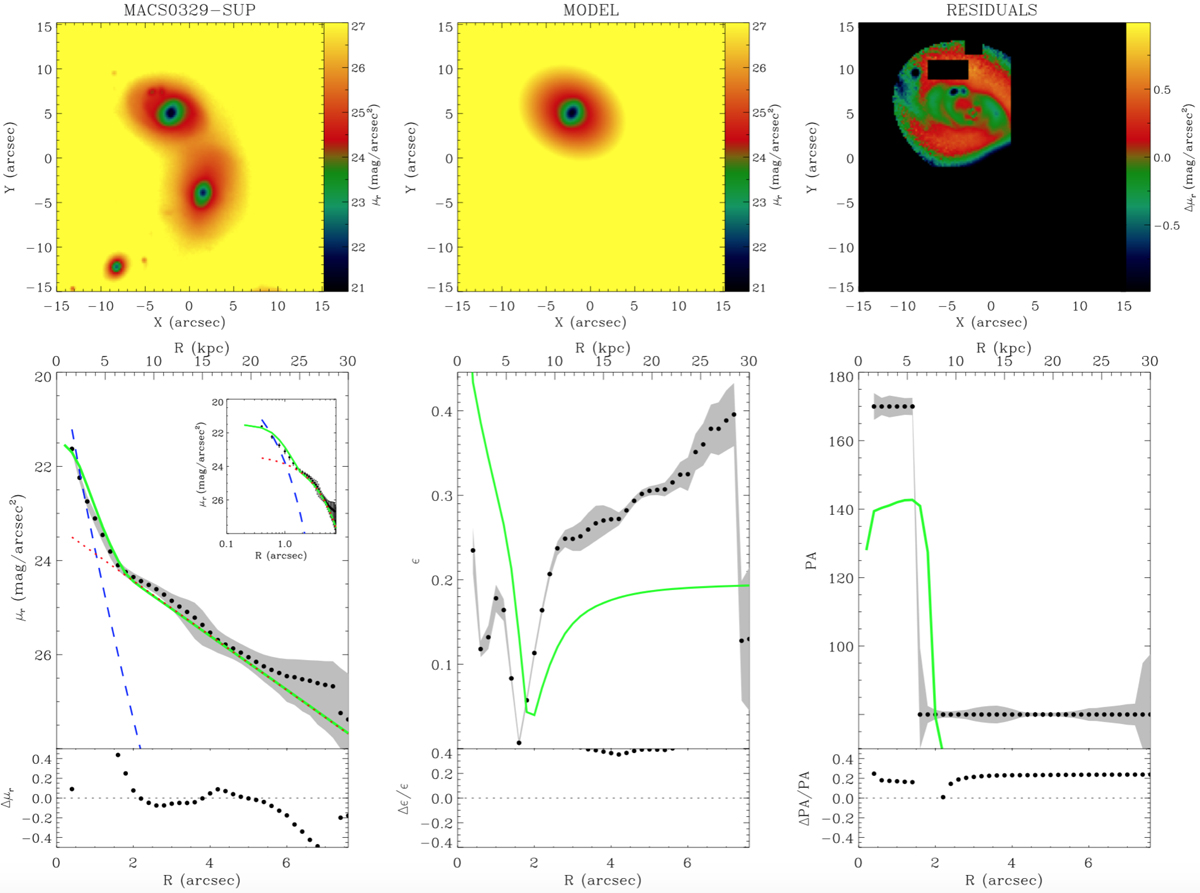
Download original image
Photometric decomposition of BGG1. The image of the region, the model of the galaxy, and the residuals of the subtraction of the model from the image are shown in the upper panels (left, middle, and right panels). In the bottom-left panel, the ellipse-averaged surface brightness radial profile of the galaxy (black dots) and best-fit model (green solid line) are shown. Moreover, the light contributions of the bulge (dashed blue line) and disc (dotted red line) is also presented. The inset shows a zoom to the central regions of the data and the fit using a logarithmic scale for the radial distances. In the bottom-central plot the ellipticity profile and fit are shown, whereas in the bottom-right panel we present the PA profile and fit. The color code of these two last plots is the same as for the bottom-left one.
Current usage metrics show cumulative count of Article Views (full-text article views including HTML views, PDF and ePub downloads, according to the available data) and Abstracts Views on Vision4Press platform.
Data correspond to usage on the plateform after 2015. The current usage metrics is available 48-96 hours after online publication and is updated daily on week days.
Initial download of the metrics may take a while.