| Issue |
A&A
Volume 664, August 2022
|
|
|---|---|---|
| Article Number | A55 | |
| Number of page(s) | 17 | |
| Section | Numerical methods and codes | |
| DOI | https://doi.org/10.1051/0004-6361/202243630 | |
| Published online | 08 August 2022 | |
Two-fluid implementation in MPI-AMRVAC with applications to the solar chromosphere
Centre for mathematical Plasma Astrophysics,
KU Leuven,
3001
Leuven, Belgium
Received:
24
March
2022
Accepted:
8
May
2022
Abstract
Context. The chromosphere is a partially ionized layer of the solar atmosphere, which acts as the transition between the photosphere where the gas is almost neutral and the fully ionized corona. As the collisional coupling between neutral and charged particles decreases in the upper part of the chromosphere, the hydrodynamical timescales may become comparable to the collisional timescale, thus calling for the application of a two-fluid model.
Aims. In this paper, we describe the implementation and validation of a two-fluid model that simultaneously evolves charges and neutrals, coupled by collisions.
Methods. The two-fluid equations are implemented in the fully open-source MPI-AMRVAC code. In the photosphere and the lower part of the solar atmosphere, where collisions between charged and neutral particles are very frequent, an explicit time-marching would be too restrictive, since, to maintain stability, the time step needs to be proportional to the inverse of the collision frequency. This caveat can be overcome by evaluating the collisional terms implicitly, using an explicit–implicit (IMEX) scheme. Out of the various IMEX variants implemented, we focused on the IMEX-ARS3 scheme and we used it for all simulations presented in this paper. The modular structure of the code allows us to directly apply all other code functionality – in particular, its automated grid adaptivity – to the two-fluid model.
Results. Our implementation recovers and significantly extends the available (analytic or numerical) test results for two-fluid chargeneutral evolutions. We demonstrate wave damping, propagation, and interactions in stratified settings, as well as Riemann problems for coupled plasma-neutral mixtures. We generalized a shock-dominated evolution from single to two-fluid regimes and made contact with recent findings on typical plasma-neutral instabilities.
Conclusions. The cases presented here cover very different collisional regimes and our results are fully consistent with related findings from the literature. If collisional time and length scales are smaller than the hydrodynamical scales usually considered in the solar chromosphere, the density structures seen in the neutral and charged fluids will be similar, with the effect of elastic collisions between charges and neutrals shown to be similar to the effects of diffusivity. Otherwise, density structures are different and the decoupling in velocity between the two species increases, and neutrals may, for instance, show Kelvin–Helmholtz roll-up while the charges do not. The use of IMEX schemes efficiently avoids the small time step constraints of fully explicit implementations in strongly collisional regimes. Implementing an adaptive mesh refinement (AMR) greatly decreases the computational cost, as compared to uniform grid runs at the same effective resolution.
Key words: Sun: chromosphere / waves / methods: numerical / instabilities
e-mail: This email address is being protected from spambots. You need JavaScript enabled to view it.
© P. Braileanu and R. Keppens 2022
 Open Access article, published by EDP Sciences, under the terms of the Creative Commons Attribution License (https://creativecommons.org/licenses/by/4.0), which permits unrestricted use, distribution, and reproduction in any medium, provided the original work is properly cited.
This article is published in open access under the Subscribe-to-Open model. This email address is being protected from spambots. You need JavaScript enabled to view it. to support open access publication.
1 Introduction
The solar chromosphere is a very dynamic layer of the solar atmosphere. It forms the transition between the dense photosphere, characterized by a very low ionization fraction and gas pressure that is greater than the magnetic pressure, and the very hot, fully ionized corona dominated by the magnetic fields. In the corona of the quiet Sun, above the transition region located at ≈2.5 Mm, the plasma is fully ionized (O’Flannagain et al. 2015). While a single fluid magnetohydrodynamic (MHD) model for solar plasma fully applies as we reach coronal conditions, the coupling between charged species and the neutrals varies drastically throughout the lower solar atmosphere. Because the density drops with height, the collisional coupling between neutrals and charges decreases. At a high collisional frequency, the plasma behaves like a single fluid, so the high collisional frequency near the photosphere again assures an MHD-like behavior. On timescales that are much smaller than ion-neutral collision time (or, equivalently, on length scales that are much smaller than the mean-free path between ions and neutrals), the ions and neutrals can be considered to be completely decoupled and the two species evolve independently. However, in an intermediate coupling regime, the collisions cannot be neglected. Partial ion-ization effects can also be introduced in a single fluid model through ambipolar diffusion using a generalized Ohm’s law. This approach has been used in many astrophysical contexts for the study of protoplanetary disks (Lesur 2020; Cui & Bai 2021) or molecular clouds (Wurster et al. 2022). A more advanced model for dynamics in partially ionized plasmas must employ a fully two-fluid model, where there are separate time evolution equations for neutrals and charged particles (ions, essentially). This model has also been used in other astrophysical contexts, such as analytical study of shocks in molecular clouds (Draine et al. 1983; Draine & McKee 1993).
In the solar atmosphere, the collision frequency between ions and neutrals drops exponentially with height and falls below the ion cyclotron frequency in the chromosphere, reaching values of 102 s−1 at around 2.1 Mm, just below the transition region (see also Fig. 1 in Khomenko et al. 2014a). Above the transition region, in the corona, the plasma is almost fully ionized, however, the neutrals still play an important role in coronal structures with chromospheric origins such as prominences or spicules. The study of partial ionization effects is of general importance in astrophysics as the collisions between neutrals and charged particles might also have a significant contribution in processes related to accretion disks, interstellar medium, and molecular clouds (see also the review of Soler & Ballester 2022). Here, our aim is to validate a new implementation of the full two-fluid description for plasma-neutral dynamics. A wide variety of previous findings can be used to validate the numerical treatment, from linear wave dynamics to shocked plasma-neutral evolutions.
Analytical studies of waves using a two-fluid approach have shown a damping of the waves due to the interaction between charges and neutrals, which increases when the collision frequency approaches the wave frequency (Zaqarashvili et al. 2011b,a, 2013; Soler et al. 2013a,b; Martínez-Gómez et al. 2016, Martínez-Gómez et al. 2017; Ballester et al. 2018; Popescu Braileanu et al. 2019a,b). A single-fluid approach, where partial ionization effects are introduced through ambipolar diffusion, also showed damping of waves, especially for waves propagating across the magnetic field (Khomenko & Cally 2019; Popescu Braileanu & Keppens 2021). Zaqarashvili et al. (2011b) showed that these two models of charge-neutral wave propagation, namely, a single fluid model with ambipolar diffusion and the two-fluid model, give similar results; while collisions between ions and neutrals are frequent, broad differences appear in a weaker coupling regime. Here, we present wave applications relevant to the solar chromosphere related to these findings. Beyond linear wave applications, studies of shocks in a two-fluid approach have clearly demonstrated shock substructures that do not appear in the single-fluid assumption (Hillier et al. 2016; Snow & Hillier 2019). We recover these findings and also extend them to Riemann problems that already pose numerical resolution challenges in a single-fluid MHD approach.
Depending on the hydrodynamical scales considered, collisions between charges and neutrals might decrease or enhance the growth of instabilities and modify their evolution. Díaz et al. (2012) carried out an analytical study of the classical Rayleigh-Taylor instability (RTI) in a two-fluid approach. This is a linear study where the authors considered a 1D background consisting of a uniform magnetic field and two regions with different uniform densities separated by an interface. A 3D perturbation is applied at the interface. They showed that the linear growth rate obtained can be one or two orders of magnitude smaller compared to the value in the incompressible single-fluid assumption. In simulations of the RTI in a 2.5D geometry, Popescu Braileanu et al. (2021a) also found that the interaction between neutrals and charges decreases the linear growth rate of the instability -a result that is similar to what was found in Díaz et al. (2012). In the nonlinear phase, the incomplete collisional coupling can be seen visually as a decrease in contrast in the snapshot images, compared to a stronger coupling regime (Popescu Braileanu et al. 2021a,b).
Indirectly, the presence of neutrals might decrease the growth of RTI because the density contrast at the interface is smaller when the neutrals are considered. The study of Arber et al. (2007) of flux emergence in a 3D setup compares the case of fully ionized plasma to the case of partial ionized plasma, where the authors included the partial ionized effects through ambipo-lar diffusion. In their simulation, the condition for RTI of having a heavier fluid on top of a lighter one is created consistently by the flux emergence. Arber et al. (2007) showed that in a fully ionized plasma, more chromospheric material is uplifted in the corona, compared to a partial ionized plasma, therefore, the RTI is suppressed when the neutrals are included.
On the other hand, based on a 2D setup in different configurations for the magnetic field, with a component parallel to the direction of the perturbation, Díaz et al. (2014) remarked that neutrals do not experience the stabilizing effect of the magnetic field on the RTI development. Khomenko et al. (2014b) used a single-fluid model with ambipolar diffusion and they found an increase in the growth rate of RTI by 50% in the simulations that included the ambipolar term, as compared to the pure MHD simulations.
The inelastic collisions, related to ionization and recombination processes, might also be important. The neutral fingers resulting from the RTI produced at the interface between a solar prominence thread and corona get ionized at the edges as they enter the much hotter corona (Popescu Braileanu et al. 2021b). Even if ionization and recombination had not played any role in the linear growth of the instability (Popescu Braileanu et al. 2021b), the increase of charged material at the edge of the fingers might impact secondary processes, such as reconnection (Popescu Braileanu et al. 2021c). For completeness, all relevant ionization and recombination terms are implemented as discussed below, but none of the tests presented in this paper includes them; most of the reference results from the recent literature avoid these effects as well.
In the two-fluid simulations of Kelvin-Helmholtz instability (KHI), Hillier (2019a) found that for very short hydrodynamic timescales, all the complex motions are occurring in the neutral fluid that is decoupled from the magnetic field and is not subject to the Lorentz force. At larger scales, the fluids become progressively more coupled. We make use of these KHI simulations, where the use of adaptive mesh refinement (AMR) and different higher order reconstructions are also illustrated.
Besides the many theoretical motivations for developing a two-fluid simulation tool, there are also observational proofs of the decoupling in velocity between neutrals and charges in the solar atmosphere context. The theoretical model of Gilbert et al. (2002) showed that neutrals would slip across the magnetic field in solar prominences, and this has been confirmed by observations (Gilbert et al. 2007). Direct evidence of this decoupling was shown by deducing different velocities from the Doppler shift measured in spectral lines of ions and neutrals observed simultaneously (Khomenko et al. 2015, 2016; Anan et al. 2017; Wiehr et al. 2019). Further evidence of ionneutral decoupling was reported by de la Cruz Rodríguez & Socas-Navarro (2011), who deduced a misalignment in the direction of chromospheric fibrils and the measured magnetic field vector. Solar spicules (especially type II) are also highly dynamic structures which evolve on very small timescales, which might reach the same order of magnitude as the timescale associated with elastic collisions between ions and neutrals. Kuźma et al. (2017) studied solar spicules in a two-fluid approach, but did not find significant differences between the neutral and the charged spicule. Nonetheless, any expected decoupling between neutrals and charges occurs at very small spatial scales and the study of two-fluid effects imposes the need to resolve scales smaller than the mean-free path between ions and neutrals. Therefore, an extremely high resolution is needed for the study of two-fluid effects, which can effectively be met through the use of AMR (Xia et al. 2018). This technique has been used in many astro-physical contexts to dynamically adjust (increase or decrease) the resolution in certain regions of the grid, and can also be inherited from an external library such as PARAMESH (MacNeice et al. 2000). Here, we implement the two-fluid equations as a new physics module in the MPI-AMRVAC1, where a native block-structured AMR is implemented in a robust and efficient manner. By design, this module is then directly useful for 1D, 2D, and 3D applications in Cartesian or other orthogonal coordinate systems (cylindrical and spherical), although we show Cartesian multidimensional setups only in this work.
We present the two-fluid model in Sect. 2. The results obtained from numerical simulations considering very different coupling regimes are given in Sect. 3 and our conclusions are given in Sect. 4.
2 Two-Fluid Model
2.1 Governing Equations
The two-fluid equations implemented in MPI-AMRVAC are (see also Popescu Braileanu et al. 2019a),
 (1)
(1)
 (2)
(2)
 (3)
(3)
![Mathematical equation: $ \matrix{{{{\partial \left( {{\rho _{\rm{c}}}{{\bf{v}}_{\rm{c}}}} \right)} \over {\partial t}} + \nabla \cdot \left[ {{\rho _{\rm{c}}}{{\bf{v}}_{\rm{c}}}{{\bf{v}}_{\rm{c}}} + \left( {{p_{\rm{c}}} + {1 \over 2}{B^2}} \right){\rm{I}} - {\bf{BB}}} \right]}\cr { = {\rho _{\rm{c}}}{\bf{g}} - {{\bf{R}}_{\rm{n}}},}\cr } $](/articles/aa/full_html/2022/08/aa43630-22/aa43630-22-eq4.png) (4)
(4)
![Mathematical equation: $ {{\partial {\rm{e}}_{\rm{n}}^{{\rm{tot}}}} \over {\partial t}} + \nabla \cdot \left[ {{{\bf{v}}_{\rm{n}}}\left( {{\rm{e}}_{\rm{n}}^{{\rm{tot}}} + {p_{\rm{n}}}} \right)} \right] = {\rho _{\rm{n}}}{{\bf{v}}_{\rm{n}}} \cdot {\bf{g}} + {M_n}, $](/articles/aa/full_html/2022/08/aa43630-22/aa43630-22-eq5.png) (5)
(5)
![Mathematical equation: $ \matrix{{{{\partial {\rm{e}}_{\rm{c}}^{{\rm{tot}}}} \over {\partial t}} + \nabla \cdot \left[ {{{\bf{v}}_{\rm{c}}}\left( {{\rm{e}}_{\rm{c}}^{{\rm{tot}}} + {p_{\rm{c}}} + {1 \over 2}{B^2}} \right) - {\bf{B}}\left( {{{\bf{v}}_{\rm{c}}} \cdot {\bf{B}}} \right)} \right.}\cr {\left. { + {{\bf{v}}_{\rm{H}}}{B^2} - {\bf{B}}\left( {{{\bf{v}}_{\rm{H}}} \cdot {\bf{B}}} \right)} \right] = {\rho _{\rm{c}}}{{\bf{v}}_{\rm{c}}} \cdot {\bf{g}} + \eta {J^2} - {M_{\rm{n}}},}\cr } $](/articles/aa/full_html/2022/08/aa43630-22/aa43630-22-eq6.png) (6)
(6)
![Mathematical equation: $ {{\partial {\bf{B}}} \over {\partial t}} + \nabla \left[ {\left( {{{\bf{v}}_{\rm{c}}} + {{\bf{v}}_{\rm{H}}}} \right){\bf{B}} - {\bf{B}}\left( {{{\bf{v}}_{\rm{c}}} + {{\bf{v}}_{\rm{H}}}} \right)} \right] = \eta {\bf{J}}. $](/articles/aa/full_html/2022/08/aa43630-22/aa43630-22-eq7.png) (7)
(7)
The above set of Eqs. (1)–(7) is given for conserved variables: mass densities, momentum, and total energies:
 (8)
(8)
Equations (1)–(7) allow for an external gravitational field with acceleration, g, which appears as a source term at the right hand side (rhs) of the equations. These equations are obtained from the multifluid equations, where three species are considered: ions, electrons, and neutral particles. Furthermore, ions and electrons are combined into the charged fluid with density and pressure, ρc and pc, by assuming that they have the same temperature and that the center of mass velocity of the charges is the ion velocity (Popescu Braileanu et al. 2019a). The collisional source terms Sn, Mn, and Rn on the rhs of Eqs. (1)–(7) are described in Sect. 2.2.
The multifluid equations, obtained by taking moments of Boltzmann’s equation, are closed after the second moment by prescribing the pressures from the ideal equation of state; hence, the pressures are related to internal energy densities via:
 (9)
(9)
The set of equations is closed by further considering Maxwell’s equations. We assumed non-relativistic plasma, where the displacement current is neglected, therefore the current density is defined as J = ▽× B. The charge neutrality assumption makes Poisson’s equation redundant. The condition ▽ · B = 0 can be handled by many different mechanisms in the MPI-AMRVAC code (Keppens et al. 2003; Teunissen & Keppens 2019). Non-ideal contributions to the electric field are the Ohmic resistivity, implemented as a source term and the Hall effect, specified by the Hall velocity:
 (10)
(10)
The resistivity and Hall coefficients, η and νH, respectively, are the input parameters. The tests we consider in this paper all relate to ideal two-fluid charge-neutral settings, where the Hall and resistivity contributions are ignored, namely, η = 0 = νH (although they are implemented here).
The equations in this paper, including Eqs. (1)–(7), are expressed in a non-dimensional unit system, where the magnetic permeability, μ0, the Boltzmann constant, kB, and the hydrogen mass, mH, are absorbed in the units and do not appear explicitly. By defining three characteristic quantities (units), for example, the number density  , temperature
  , and length
  , the units for all other quantities that appear in Eqs. (1)–(7) are calculated as:
 (11)
(11)
The values of  , and
, and  , as well as of μ0, kB, and mH depend on the application considered and the choice of physical unit system, and both “SI” or “cgs” choices are available in MPI-AMRVAC.
The temperature is defined by the ideal equation of state:
 (12)
(12)
We assumed a purely Hydrogen plasma, and together with the charge neutrality assumption, this implies that the non-dimensional mean molecular weights are fixed to μn = 1 and μc = 0.5.
Heat conduction (which would be isotropic for neutrals and anisotropic for charges, as implemented in the code) is neglected for all tests presented in this paper and, hence, it is not listed in the above equations. The adiabatic constant γ is an input parameter. For the tests presented here, it is considered to be γ = 5/3.
2.2 Collisional Coupling Terms
The rhs source terms Sn, Rn, and Mn are balanced exactly between neutral and charged species and encode both elastic collisions and inelastic contributions (through ionization and recombination). The elastic collisions between charges and neutrals include collisions between ions and neutrals and collisions between electrons and neutrals; therefore, the collisional parameter α is defined such that: ρeνen + ρi;νin = ρnρcα, where νen and νin are the collision frequencies between electrons and neutrals and between ions and neutrals, respectively. The collision frequency between particles α and β, as defined by Eq. (A.1) in Appendix A, is different from the collision frequency between particles β and α; ναβ ≠ νβα, but ραναβ = ρβνβα. Because me ≪ mi, we consider that ρi = ρc and we neglect the collisions between neutrals and electrons. This makes the collisional parameter simply α = νin/ρn and its full functional dependence is given by Eq. (A.3). In the expression of the collisional parameter a the number density cancels out and α depends weakly on the plasma parameters, namely, on the square root of the temperature average between neutrals and charges. For this reason, and to ease the comparison with analytical or other results present in the literature, for the cases presented in this paper, we assume α is uniform and constant and its value will vary throughout the simulations.
The inelastic collisions are related to ionization and recombination processes and the functional dependence of the ion-izationand recombination rates Γion, Γrec is given in Appendix by Eqs. (A.5) and (A.4), respectively. None of the tests discussed make use of these inelastic collision terms, but they are implemented and reported here for completeness and for later reference.
Using the above definitions, the collisional terms in the continuity, momentum, and energy equations are:
 (13)
(13)
We note, in particular, how the momentum exchange via elastic collisions scales with the local velocity difference, and how the related energy exchange scales with squared velocity differences and the temperature difference.
2.3 Time Integration Strategy
The collisional terms Sn, Rn, and Mn in the continuity, momentum, and energy equations might be stiff when the collisions are very frequent. For example, the momentum equations, considering only the update due to elastic collisions can be expressed as:
 (14)
(14)
where νin and νni are the collision frequencies between ions and neutrals and between neutrals and ions, respectively, which are equivalently expressed as:
 (15)
(15)
An explicit implementation of the above terms at the rhs of Eq. (14) is stable if the time step is
 (16)
(16)
In the solar atmosphere, the very large densities in the lower photosphere and the lowest part of the chromosphere would impose very small time steps in an explicit implementation. In order to avoid this limitation, the collisional terms are evaluated implicitly, so the overall time-stepping employs an implicit-explicit or IMEX scheme, similarly to Popescu Braileanu et al. (2019a). The modular structure of the MPI-AMRVAC code permits the use of its various, already implemented third, second and first order IMEX schemes. In this paper, we use the IMEX-ARS3 scheme from Ascher et al. (1997).
Within each implicit substep of an IMEX variant, we handled the source evaluations in pairs, and the discussion below has either of the following pairs: U = (ρn,ρc) or U = (ρnvn,ρcvc) and  . The implicit update of the collisional terms is then based on the fact that the source term for ∂U/∂t = P(U) is exactly proportional to the variables, namely, P = Ĵ · U. Because of the weak dependence of the Jacobian matrix, Ĵ, on the variables that evolve in time, Ĵ can be assumed to be a constant during a time step. This linearization in time has been considered in many previous implementations by Smith & Sakai (2008); Tóth et al. (2012); Hillier et al. (2016); Popescu Braileanu et al. (2019a).
In a multistep semi-implicit scheme the implicit update by a partial stepsize βΔt can be expressed as:
 (17)
(17)
where T represents the pair of variables after their explicit update. If Ĵ is assumed constant during the step, taking into account that J21 = −J11, J22 = −J12, Eq. (17) becomes an explicit update:
 (18)
(18)
where
 (19)
(19)
Therefore, the implicit update can be summarized as:
 (20)
(20)
where
 (21)
(21)
In this generic description, the elements of the matrix Ĵ are different for each set of variables: density, momentum, kinetic energy, and internal energy:
Continuity:
 (22)
(22)
Momentum:
 (23)
(23)
Kinetic energy: the same as for the momentum;
Internal energy:
 (24)
(24)
Because of different mean molecular weight for neutrals and charged particles, the Jacobian for the kinetic energy is different to the Jacobian for the internal energy and the update of the total energy considers the update of kinetic and internal energy separately.
Instead of obtaining the analytical solution of the implicit update starting from Eq. (17), Hillier et al. (2016) obtains the analytical solution of the following system of two equations:

leading to:
![Mathematical equation: $ \Delta U = {{{J_{11}}{T_1} + {J_{12}}{T_2}} \over {{J_{12}} - {J_{11}}}}\left\{ {1 - \exp \left[ { - \left( {{J_{12}} - {J_{11}}} \right)\beta \Delta t} \right]} \right\}, $](/articles/aa/full_html/2022/08/aa43630-22/aa43630-22-eq32.png) (25)
(25)
which written in the form defined by Eq. (20) gives
![Mathematical equation: $ f\left( {\beta \Delta t,{J_{12}} - {J_{12}}} \right) = {{1 - \exp \left[ {\left( {{J_{12}} - {J_{11}}} \right)\beta \Delta t} \right]} \over {{J_{12}} - {J_{11}}}}. $](/articles/aa/full_html/2022/08/aa43630-22/aa43630-22-eq33.png) (26)
(26)
The function, f, defined by Eq. (21) is equal to f as defined by Eq. (26) for very small values of the time step Δt. We implemented both variants of the implicit update through the generic function f (βΔt, J12 − but only the form described by Eq. (21) is considered in the tests presented here.
3 Results
In order to test our new implementation of the two-fluid model in MPI-AMRVAC, we ran a large series of test simulations. These are presented below, where we go from standard error quantifications to tests demonstrating the advantages offered by an AMR implementation.
3.1 Linear waves in Uniform Media
We first ran simulations of linear acoustic and Alfvén waves in a uniform medium, similarly to Popescu Braileanu et al. (2019a). We use the splitting strategy as explained in Yadav et al. (2022) and similar to that used by the Mancha3D/Mancha3D-2F code (Felipe et al. 2010), where the equations are solved for (up to nonlinear) perturbations in density, pressure (energy) and magnetic field. We show here the convergence tests of Alfvén waves in a 1.5D domain (the perturbation and gradients are in the z-direction only, but the vectors have two components: x and z), where the values corresponding to the uniform background are:
 (27)
(27)
The domain is between z = 0.5 and z = 2.1. After linearizing the two-fluid equations (see Eq. (36) in Popescu Braileanu et al. 2019a), where only elastic collisions in the momentum equations are considered, and assuming solutions of the following form:
![Mathematical equation: $ \left\{ {{\upsilon _{{\rm{nx}}}},{\upsilon _{{\rm{cx}}}},{B_{{\rm{x1}}}}} \right\} = \left\{ {{V_n},{V_c}{B_1}} \right\}\exp \left[ {i\left( {\omega t - kz} \right)} \right], $](/articles/aa/full_html/2022/08/aa43630-22/aa43630-22-eq35.png) (28)
(28)
the dispersion and polarization relations are:
 (29)
(29)
The above Eq. (29) is Eqs. (38) and (39) from Popescu Braileanu et al. (2019a), now written in non-dimensional units. We chose to have k correspond to five wavelengths in the domain and the amplitude of the velocity of charges being a fraction of 10−3 of the background Alfvén speed, so that the waves are in a linear regime. The analytical solution calculated using these values in the above Eq. (29) is used as initial condition for the simulations. The boundary conditions are periodic. We considered both weak and strong coupling regimes, where we varied from α = 10−1, compared to α = 104.
We show here the results only for the semi-implicit temporal scheme IMEX-ARS3, used in all the other tests presented in the paper. We adopt various combination of flux schemes (TVDLF, HLL) and limiters (minmod, cada3, woodward, mp5). The Butcher table of the IMEX-ARS3 scheme, which shows the explicit updates, as well as the implicit updates during a full time step is (Ascher et al. 1997):
 (30)
(30)
In theory, this IMEX-ARS3 scheme is third order accurate in time (Ascher et al. 1997), meaning that the numerical error introduced in each time step is proportional to Δt3, where Δt is the time step used. This IMEX scheme has in practice three explicit, and two implicit stages.
We first run simulations where we vary both temporal (Δt) and spatial (Δx) resolution by varying the number of points of the domain and letting Δt to be set by the CFL condition. For N ∈ {256,512,1024,2048,4096}, ΔtN ∈ {3.872 × 10⁻³, 1.936 × 10⁻³, 9.68 × 10⁻⁴, 4.84 × 10⁻⁴, 2.42 × 10⁻⁴}, Figure 1 shows the numerical error computed from:
![Mathematical equation: $ {\cal E}\left( N \right) = \mathop {\max }\limits_{i = 1}^N \left| {{u_{\rm{N}}}\left[ i \right] - {u_{{\rm{an}}}}\left[ i \right]} \right|, $](/articles/aa/full_html/2022/08/aa43630-22/aa43630-22-eq38.png) (31)
(31)
as a function of Nmax/N. The variable u considered in the calculation was vcx, where un and uan are the numerical and analytical solution, respectively, calculated at final time tF = 1. Therefore, the error quantified here is the global truncation error (GTE). The temporal GTE is the error accumulated after a (large) number of time steps, which is proportional to 1/Δt, so that for a scheme with order of accuracy p, GTE(Δt) ∝ (Δt)p−1. The expression from Eq. (31), representing the maximum error in the spatial domain, also accounts for the accumulated numerical error due to the spatial discretization. The values of the slopes in Fig. 1 indicate an order of accuracy around 2. We can see that the normally more diffusive “minmod” limiter has a higher convergence rate than the other limiters (“cada3”, “mp5”, “woodward”), but has a larger error. For the same combination of flux schemes and limiters, the error is smaller for smaller values of the coupling parameter α (i.e., our bright green curve lies below the blue curve, just like the brown curve is always below the red). The convergence rate (the slope of the curve) is slightly different for the different values of α, and this rate is slightly larger for the smaller value of α for all the combinations, except for those with a “woodward” limiter, where the convergence rate is slightly smaller for the smaller value of α. We are led to conclude that the error we show in Fig. 1 is dominated by a spatial discretization error (since a finite volume spatial discretization choice with TVDLF/minmod is, at best, of second order) and we try to find the accuracy of the temporal discretization only.
In order to calculate the order of accuracy of the temporal scheme only, we now keep the spatial resolution fixed at N = 4096 and we vary the time step using a sequence which starts with the value determined by the CFL condition and then, successively, we use smaller time steps by dividing the previous one by a factor of 2, that is, we use the sequence Δtj ∈ {2.42 × 10⁻⁴, 1.21 × 10⁻⁴, 6.05 × 10⁻⁵, 3.025 × 10⁻⁵, 1.5125 × 10⁻⁵ } for j ∈ {0,1,2,3,4}. As we found earlier, namely, that the spatial discretization error may dominate, the calculation of the error using the analytical solution might not converge properly. For this reason, we go on to calculate the order of accuracy by using only the successive numerical solutions where the spatial discretization error cancels out. We quantify this order as p, where2:
![Mathematical equation: $ p = {\left\langle {{{\log }_2}\left( {{{\sqrt {\sum {_{i = 1}^N{{\left( {{u_j}\left[ i \right] - {u_{j + 1}}\left[ i \right]} \right)}^2}} } } \over {\sqrt {\sum {_{i = 1}^N\left( {{u_{j + 1}}\left[ i \right] - {u_{j + 2}}{{\left[ i \right]}^2}} \right)} } }}} \right)} \right\rangle _{j = 0,1.2}}. $](/articles/aa/full_html/2022/08/aa43630-22/aa43630-22-eq39.png) (32)
(32)
This also eliminates the differences between the numerical and analytical solution due to nonlinear terms present in the equations solved numerically. Table 1 shows values of p for the same combinations of flux schemes and limiters from Fig. 1. The “minmod” limiter now shows a slower convergence, but the dependence on α is the same as in the previous calculation. The order of accuracy of the temporal scheme is larger than 2, being indeed larger than the order of accuracy of the spatial scheme.
In summary, the tests showed good convergence, on the order of around 2 for the spatial discretization and close to 3 for the temporal discretization, which is consistent with the theoretical estimation. We observed better overall convergence and smaller error for weaker coupling (smaller or, where we varied from α = 10−1, compared to α = 104), similarly to Popescu Braileanu et al. (2019a). In the strong coupling regime presented here (α = 104), if the collisional terms are implemented explicitly, the time step is restricted by the collisions, Δt = 4× 10⁻⁶, being three orders of magnitude smaller than the time step used by a semi-implicit scheme for a resolution of 256 points, making the use of the semi-implicit schemes much more efficient.
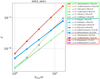 |
Fig. 1 Error calculated as from Eq. (31) as a function of spatial (and temporal) resolution. N represents the number of points used to dis-cretize the domain. The points in the plot correspond to N = 4096 (=Nmax), 2048, 1024, 512, 256. Different combinations of flux schemes (TVDLF, HLL) and limiters (minmod, cada3, woodward, mp5) are shown by different curves, some of them overlap and are grouped as indicated in the legend. |
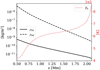 |
Fig. 2 Equilibrium density of charges (black solid line) and neutrals (black dashed line) on the left axis, and temperature on the right axis as a function of height. The equilibrium temperature is the same for neutrals and the charges. |
3.2 Waves Through the Solar Chromosphere
We then ran simulations of waves in a gravitationally stratified atmosphere resembling the solar chromosphere. We constructed a ID gravitationally stratified atmosphere for charges and neutrals. The vertical domain is contained between 0.5 Mm and 2.1 Mm. We used the temperature profile and the number density of neutrals and charges from the VALC model (Vernazza et al. 1981) and numerically integrated the hydrostatic equations. The units chosen for the non-dimensionalization are:  Mm,
Mm,  . The value of the collisional parameter is uniform and constant, and was calculated as a spatial average of the coefficient defined by the expression from Eq. (A.3), and in non-dimensional units it has the value α = 1.3 × 10⁷. The densities drop exponentially with height, thus having different coupling regimes at the bottom and the top of the domain. Figure 2 shows the profiles of densities of neutrals and charges on a logarithmic scale on the left axis and the profile of the temperature on the right axis. Because the scale height is inversely proportional to the mean molecular weight, the scale height of charged particles is twice the scale height of the neutral species, therefore the density of the neutrals drops (twice) faster than that of the charges, this being observed also in the density profiles. We chose a uniform horizontal magnetic field with magnitude of ≈ 15 G, so that the magnetic pressure is equal to the neutral pressure at the middle of the vertical domain, the setup being very similar to the setup described by Fig. 1 of Popescu Braileanu et al. (2019b) for their “S” magnetic field profile. We used the same splitting strategy described in Yadav et al. (2022) where the equilibrium densities, pressure and magnetic field are assumed to obey a split-off (magneto)hydrostatic configuration whose variations with height are given. The vertical domain between 0.5 Mm and 2.1 Mm is covered by a uniform grid of 3200 points.
We then used a driver in the bottom ghost cells to launch a fast magneto-acoustic wave with a period of 5 s. The perturbation represents a full linear eigenfunction in all the variables, according to the local analytical solution. The amplitude of the velocities is equal to a fraction of 10−3 of the sound speed at the base of the atmosphere, so that the waves start in the linear regime. Collisions damp these waves in the upper part of the atmosphere. This can be clearly seen in Fig. 3, showing velocities and horizontal magnetic field perturbation as a function of height. In the ideal MHD approximation, in a stratified atmosphere where density decreases exponentially, the amplitudes of vertical velocity and of the perturbation of the original uniform magnetic field should grow exponentially. We observe this amplitude growth in the lower part of the atmosphere where coupling is strong, but they start to decrease after z ≈ 1.4 Mm. We also observe this decoupling as a difference in velocity of charges and neutrals in the upper part, with slightly larger propagation speed for the charges. Our result is similar to the result obtained by Popescu Braileanu et al. (2019b), namely, shown in panel a of their Fig. 4.
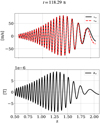 |
Fig. 3 Snapshot of a 1D fast magneto-acoustic wave in a stratified atmosphere (the horizontal z-axis denotes height). Top panel: vertical velocity of charges (solid black line) and neutrals (red dashed line). Bottom panel: perturbation of horizontal magnetic field. |
3.3 Wave Interactions Throughout the Chromosphere
We then considered a 2D case of the above ID wave problem, where the magnetic field is still taken to be uniform, but this time inclined with respect to the vertical direction. Its magnitude was adopted as in the previous ID case. We subsequently launched two fast magneto-acoustic waves with a Gaussian shape and different inclination that would propagate upward and interact throughout the chromosphere. This is the same experiment that was recently considered by Popescu Braileanu & Keppens (2021) in a single fluid MHD approximation, where partial ionization effects were introduced through ambipolar diffusion. We use the same period of 5 seconds, but the amplitude of the wave at the base of the atmosphere is now larger by a factor of 100 than in the previous ID case, such that non-linear effects become important. Our new results, now obtained in the two-fluid approximation, are shown in Fig. 4 and can be directly compared to Fig. 17 from Popescu Braileanu & Keppens (2021). We show velocity components projected perpendicular (top) or parallel (bottom) to the in-plane inclined field, for the neutrals (left) and in terms of decoupling. The neutrals can move across the magnetic field lines, contrary to the charged particles. Thus, the decoupling in velocity between charges and neutrals across the field lines is much larger than the decoupling along the field lines and this can be seen by comparing our top-right panel to our bottom-right panel of Fig. 4.
Even though the results shown in Fig. 4 are at an earlier time that those of Fig. 17 from Popescu Braileanu & Keppens (2021), we can see good agreement for the velocity profiles. The ambipolar diffusion-based simulation described in Popescu Braileanu & Keppens (2021) is actually more affected by numerical dissipation than the current two-fluid cases shown in Fig. 4. This is because the simulation presented here uses AMR with five levels of refinement with a base resolution of 1600 × 400 in zx compared to the one shown in Popescu Braileanu & Keppens (2021), where a uniform grid of resolution 3200 × 800 was used. Thus, the effective resolution (i.e., 25 600 × 6400 for the zx domain) is eight times higher than that considered in Popescu Braileanu & Keppens (2021). The variable used for the dynamic refinement criterion is the perturbation in neutral density, for which an instant is shown in the left panel of Fig. 5. We overplot here the grids and observe that the finer grids are properly located at regions with larger gradient in the neutral density perturbation. The grid adjusts and evolves dynamically, and this aspect is shown in the right panel of Fig. 5, quantifying the grid coverage by the five levels of AMR as a function of time. This grid coverage is such that the sum over all levels always reaches unity, that is, our hierarchical grid covers the entire domain. We can observe that the base level 1 (“L1”) coverage decreases, while level 5 (“L5”) increases during the simulation, having a value close to 0.3 at the end of this simulation. The fact that the coverage for the highest refinement level (“L5”) remains much lower than unity confirms that the refinement is done only in specific regions, where they are needed as specified by our refinement criterion. Therefore, the computational cost of this AMR run is obviously much lower than a uniform grid run with the same cell size as our highest grid level.
3.4 Two-Fluid Shock Tube
Here, we repeat the experiment of the slow two-fluid shock in l.5D geometry done by Snow & Hillier (2019), summarized below. The setup models a shock, which could be produced by reconnection, where the interface of discontinuity is considered to be at the bottom of the physical domain, x = 0. The top of the physical domain is located at x = 4 × 10³. The left and right states of the MHD variables are (Snow & Hillier 2019):
 (33)
(33)
where
 (34)
(34)
The left state is specified in the bottom ghost cells by the boundary conditions. Symmetric boundary conditions imply zero gradient and keep the values of the density, pressure, y-component of the velocity and x-component of the magnetic field the same at the left and the right of the interface of discontinuity. The value of Bx is uniform and constant throughout. For the other variables, the x-component of the velocity and (i-component of the magnetic field at the bottom boundary are antisymmetric. In a 2D setup, this reversal of the magnetic field represents a local current sheet, which is further liable to reconnection. The inflow (x-component) velocity towards the current sheet is zero. In the l.5D setup done here, we only focus on the outcome of the corresponding Riemann problem. The top boundary conditions are symmetric for all the variables.
A MHD uniform setup is generally transformed into a two-fluid setup:
 (35)
(35)
where ξi is the ionization fraction. We used the same value ξi = 0.1 from Snow & Hillier (2019) for this two-fluid setup.
Figure 6 can be directly compared to Fig. 4 of Snow & Hillier (2019) and it shows velocities, By variation, and pressure variation at time t = 2500. Detailed comparison shows a very good agreement. Our figure shows results for a pure MHD run (black solid lines) as they compare to two-fluid runs of different overall resolutions. In this test we demonstrate the effect of resolution and did the test using uniform grids of 8192 and 16384 points. Visually, the solutions for these two resolutions are superposed, except for a small undershoot in the charged fluid horizontal velocity for lower resolution, which is marked in the top-left panel of Fig. 6. We also ran simulations using AMR with a base resolution of 2048 points and four levels of refinement, thus having the same effective resolution as the simulation with 16384 points in a uniform grid. We observe that the AMR and uniform grid results are visually identical, including the undershoot detail shown in our top-left panel. However, the computational cost is of course smaller when refinement is used. The total computational time for the base resolution of 2048 points and four levels of refinement is half that of the case of the uniform grid with 16 384 points: 97.09 s compared to 196.587 s, with both simulations run under the same conditions.
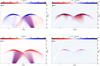 |
Fig. 4 2D waves in stratified atmosphere. Top row: Velocity perpendicular to the magnetic field. Left: neutrals. Right: decoupling (charges– neutrals). Bottom row: velocity parallel to the magnetic field. Left: neutrals. Right: decoupling (charges–neutrals). We note that the limits of the perpendicular (top-right) decoupling and parallel (bottom-right) decoupling are different. |
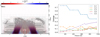 |
Fig. 5 Left: perturbation in the neutral density, where the refinement is shown by overplotting the grids. Right: coverage of the grid by different levels of AMR as a function of time: level 1 (blue), level 2 (orange), level 3 (green), level 4 (red), level 5 (violet). |
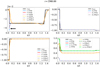 |
Fig. 6 Self-similar solution for the slow MHD and two-fluid shock. Top left: x-velocity; top right: By; bottom left: y-velocity; bottom right: pressure. Comparison between runs with different resolutions: uniform grid with 8192 points (solid lines, labeled “8192p”), uniform grid with 16384 points (dashed lines, labeled “16384”), and AMR with 2048 points base resolution and four refinement levels (dot-dashed labeled “2048p,41”). The quantities corresponding to the charges and the magnetic field are plotted with solid blue (uniform, 8192 points), dashed violet (uniform, 16 384 points) and dash-dotted gray (AMR, 2048 points base resolution, four levels); and for the neutral fluid with solid red (uniform, 8192 points), dashed yellow (uniform, 16 384 points) and dash-dotted orange (AMR, 2048 points base resolution, four levels). The reference MHD quantities are shown with solid black lines. In the bottom left panel the sum of pressures of charged and neutral fluids is also shown as indicated in the legend. The black arrow in the top left panel indicates the only location where the numerical solution changes visibly for a change in resolution. |
3.5 Shock Tube in 1.75D
Collisions affect the scales below the mean free path between neutrals and charges, with their effect being similar to diffusivity for hydrodynamic scales larger than the collisional scale. Here, we test a shock tube problem that already poses a challenge to any modern MHD code, as introduced by Torrilhon (2003) and mentioned in Chap. 20 of Goedbloed et al. (2019), where the authors show that modern shock-capturing discretization converge to a wrong solution for a resolution lower than several 1000 grid points. For larger resolutions, the solutions converge to the true and unique solution containing rotational discontinuities (rather than showing a compound wave structure). The domain is between x = −1 and x = 1.5, is covered by an uniform grid with different resolutions, as specified below. The initial conditions in the MHD approximation are:
 (36)
(36)
where subscripts L and R indicate the regions at the left (x < 0) and right (x > 0) of the interface located at x = 0. The velocities are zero initially. The boundary conditions are symmetric for all the variables. The top panels of Fig. 7 can be compared to Fig. 20.14 from Goedbloed et al. (2019), where we show pure MHD solutions at time t = 0.5, obtained with different resolutions. We can observe that, indeed, the simulation which used a resolution of 800 points does not capture correctly the region around x = −0.25, but a resolution of 4096 points gives results similar to the expected analytic solution of this Riemann problem. Further increasing the resolution to 8192 and 16384 points does not show visible changes in the numerical solution.
We then ran the same test with the two-fluid model, using Eq. (35) and ξi = 0.1 to setup all states initially. Here, we kept the same resolution in all the two-fluid simulations, namely 4096 points, which showed the correct numerical solution in the MHD case, but vary the value of the collisional parameter α. These results are shown in the bottom panels of Fig. 7, along with the reference MHD solution. We observe that for larger values of α the two-fluid solution converges to the MHD solution. For both largest values of α considered here, α = 108 and α = 1064, the two-fluid solution is almost indistinguishable from the MHD solution. For the smaller values of α, α = 102 and α = 104, the two-fluid solution resembles the MHD solution of the run with 800 points, which showed the (erroneous) compound structure. Therefore, in this regime, it seems that the incomplete collisional coupling has the same effect as numerical diffusivity. The mean-free path between charges and neutrals and between neutrals and charges could be approximated by:
 (37)
(37)
with the collision frequencies, vin and vni, defined in Eq. (15), and cs and ca being the sound and Alfvén speed, respectively, calculated using the total pressure and density. For the ionization fraction considered here, the mean-free path between neutrals and charges is larger than that between charges and neutrals. The hydrodynamical scale has the same order of magnitude as the length of the horizontal domain, i.e. Lx = 2.5. For the value of α = 102 the mean free path between neutrals and charged particles is two orders of magnitude smaller than Lx = 2.5, suggesting that neutrals and charges are well coupled. In this regime, the incomplete coupling resembles numerical diffusivity. In weaker coupling regimes, however, the two-fluid solution might be very different from the MHD solution.
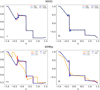 |
Fig. 7 Solution of the 1.75D shock tube problem at time t = 0.5. Top row: MHD reference result with different resolutions: 800 points (dashed red), 4096 points (solid light blue), 8192 points (solid dark blue), 16384 points (dashed black). Bottom row: two-fluid model for different values of the collisional parameter: α = 102 (solid orange), α = 104 (solid red), α = 108 (solid light blue) and α = 1064 (dashed dark blue). The reference MHD solution is also shown with a dotted black line. Left columns: density. For the two-fluid case in the bottom left panel, the sum of densities of neutrals and charges is shown. Right columns: By |
3.6 Shock-Interactions in 2D: Orszag-Tang in Two-Fluid Settings
When the coupling regime is weaker, namely, the collisional scales become similar or larger than the hydrodynamical scales, as the neutrals do not feel the magnetic field, the two-fluid solution might be very different from the MHD solution for both neutrals and charges. In order to see how the code behaves for different regimes of collisional coupling in simulations where 2D shock fronts form spontaneously and interact, we do simulations of the compressible version of the Orszag-Tang test (Orszag & Tang 1979; Picone & Dahlburg 1991). The setup for the MHD approximation on a unit square domain is:
 (38)
(38)
is extended to a two-fluid setup by using Eq. (35) and the ionization fraction ξi = 0.5. We used a base resolution of 5122 and 3 levels of refinement. The variable used in the refinement criterion is the magnitude of the decoupling in velocity. Figure 8 shows snapshots of charged (left) and neutral (right) density for the case of a strongly coupled regime where α = 103, at two different times. At the ionization fraction chosen, the mean-free path between charges and neutrals is the same as the mean free path between neutrals and charges, and for the value α = 103, λin = λni = 5.28 × 10⁻³, much smaller than the length of the domain. We can clearly observe similar structures in neutral and charged densities, even up to the very nonlinear times where islands form due to numerical reconnection on the strong and localized current sheets (see the snapshots at t = 0.9 in Fig. 8). This result is very similar to a pure ideal MHD run.
On the other hand, in a weak coupling regime where we took α = 1 (where the mean-free path becomes λin = λni = 5.28, larger than the length of the domain, albeit of the same order of magnitude), the neutrals and charges evolve very differently and the density maps for both species are also very different than in the pure MHD case. This can be seen in Fig. 9, where the densities of charges and neutrals are shown for the same moments of time as for the previous case. The magnitude of the decoupling in velocity between neutrals and charges is much smaller in the strong coupling regime (α = 103) than in the weak coupling regime (α = 1), as expected and quantified in Fig. 10.
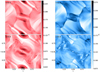 |
Fig. 8 Snapshots of densities for the two-fluid model where α = 103. Left column: charges; right column: neutrals. Top row: t = 0.5; bottom row: t = 0.9. |
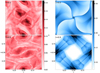 |
Fig. 9 Snapshots of densities for the two-fluid model where α = 1. Left column: charges; right column: neutrals. Top row: t = 0.5; bottom row: t = 0.9. |
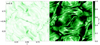 |
Fig. 10 Magnitude of the decoupling in velocity between charges and neutrals. Left: α = 103, right: α = 1. The colormap and the normalization are the same for both images. |
3.7 Corrugation Instability
Unlike the case of the Orszag-Tang test presented earlier, the charged fluid might evolve similarly to the plasma in the MHD assumption, even if the collisional coupling is weak. A very demanding numerical experiment is the simulation of a perturbed 2D MHD slow shock front, leading in most of the cases to the corrugation instability (Stone & Edelman 1995; Snow & Hillier 2021). We use a background medium similar to that used by Snow & Hillier (2021) for parallel shocks. We use subscript 1 for downstream variables (x < 0) and subscript for two upstream variables (x > 0), where we exploit the frame of reference of the shock front, fixed at the location x = 0. Given upstream quantities, we can get downstream quantities from the flux conservation laws, assuming a stationary solution. We use the same values given in Table A1 in Snow & Hillier (2021) for the left and right states with respect to interface of discontinuity. The 2D x−y domain [–1.5,1] × [0,0.1] is covered by 1024 × 256 points as base resolution and we used four levels of refinement. The numerical values for the quantities upstream (2) and downstream (1) are (Snow & Hillier 2021):
 (39)
(39)
This planar shock is perturbed by its encounter with a controlled density perturbation. Therefore, in the initial condition, the density upstream becomes ρ2 + δρ(x, y). This perturbation in the density is located upstream, only in the region 0 < x < 1:
 (40)
(40)
We used the same amplitude A = 1 as Snow & Hillier (2021), so that the simulation enters the non-linear regime from the beginning, while Stone & Edelman (1995) used the value A = 10−4 in order to study the linear phase. In order to avoid non-linear interaction between different modes, we used a single-mode corresponding to one wavelength. The pure MHD result from Stone & Edelman (1995) shows that the instability grows faster for smaller modes. As we used a smaller domain, compared to Snow & Hillier (2021), we expect the instability to grow faster than in their case.
The two-fluid setup is obtained from the MHD setup using Eq. (35) and ξi = 0.9. The value of the collisional parameter is uniform and constant, α = 10. The mean-free path between ions and neutrals, calculated according to Eq. (37), λin ≈ 3.6, is larger than the mean free path between neutrals and ions, λni ≈ 0.4, both being larger than the size of the domain (in the direction y, which is horizontal in Fig. 11), meaning a weakly coupled regime.
Figure 11 shows the numerical results of the fluid density obtained in the MHD assumption (top left panel) and the charged fluid density in the two-fluid approximation (top right panel). The bottom panels show the density (bottom left panel) and the vorticity of the neutrals (bottom-right panel). We observe that the charged fluid in the two-fluid simulation evolves similarly to the MHD case, although some of the structures are smoothed out by collisions. In the neutral fluid (right panels), we notice that secondary Kelvin-Helmholtz instabilities (KHI) form as the perturbation advances towards the negative region of the x-domain. For this reason we plotted the vorticity of the neutrals, and indeed we see non-zero vorticity consistently with the locations where the vortices in the density are observed. Similarly to Snow & Hillier (2021), the neutrals seem to stabilize the corrugation instability and present features as shock channels. Differently from the simulations of Snow & Hillier (2021), we used smaller wavelength of the perturbation, which grows faster, therefore we analyzed the snapshots at an earlier time, while the perturbation was still travelling through the physical domain, producing KHI.
As smaller scales grow faster, we do see small scale corrugation instabilities due to numerical noise appear along the deformed shock front. These secondary instabilities are not seen in the original two-fluid simulations of parallel shocks of Snow & Hillier (2021). As we used very high resolution and no artificial dissipation, we claim these are physically relevant and further consequences of these finest-scale structures could become a subject of further study.
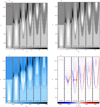 |
Fig. 11 Time sequence for quantities seen in parallel shocks undergoing corrugation instabilities. Top left: density in the MHD simulation. Top right: density of charges in the two-fluid simulation. Bottom left: density of neutrals in the two-fluid simulation. Bottom right: (out-of-plane component of) vorticity of neutrals in the two-fluid simulation. The two-fluid simulation used a value of α = 10. |
 |
Fig. 12 Time evolution of KHI-unstable neutral density in the uncoupled case (α = 0). The flux limiter used is “cada3.” |
3.8 Two-Fluid Kelvin-Helmholtz Evolutions
As stated above, the evolution of the parallel shock corrugation showed KHI in the neutrals. Here, we now turn to pure KHI studies, as done recently in a two-fluid setting. We do simulations of 2D KHI using the same setup as Hillier (2019b). The domain is comprised between –1.5 and 1.5 in the horizontal (aligned with the main shear flow) direction and between –0.75 and 0.75 in the vertical direction. We used AMR with a base resolution of 2048 × 1024 with four levels of refinement, thereby reaching the same effective resolution as the (extremely high resolution) simulations of Hillier (2019b). We used the IMEX-ARS3 as temporal scheme and the HLL method for the calculation of the fluxes (Toro 1997). The condition ∇ · B = 0 is ensured by the parabolic cleaning method (Marder 1987; Keppens et al. 2003) specified by the value “linde” for the parameter typedivbfix. This method adds non-conservative source terms in the induction and charged fluid energy equations, which diffuses the divergence of the magnetic field error at a maximal rate.
The background in the MHD approximation is:
 (41)
(41)
The subscripts 1 and 2 represent the quantities below (y < 0) and above (y > 0) the sharp shear flow interface located at y = 0. The initial magnetic field (like the pressure p) is uniform and has only a horizontal component 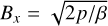 . We then perturb the planar interface with a small (i-velocity, being composed of 32 modes with random amplitude in [–A, A] and phase in
 ![Mathematical equation: $\left[ { - {\textstyle{\pi \over 2}}{\textstyle{\pi \over 2}}} \right]$](/articles/aa/full_html/2022/08/aa43630-22/aa43630-22-eq52.png) , where
, where
 (42)
(42)
This represents a very subsonic and linear, but still somewhat randomized, perturbation. This MHD-like initial condition is then transformed to a two-fluid initial condition by using Eq. (35) and the ionization fraction ξi = 10−2.
The limit of infinite collisional scale is the case when the collisional parameter α = 0. In this fully uncoupled case, only the neutrals will evolve since, for the charges, the scales considered are smaller than the scale where the tension by the magnetic field stabilizes the KHI. Indeed, in the ideal MHD assumption, the horizontal magnetic field suppresses the KHI (see Eq. (205) or Eq. (15) in Chandrasekhar 1961; Hillier 2019b, respectively) if:
 (43)
(43)
Using the values from Eq. (41) in the above Eq. (43), the value of the right hand side is of the same order of magnitude, but slightly smaller than the value of the left hand side and this condition is not fulfilled, so the MHD case is unstable. In the uncoupled case, however, the density of interest should be replaced by the value of the charged fluid density only, and for the very small ionization fraction considered here, the value of the right hand side is then almost two orders of magnitude larger than left hand side. Hence, the magnetic field suppresses the instability in the charged fluid.
Figure 12 shows two snapshots of the neutral density in the non-linear stage of the instability, in the fully uncoupled case. During the non-linear stage of the instability large vortices form because of the inverse cascade, but there is also a direct cascade when smaller scales form mainly due to secondary KHI and (centrifugally induced) Rayleigh-Taylor effects, similar to those seen in Fig. 1 from Hillier (2019b). However, we do not observe such small scale structures as in the simulations of Hillier (2019b). One of the reasons might be the fact that our initial perturbation contains only 32 modes, differently to the white noise perturbation used by Hillier (2019b). However, the detailed evolution of the simulation in the nonlinear phase might be impacted by our choice of the flux limiter: this uncoupled case used a third order limiter (Čada & Torrilhon 2009) (specified by the keyword “cada3” in MPI-AMRVAC).
In order to better understand the impact of the flux limiter, we show results obtained with two different limiters when we study the case with a finite mean free path between charges and neutrals. For this coupled case, we use the value α = 300 as also presented in Hillier (2019b). As we have seen in previous sections, for cases which had similar hydrodynamic scales, this value corresponds to a strong coupling regime. Figures 13 and 14 show the density evolution of neutrals and charges, and the magnitude of the decoupling in velocity between neutrals and charges for third order limiter “cada3” and a fifth order limiter (Suresh & Huynh 1997), specified by the keyword “mp5” in MPI-AMRVAC.
In our AMR runs, the magnitude of the decoupling was used for the refinement criterion and we overplot the grids as well. We observe how the finer grids nicely follow the regions with higher values of the decoupling. The third-order limiter has more numerical diffusivity associated, therefore, there is less detail in the density snapshots corresponding to this simulation. As small scales are influenced by numerical diffusivity, the nonlinear process of merging of smaller scales to larger scales happens faster for the “cada3” limiter than for “mp5.” This can clearly be seen in the earliest snapshots corresponding to t = 4.
The main conclusion of Hillier (2019b) was that at small scales neutrals and charges are decoupled while they are coupled at large scales. In order to quantify the degree of coupling between charges and neutrals for different scales, we plotted the Fourier amplitudes of the (y-velocity. Figure 15 shows the Fourier amplitudes of the (y-velocity for the two limiters “cada3” and “mp5.” The amplitudes are averaged in time between t = 4 and t = 46 and also averaged in the vertical direction, restricted to the region {y|– 0.375 ≤ y ≤ 0.375} shown in the figures. The Fourier modes are shown as a function of the mode number  , where k is the wave number.
For the adopted low-ionization fraction, the mean-free path between neutrals and charges is larger than the mean free path between charges and neutrals, and we calculate the mode number associated with this scale as:
 (44)
(44)
where λni has been defined in Eq. (37). The value obtained ncollni = 145 is shown by a dotted black line, and ncollin = 99 × ncollni does not appear in the plot. We can see in Fig. 15 that the curves corresponding to the neutral and charged fluids overlap for large scales, but diverge for small scales. For the “mp5” limiter, which has smaller numerical diffusivity associated, the decoupling appears at smaller scales than for “cada3.” The largest scales at which the decoupling appears visually for both limiters are smaller than the estimated decoupling scale between neutrals and ions, but larger than the estimated decoupling scale between ions and neutrals, so the result of the numerical simulations are consistent with this theoretical estimation. Similarly to Hillier (2019b), the velocity of charges and neutrals are coupled for large scales and decoupled on the scales smaller than the mean free path between the particles of different species.
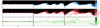 |
Fig. 13 Time evolution for the coupled case. Top row. neutral density; middle row. charged density; bottom row. magnitude of the decoupling in velocity between neutrals and charges. The AMR grid is overplotted in the bottom row plots. The vertical domain is between –0.375 and 0.375, corresponding to the inner half of the full vertical domain. The flux limiter used is “cada3”. |
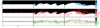 |
Fig. 14 Time evolution for the coupled case. Top row. neutral density; middle row. charged density; bottom row. magnitude of the decoupling in velocity between neutrals and charges. The AMR grid is overplotted in the bottom row plots. The vertical domain is between –0.375 and 0.375, corresponding to the inner half of the full vertical domain. The flux limiter used is “mp5”. |
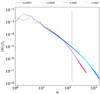 |
Fig. 15 Fourier amplitudes of the y-velocities. The amplitudes are averaged in height between –0.375 and 0.375, the same height shown in Figs. 13 and 14. The vertical dotted black line located at n = 145 corresponds to the mode corresponding to the collision frequency between neutrals and ions, calculated from Eq. (44). For an improved visualization, the upper limit on the x-axis is 512 for “cada3” limiter, and 1600 for “mp5” limiter. Both limiters show decoupling at small scales in the velocity. |
4 Conclusions
We implemented the full two-fluid (charges-neutrals) equations in MPI-AMRVAC, an open-source, versatile code that can be used in many astrophysical contexts. The implementation shares many aspects with the Mancha3D-2F code, described in Popescu Braileanu et al. (2019a), however, the MPI-AMRVAC code offers various advantages, such as being fully dimension-independent (1D, 2D, or 3D), along with the option to use an efficient block-adaptive AMR mesh. The use of an IMEX scheme, with implicit updates for the collisional terms, greatly decreases the computational cost in highly collisional regimes. The modular structure of the code permitted us to use already implemented numerical discretizations (both temporal and spatial) and parallelization algorithms in the two-fluid model and to exploit the AMR. The use of AMR further reduces the computational cost, compared to the uniform grid with the same effective resolution. Many two-fluid codes, such as those in Popescu Braileanu et al. (2019a); Kuźma et al. (2017); Hillier et al. (2016) use uniform grid implementations. We performed many tests of the code, which showed physically sound results and were consistent with regard to comparable results described in the recent literature. The conclusions are summarized below:
Spatial and temporal convergence tests showed that the numerical solution converges to the analytical solution for simulations of Alfvén waves in uniform settings. The numerical error was smaller for smaller coupling parameter α, similarly to results of Popescu Braileanu et al. (2019a). The IMEX-ARS 3 scheme, together with standard shock-capturing discretizations, achieves high-order (second to third order) convergence;
Simulations carried out with our newly implemented module in the MPI-AMRVAC code reproduced and extended previous results on waves, shocks, and instabilities that had first been obtained with other codes;
When the collisional timescales are smaller than the hydro-dynamical timescales (in a well-coupled regime), the effect of the collisions is similar to diffusivity. The collisions can damp waves, similarly to the conclusion of Díaz et al. (2012); Popescu Braileanu et al. (2019b) and decrease the growth of the instabilities (Popescu Braileanu et al. 2021a). We observed a damping of waves and decoupling in velocity in ID (Fig. 3) and 2D (Fig. 4) setups;
The numerical results for the 1.75D Riemann problem (Fig. 7) and the well-coupled Orszag-Tang (Fig. 8) led to the conclusion that the results of the two-fluid approach resemble those obtained in the MHD approach with diffusivity;
For hydrodynamical timescales similar or smaller than the collisional timescales (weakly coupled regime), neutrals and charges might behave differently. For the RTI studied by Díaz et al. (2014) and Khomenko et al. (2014b) the hydro-dynamic scale defined by the scale of magnetic cutoff was below the collisional timescale, therefore, the neutrals, which do not undergo the stabilizing effect of the magnetic field, are unstable at these scales. Our simulations that reproduced the simulations of KHI done by Hillier (2019b), in the absence of collisions, showed that the instability grows in neutrals while the charged fluid did not evolve because of the magnetic field. The simulations of Orszag-Tang test in a weakly coupled regime (Fig. 9) showed structures in the density of neutrals and charges very different to the structures in density obtained in the MHD approximation. However, simulations of the corrugation instability showed structures in the charged fluid similar to the structures in the plasma obtained in the MHD approximation and slightly smoothed out (top panels of Fig. 11). The structures in the neutral fluid were different, and we could observe a secondary KHI (bottom panels of Fig. 11). The fact that we showed a two-fluid setup, where neutrals undergo KHI while charges do not, illustrates the need for two-fluid modeling to find previously unexplored dynamics of particular interest;
Numerical diffusivity makes decoupling between charges and neutrals appear at larger scales (Fig. 15). When exploiting different limiters in the numerical reconstruction procedure, the simulations of KHI can be visually (slightly) different, but its statistical properties are similar. The conclusion from Hillier (2019b) stating that the charges and neutrals are decoupled at small scales yet coupled at large scales, also applies for our simulations;
Two-fluid effects occur at small scales and the use of AMR permits very high resolution at a reasonable computational cost.
Future works would include ionization and recombination effects as well as radiative losses, along with addressing, for instance, the secondary instabilities we observed in the corrugation instability study. For simplicity (and to compare to analytical results or other existing results), the value of the collisional parameter α was kept uniform and constant, however, more realistic simulations should consider its dependence on local plasma parameters, as described by Eq. (A.3). The viscosity and thermal conductivity might also have an important role in the study of waves and instabilities as a mechanism of dissipation and they might be similar to the two-fluid effects in highly collisional regime (Popescu Braileanu et al. 2021b).
Acknowledgements
This work was supported by the FWO grant 1232122N and a FWO grant G0B4521N. This project has received funding from the European Research Council (ERC) under the European Union’s Horizon 2020 research and innovation programme (grant agreement no. 833251 PROMINENT ERC-ADG 2018). This research is further supported by Internal funds KU Leuven, through the project C14/19/089 TRACESpace. The resources and services used in this work were provided by the VSC (Flemish Supercomputer Center), funded by the Research Foundation – Flanders (FWO) and the Flemish Government.
Appendix A Expressions for the Collisional Terms
The implementation is the same as done in Mancha3D-2F code (Popescu Braileanu et al. 2019a), which uses the SI unit system:
 (A.1)
(A.1)
Here, Tαβ = (Tα + Tβ)/2 is the average temperature and maβ = mαMβ/(mα + mβ) is the reduced mass of particles α and β, and Σαβ is the corresponding collisional cross-section.
The general expression for α is then the same as Eq. (A.4) from Popescu Braileanu et al. (2019a), expressed as:
 (A.2)
(A.2)
where mn = mH is the Hydrogen mass. When the collisions with electrons are neglected and considering mi = mn, the above Eq. (A.2) becomes:
 (A.3)
(A.3)
where the collisional cross-section considered here is Σin = 10−19m2. This is the (dimensional) form for α used in all our simulations for this paper.
Expressions for Γion and Γrec as functions of ne and Te are given in Voronov (1997) and Smirnov (2003) and are the same as Eqs. (A.2), (A.1) from Popescu Braileanu et al. (2019a):
 (A.4)
(A.4)
 (A.5)
(A.5)
where  is electron temperature in eV, and constants have the following values: A = 2.91 · 10−14, K = 0.39, and X = 0.232.
Equations (A.3), (A.4), and (A.5) show the calculation of α, Γion, and Γrec in the SI unit system. In MPI-AMRVAC, which uses a convenient non-dimensionalization, the most straightforward implementation was to first transform non-dimensional number densities and temperatures into the physical unit system defined for the simulation (which can be “cgs” or “SI” in MPI-AMRVAC) by multiplying by their units  and
and  and further transform to the SI unit system, if needed. After the calculation, the resulting quantities with physical SI units are again transformed to the unit system of the simulation, then non-dimensionalized by dividing by the corresponding units:
  .
.
References
- Anan, T., Ichimoto, K., & Hillier, A. 2017, A&A, 601, A103 [NASA ADS] [CrossRef] [EDP Sciences] [Google Scholar]
- Arber, T. D., Haynes, M., & Leake, J. E. 2007, ApJ, 666, 541 [Google Scholar]
- Ascher, U. M., Ruuth, S. J., & Spiteri, R. J. 1997, Appl. Numer. Math., 25, 151 [CrossRef] [MathSciNet] [Google Scholar]
- Ballester, J. L., Carbonell, M., Soler, R., & Terradas, J. 2018, A&A, 609, A6 [NASA ADS] [CrossRef] [EDP Sciences] [Google Scholar]
- Cada, M., & Torrilhon, M. 2009, J. Comput. Phys., 228, 4118 [Google Scholar]
- Chandrasekhar, S. 1961, Hydrodynamic and Hydromagnetic Stability, International Series of Monographs on Physics (Clarendon Press) [Google Scholar]
- Cui, C., & Bai, X.-N. 2021, MNRAS, 507, 1106 [NASA ADS] [CrossRef] [Google Scholar]
- de la Cruz Rodríguez, J., & Socas-Navarro, H. 2011, A&A, 527, A8 [Google Scholar]
- Díaz, A. J., Soler, R., & Ballester, J. L. 2012, ApJ, 754, 41 [Google Scholar]
- Díaz, A. J., Khomenko, E., & Collados, M. 2014, A&A, 564, A97 [NASA ADS] [CrossRef] [EDP Sciences] [Google Scholar]
- Draine, B. T., & McKee, C. F. 1993, ARA&A, 31, 373 [NASA ADS] [CrossRef] [Google Scholar]
- Draine, B. T., Roberge, W. G., & Dalgarno, A. 1983, ApJ, 264, 485 [CrossRef] [Google Scholar]
- Felipe, T., Khomenko, E., & Collados, M. 2010, ApJ, 719, 357 [Google Scholar]
- Gilbert, H. R., Hansteen, V. H., & Holzer, T. E. 2002, ApJ, 577, 464 [NASA ADS] [CrossRef] [Google Scholar]
- Gilbert, H., Kilper, G., & Alexander, D. 2007, ApJ, 671, 978 [Google Scholar]
- Goedbloed, H., Keppens, R., & Poedts, S. 2019, Magnetohydrodynamics of Laboratory and Astrophysical Plasmas Physics of Plasmas, 26 (Cambridge University Press) 082902 [Google Scholar]
- Hillier, A. 2019a, Physics of Plasmas, 26, 8 [Google Scholar]
- Hillier, A. 2019b, Phys. Plasmas, 26, 082902 [Google Scholar]
- Hillier, A., Takasao, S., & Nakamura, N. 2016, A&A, 591, A112 [NASA ADS] [CrossRef] [EDP Sciences] [Google Scholar]
- Keppens, R., Nool, M., Tóth, G., & Goedbloed, J. P. 2003, Comput. Phys. Commun., 153, 317 [Google Scholar]
- Khomenko, E., & Cally, P. S. 2019, ApJ, 883, 179 [Google Scholar]
- Khomenko, E., Collados, M., Díaz, A., & Vitas, N. 2014a, Phys. Plasmas, 21, 092901 [Google Scholar]
- Khomenko, E., Díaz, A., de Vicente, A., Collados, M., & Luna, M. 2014b, A&A, 565, A45 [NASA ADS] [CrossRef] [EDP Sciences] [Google Scholar]
- Khomenko, E., Collados, M., Shchukina, N., & Díaz, A. 2015, A&A, 584, A66 [NASA ADS] [CrossRef] [EDP Sciences] [Google Scholar]
- Khomenko, E., Collados, M., & Díaz, A. J. 2016, ApJ, 823, 132 [Google Scholar]
- Kuźma, B., Murawski, K., Kayshap, P., et al. 2017, ApJ, 849, 78 [CrossRef] [Google Scholar]
- Lesur, G. 2020, J. Plasma Phys., 87, 1 [Google Scholar]
- MacNeice, P., Olson, K. M., Mobarry, C., de Fainchtein, R., & Packer, C. 2000, Comput. Phys. Commun., 126, 330 [NASA ADS] [CrossRef] [Google Scholar]
- Marder, B. 1987, J. Comput. Phys., 68, 48 [NASA ADS] [CrossRef] [Google Scholar]
- Martínez-Gómez, D., Soler, R., & Terradas, J. 2016, ApJ, 832, 101 [CrossRef] [Google Scholar]
- Martínez-Gómez, D., Soler, R., & Terradas, J. 2017, ApJ, 837, 80 [CrossRef] [Google Scholar]
- O’Flannagain, A., Brown, J., & Gallagher, P. 2015, ApJ, 799, 127 [CrossRef] [Google Scholar]
- Orszag, S. A., & Tang, C. M. 1979, J. Fluid Mech., 90, 129 [NASA ADS] [CrossRef] [Google Scholar]
- Picone, J. M., & Dahlburg, R. B. 1991, Phys. Fluids B: Plasma Phys., 3, 29 [NASA ADS] [CrossRef] [Google Scholar]
- Popescu Braileanu, B., & Keppens, R. 2021, A&A, 653, A131 [NASA ADS] [CrossRef] [EDP Sciences] [Google Scholar]
- Popescu Braileanu, B., Lukin, V. S., Khomenko, E., & de Vicente, Á. 2019a, A&A, 627, A25 [NASA ADS] [CrossRef] [EDP Sciences] [Google Scholar]
- Popescu Braileanu, B., Lukin, V. S., Khomenko, E., & de Vicente, Á. 2019b, A&A, 630, A79 [NASA ADS] [CrossRef] [EDP Sciences] [Google Scholar]
- Popescu Braileanu, B., Lukin, V. S., Khomenko, E., & de Vicente, Á. 2021a, A&A, 646, A93 [NASA ADS] [CrossRef] [EDP Sciences] [Google Scholar]
- Popescu Braileanu, B., Lukin, V. S., Khomenko, E., & de Vicente, Á. 2021b, A&A, 650, A181 [NASA ADS] [CrossRef] [EDP Sciences] [Google Scholar]
- Popescu Braileanu, B., Lukin, V. S., & Khomenko, E. 2021c, ArXiv e-prints [arXiv:2112.13043] [Google Scholar]
- Smirnov, B. M. 2003, Physics of Atoms and Ions (New York: Springer-Verlag), XIII, 443 [Google Scholar]
- Smith, P. D., & Sakai, J. I. 2008, A&A, 486, 569 [NASA ADS] [CrossRef] [EDP Sciences] [Google Scholar]
- Snow, B., & Hillier, A. 2019, A&A, 626, A46 [NASA ADS] [CrossRef] [EDP Sciences] [Google Scholar]
- Snow, B., & Hillier, A. 2021, MNRAS, 506, 1334 [NASA ADS] [CrossRef] [Google Scholar]
- Soler, R., & Ballester, J. L. 2022, Front. Astron. Space Sci., 9 [Google Scholar]
- Soler, R., Carbonell, M., Ballester, J. L., & Terradas, J. 2013a, ApJ, 767, 171 [NASA ADS] [CrossRef] [Google Scholar]
- Soler, R., Diaz, A. J., Ballester, J. L., & Goossens, M. 2013b, A&A, 551, A86 [NASA ADS] [CrossRef] [EDP Sciences] [Google Scholar]
- Stone, J. M., & Edelman, M. 1995, ApJ, 454, 182 [NASA ADS] [CrossRef] [Google Scholar]
- Suresh, A., & Huynh, H. T. 1997, J. Comput. Phys., 136, 83 [Google Scholar]
- Teunissen, J., & Keppens, R. 2019, Comput. Phys. Commun., 245, 106866 [Google Scholar]
- Toro, E. F. 1997, The HLL and HLLC Riemann Solvers (Berlin, Heidelberg: Springer), 293 [Google Scholar]
- Torrilhon, M. 2003, J. Plasma Phys., 69, 253 [NASA ADS] [CrossRef] [Google Scholar]
- Tóth, G., van der Holst, B., Sokolov, I. V., et al. 2012, J. Comput. Phys., 231, 870 [Google Scholar]
- Vernazza, J. E., Avrett, E. H., & Loeser, R. 1981, ApJS, 45, 635 [Google Scholar]
- Voronov, G. 1997, At. Data Nuclear Data Tables, 65, 1 [NASA ADS] [CrossRef] [Google Scholar]
- Wiehr, E., Stellmacher, G., & Bianda, M. 2019, ApJ, 873, 125 [Google Scholar]
- Wurster, J., Bate, M. R., Price, D. J., & Bonnell, I. A. 2022, MNRAS, 511, 746 [CrossRef] [Google Scholar]
- Xia, C., Teunissen, J., El Mellah, I., Chané, E., & Keppens, R. 2018, ApJS, 234, 30 [Google Scholar]
- Yadav, N., Keppens, R., & Popescu Braileanu, B. 2022, A&A, 660, A21 [NASA ADS] [CrossRef] [EDP Sciences] [Google Scholar]
- Zaqarashvili, T. V., Khodachenko, M. L., & Rucker, H. O. 2011a, A&A, 534, A93 [NASA ADS] [CrossRef] [EDP Sciences] [Google Scholar]
- Zaqarashvili, T. V., Khodachenko, M. L., & Rucker, H. O. 2011b, A&A, 529, A82 [NASA ADS] [CrossRef] [EDP Sciences] [Google Scholar]
- Zaqarashvili, T. V., Khodachenko, M. L., & Soler, R. 2013, A&A, 549, A113 [NASA ADS] [CrossRef] [EDP Sciences] [Google Scholar]
See also Eq. (3) and Table 1 on website: https://www.csc.kth.se/utbildning/kth/kurser/DN2255/ndiff13/ConvRate.pdf
All Tables
All Figures
|
Fig. 1 Error calculated as from Eq. (31) as a function of spatial (and temporal) resolution. N represents the number of points used to dis-cretize the domain. The points in the plot correspond to N = 4096 (=Nmax), 2048, 1024, 512, 256. Different combinations of flux schemes (TVDLF, HLL) and limiters (minmod, cada3, woodward, mp5) are shown by different curves, some of them overlap and are grouped as indicated in the legend. |
| In the text | |
|
Fig. 2 Equilibrium density of charges (black solid line) and neutrals (black dashed line) on the left axis, and temperature on the right axis as a function of height. The equilibrium temperature is the same for neutrals and the charges. |
| In the text | |
|
Fig. 3 Snapshot of a 1D fast magneto-acoustic wave in a stratified atmosphere (the horizontal z-axis denotes height). Top panel: vertical velocity of charges (solid black line) and neutrals (red dashed line). Bottom panel: perturbation of horizontal magnetic field. |
| In the text | |
|
Fig. 4 2D waves in stratified atmosphere. Top row: Velocity perpendicular to the magnetic field. Left: neutrals. Right: decoupling (charges– neutrals). Bottom row: velocity parallel to the magnetic field. Left: neutrals. Right: decoupling (charges–neutrals). We note that the limits of the perpendicular (top-right) decoupling and parallel (bottom-right) decoupling are different. |
| In the text | |
|
Fig. 5 Left: perturbation in the neutral density, where the refinement is shown by overplotting the grids. Right: coverage of the grid by different levels of AMR as a function of time: level 1 (blue), level 2 (orange), level 3 (green), level 4 (red), level 5 (violet). |
| In the text | |
|
Fig. 6 Self-similar solution for the slow MHD and two-fluid shock. Top left: x-velocity; top right: By; bottom left: y-velocity; bottom right: pressure. Comparison between runs with different resolutions: uniform grid with 8192 points (solid lines, labeled “8192p”), uniform grid with 16384 points (dashed lines, labeled “16384”), and AMR with 2048 points base resolution and four refinement levels (dot-dashed labeled “2048p,41”). The quantities corresponding to the charges and the magnetic field are plotted with solid blue (uniform, 8192 points), dashed violet (uniform, 16 384 points) and dash-dotted gray (AMR, 2048 points base resolution, four levels); and for the neutral fluid with solid red (uniform, 8192 points), dashed yellow (uniform, 16 384 points) and dash-dotted orange (AMR, 2048 points base resolution, four levels). The reference MHD quantities are shown with solid black lines. In the bottom left panel the sum of pressures of charged and neutral fluids is also shown as indicated in the legend. The black arrow in the top left panel indicates the only location where the numerical solution changes visibly for a change in resolution. |
| In the text | |
|
Fig. 7 Solution of the 1.75D shock tube problem at time t = 0.5. Top row: MHD reference result with different resolutions: 800 points (dashed red), 4096 points (solid light blue), 8192 points (solid dark blue), 16384 points (dashed black). Bottom row: two-fluid model for different values of the collisional parameter: α = 102 (solid orange), α = 104 (solid red), α = 108 (solid light blue) and α = 1064 (dashed dark blue). The reference MHD solution is also shown with a dotted black line. Left columns: density. For the two-fluid case in the bottom left panel, the sum of densities of neutrals and charges is shown. Right columns: By |
| In the text | |
|
Fig. 8 Snapshots of densities for the two-fluid model where α = 103. Left column: charges; right column: neutrals. Top row: t = 0.5; bottom row: t = 0.9. |
| In the text | |
|
Fig. 9 Snapshots of densities for the two-fluid model where α = 1. Left column: charges; right column: neutrals. Top row: t = 0.5; bottom row: t = 0.9. |
| In the text | |
|
Fig. 10 Magnitude of the decoupling in velocity between charges and neutrals. Left: α = 103, right: α = 1. The colormap and the normalization are the same for both images. |
| In the text | |
|
Fig. 11 Time sequence for quantities seen in parallel shocks undergoing corrugation instabilities. Top left: density in the MHD simulation. Top right: density of charges in the two-fluid simulation. Bottom left: density of neutrals in the two-fluid simulation. Bottom right: (out-of-plane component of) vorticity of neutrals in the two-fluid simulation. The two-fluid simulation used a value of α = 10. |
| In the text | |
|
Fig. 12 Time evolution of KHI-unstable neutral density in the uncoupled case (α = 0). The flux limiter used is “cada3.” |
| In the text | |
|
Fig. 13 Time evolution for the coupled case. Top row. neutral density; middle row. charged density; bottom row. magnitude of the decoupling in velocity between neutrals and charges. The AMR grid is overplotted in the bottom row plots. The vertical domain is between –0.375 and 0.375, corresponding to the inner half of the full vertical domain. The flux limiter used is “cada3”. |
| In the text | |
|
Fig. 14 Time evolution for the coupled case. Top row. neutral density; middle row. charged density; bottom row. magnitude of the decoupling in velocity between neutrals and charges. The AMR grid is overplotted in the bottom row plots. The vertical domain is between –0.375 and 0.375, corresponding to the inner half of the full vertical domain. The flux limiter used is “mp5”. |
| In the text | |
|
Fig. 15 Fourier amplitudes of the y-velocities. The amplitudes are averaged in height between –0.375 and 0.375, the same height shown in Figs. 13 and 14. The vertical dotted black line located at n = 145 corresponds to the mode corresponding to the collision frequency between neutrals and ions, calculated from Eq. (44). For an improved visualization, the upper limit on the x-axis is 512 for “cada3” limiter, and 1600 for “mp5” limiter. Both limiters show decoupling at small scales in the velocity. |
| In the text | |
Current usage metrics show cumulative count of Article Views (full-text article views including HTML views, PDF and ePub downloads, according to the available data) and Abstracts Views on Vision4Press platform.
Data correspond to usage on the plateform after 2015. The current usage metrics is available 48-96 hours after online publication and is updated daily on week days.
Initial download of the metrics may take a while.