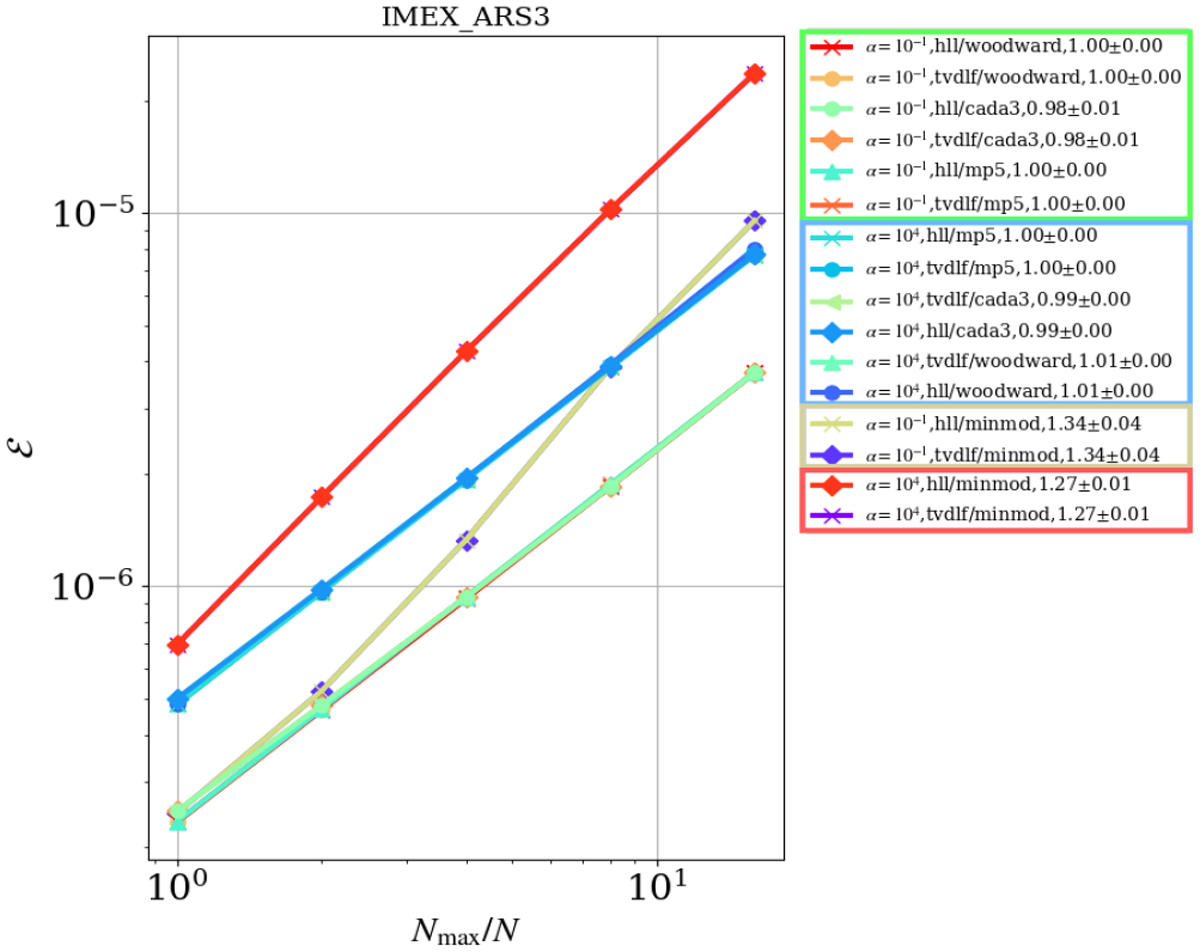
Fig. 1
Download original image
Error calculated as from Eq. (31) as a function of spatial (and temporal) resolution. N represents the number of points used to dis-cretize the domain. The points in the plot correspond to N = 4096 (=Nmax), 2048, 1024, 512, 256. Different combinations of flux schemes (TVDLF, HLL) and limiters (minmod, cada3, woodward, mp5) are shown by different curves, some of them overlap and are grouped as indicated in the legend.
Current usage metrics show cumulative count of Article Views (full-text article views including HTML views, PDF and ePub downloads, according to the available data) and Abstracts Views on Vision4Press platform.
Data correspond to usage on the plateform after 2015. The current usage metrics is available 48-96 hours after online publication and is updated daily on week days.
Initial download of the metrics may take a while.