Open Access
Fig. 5
Download original image
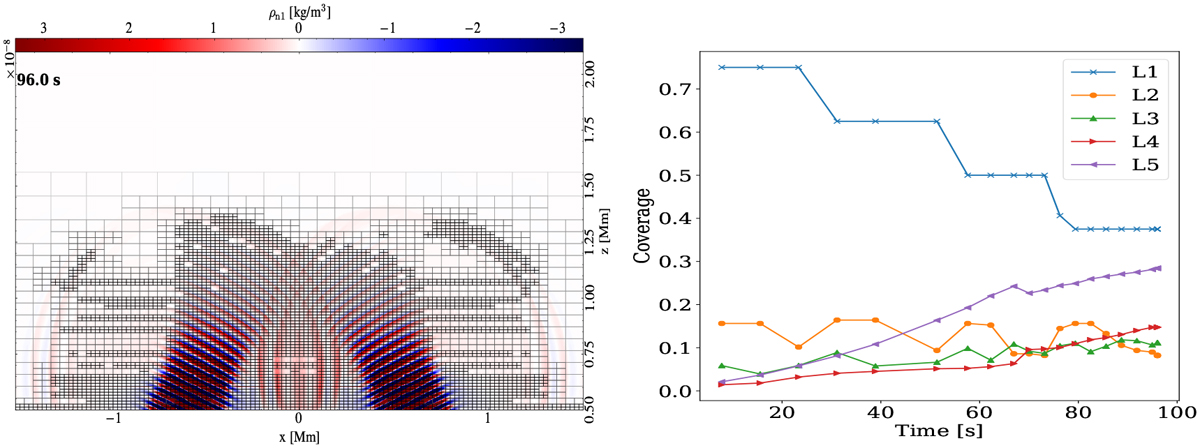
Left: perturbation in the neutral density, where the refinement is shown by overplotting the grids. Right: coverage of the grid by different levels of AMR as a function of time: level 1 (blue), level 2 (orange), level 3 (green), level 4 (red), level 5 (violet).
Current usage metrics show cumulative count of Article Views (full-text article views including HTML views, PDF and ePub downloads, according to the available data) and Abstracts Views on Vision4Press platform.
Data correspond to usage on the plateform after 2015. The current usage metrics is available 48-96 hours after online publication and is updated daily on week days.
Initial download of the metrics may take a while.