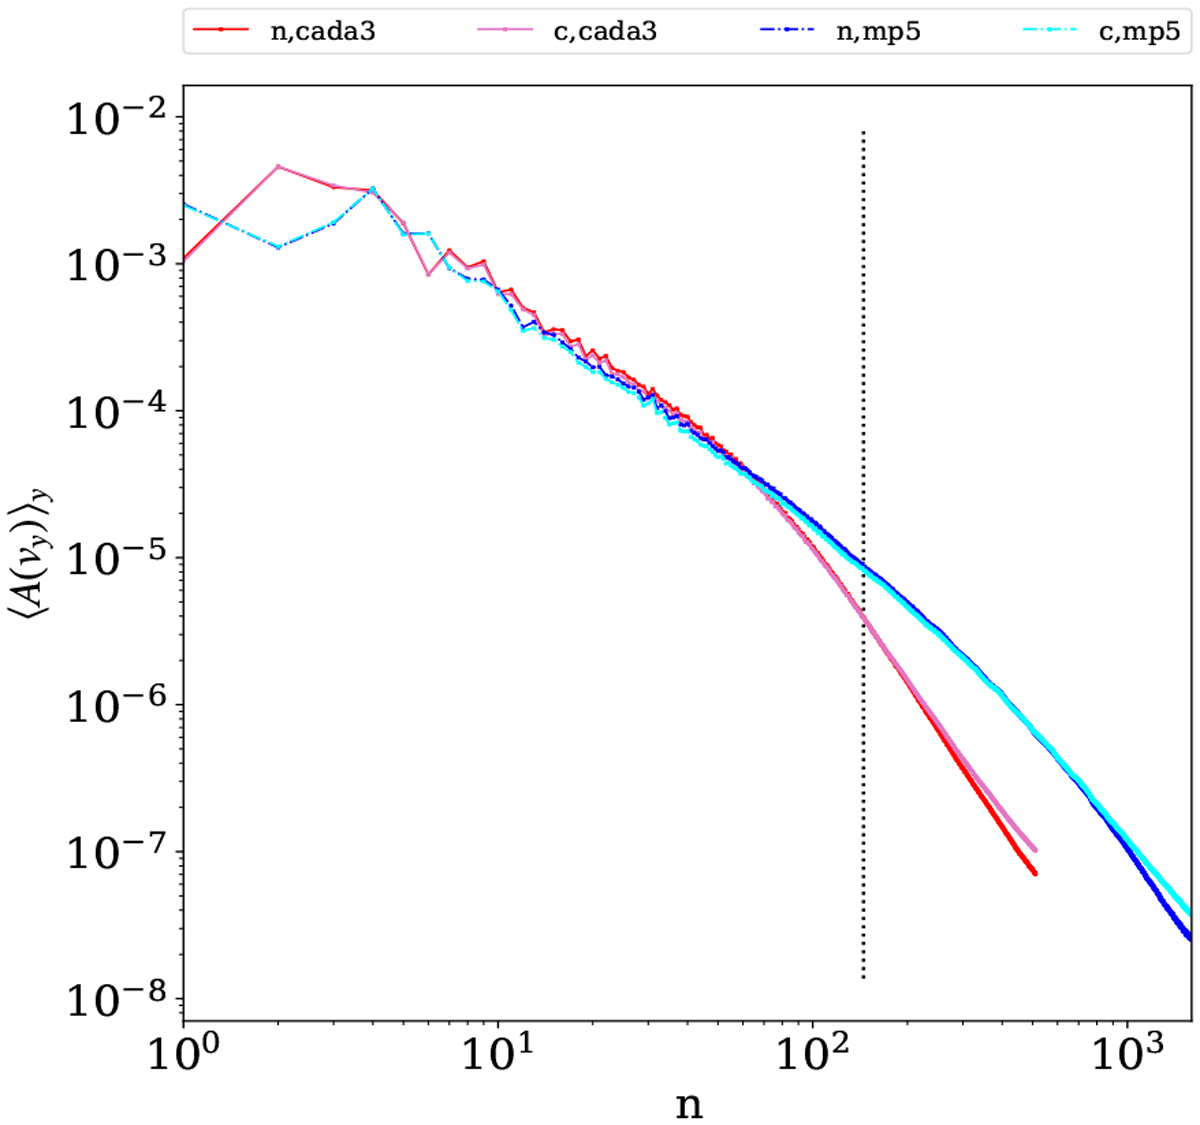
Fig. 15
Download original image
Fourier amplitudes of the y-velocities. The amplitudes are averaged in height between –0.375 and 0.375, the same height shown in Figs. 13 and 14. The vertical dotted black line located at n = 145 corresponds to the mode corresponding to the collision frequency between neutrals and ions, calculated from Eq. (44). For an improved visualization, the upper limit on the x-axis is 512 for “cada3” limiter, and 1600 for “mp5” limiter. Both limiters show decoupling at small scales in the velocity.
Current usage metrics show cumulative count of Article Views (full-text article views including HTML views, PDF and ePub downloads, according to the available data) and Abstracts Views on Vision4Press platform.
Data correspond to usage on the plateform after 2015. The current usage metrics is available 48-96 hours after online publication and is updated daily on week days.
Initial download of the metrics may take a while.