Fig. 14
Download original image
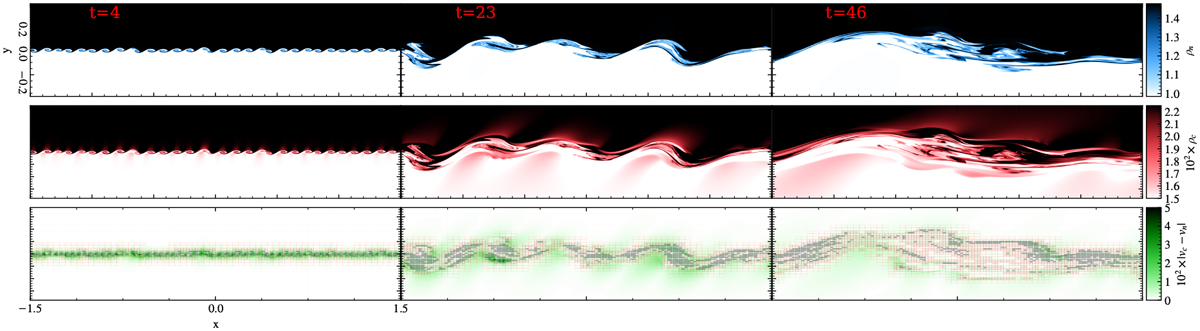
Time evolution for the coupled case. Top row. neutral density; middle row. charged density; bottom row. magnitude of the decoupling in velocity between neutrals and charges. The AMR grid is overplotted in the bottom row plots. The vertical domain is between –0.375 and 0.375, corresponding to the inner half of the full vertical domain. The flux limiter used is “mp5”.
Current usage metrics show cumulative count of Article Views (full-text article views including HTML views, PDF and ePub downloads, according to the available data) and Abstracts Views on Vision4Press platform.
Data correspond to usage on the plateform after 2015. The current usage metrics is available 48-96 hours after online publication and is updated daily on week days.
Initial download of the metrics may take a while.