| Issue |
A&A
Volume 662, June 2022
|
|
|---|---|---|
| Article Number | A78 | |
| Number of page(s) | 17 | |
| Section | Extragalactic astronomy | |
| DOI | https://doi.org/10.1051/0004-6361/202142386 | |
| Published online | 21 June 2022 | |
NuSTAR spectral analysis of three Seyfert galaxies: NGC 3227, NGC 5548, and MR 2251−178
1
Indian Institute of Astrophysics, Bangalore, India
e-mail: This email address is being protected from spambots. You need JavaScript enabled to view it.
2
Pondicherry University, R.V. Nagar, Kalapet, 605014 Puducherry, India
3
Inter University Centre for Astronomy and Astrophysics, Pune, India
4
Cahill Center for Astronomy and Astrophysics, California Institute of Technology, Pasadena, CA 91125, USA
Received:
7
October
2021
Accepted:
28
February
2022
Abstract
Context. The observed nuclear X-ray emission in the radio-quiet category of active galactic nuclei (AGN) is believed to be from a compact region, the corona, which is situated in the vicinity of central supermassive black holes. The shape of the X-ray continuum depends on, among other factors, the temperature of the corona (kTe). The launch of the Nuclear Spectroscopic Telescope Array (NuSTAR) has led to the determination of the high energy cutoff (Ecut), and thereby kTe, in many AGN. In a handful of sources, multiple observations with NuSTAR have also revealed changes in Ecut.
Aims. In this work we aimed to investigate the variation in kTe in three AGN, namely NGC 3227, NGC 5548, and MR 2251−178, using more than one epoch of data on a source from NuSTAR.
Methods. We carried out a spectral analysis of multiple epochs of data acquired using NuSTAR on the three sources, including a few new observations that had not yet been published. By fitting a Comptonization model to the data, we determined the temperature of the corona and investigated changes in kTe, if there were any, in these sources.
Results. In NGC 3227, we found evidence for variation in kTe. We found no correlation of kTe, photon index (Γ), reflection fraction (R), or optical depth (τ) with flux, while τ is found to anti-correlate with kTe. This could be due to more than one physical process at work in the source causing the change in kTe. Conclusive evidence for the variation in kTe is not found in MR 2251−178 or NGC 5548.
Key words: galaxies: active / galaxies: Seyfert / X-rays: galaxies
© ESO 2022
1. Introduction
Active galactic nuclei (AGN) are amongst the most luminous objects (L = 1042–1046 erg s−1; Fabian 1999) in the Universe that emit radiation over a wide range of wavelengths. They are believed to be powered by the accretion of matter onto supermassive black holes (SMBHs; 105–109 M⊙) situated at the centres of galaxies (Rees 1984; Dewangan et al. 2008). The SMBH is generally supposed to be surrounded by an optically thick and geometrically thin accretion disk (Shakura & Sunyaev 1973). The observed X-ray emission from the nuclear region of the radio-quiet category of AGN is believed to be produced by an inverse Compton process; this process is caused by the interaction of the seed ultraviolet (UV) photons from the accretion disk with the thermal electrons in a hot (∼108−9 K) region called the corona, which is situated close to the accretion disk (Haardt & Maraschi 1991; Haardt et al. 1994). This X-ray continuum gets reprocessed in the accretion disk, giving rise to the reflection hump at around 15–30 keV as well as the broad FeKα line at 6.4 keV (George & Fabian 1991; Matt et al. 1993). Soft excess between 0.1–2 keV is ubiquitously observed in Type I AGN (Magdziarz et al. 1998; Fabian et al. 2002; Crummy et al. 2006; Bianchi et al. 2009; Gliozzi & Williams 2020), although the physical origin of this component remains highly debated (García et al. 2019; Xu et al. 2021). Different analyses have shown that a two-temperature Comptonization process agrees well with such a component from either an observational (e.g., Jin et al. 2012; Porquet et al. 2018; Petrucci et al. 2018; Middei et al. 2020; Matzeu et al. 2020) or theoretical (e.g., Różańska et al. 2015; Petrucci et al. 2020; Ballantyne 2020; Ballantyne & Xiang 2020) point of view. Analysis of these spectral features (reflection, FeKα line, soft excess) will help in providing strong constraints on the nature of the X-ray emitting region. From X-ray reverberation studies (Fabian et al. 2009; Zoghbi et al. 2012), the AGN corona is believed to be a compact region situated above the accretion disk, typically within 3–10RG; here, RG is the gravitational radius, defined as RG = GMBH/c2, where MBH is the SMBH mass and G is the gravitational constant. However, there has been a great deal of debate concerning the geometry of the corona. The lamp post is one such possibility, but other models also exist (e.g., Haardt et al. 1994; Done et al. 2012; Petrucci et al. 2013). Also, rapid X-ray flux variability studies (McHardy et al. 2005), the observed small timescales of X-ray eclipses (Risaliti et al. 2005, 2011), and microlensing studies (Chartas et al. 2009) all point to the X-ray corona having a small size, 5–10RG.
The observed shape of the X-ray continuum can be described by a power law with an exponential cutoff (Ecut), and the spectral shape depends on the optical depth (τ), the temperature of the coronal plasma (kTe), the seed photon temperature, and the viewing angle. From a study of the Seyfert galaxy NGC 5548, Petrucci et al. (2000) showed the existence of an approximate relation between Ecut and kTe as Ecut = 2–3kTe. From an analysis of a sample of Seyfert galaxies, Petrucci et al. (2001) found Ecut ≈ 2kTe for an optically thin corona with τ < 1 and Ecut ≈ 3kTe for an optically thick corona with τ > 1. However, by fitting Comptonized spectra simulated using a range of τ and kTe with a power law with an exponential cutoff model, Middei et al. (2019) showed that the commonly adopted relation of Ecut = 2–3kTe is not valid for all values of τ and kTe; it is only valid for low values of τ and kTe.
Observations from high energy X-ray missions such as CGRO (Zdziarski et al. 2000; Johnson et al. 1997), BeppoSAX (Nicastro et al. 2000; Dadina 2007), INTEGRAL (Malizia et al. 2014; Lubiński et al. 2010, 2016; Ricci et al. 2011), Swift-BAT (Vasudevan et al. 2013b; Ricci et al. 2017), and Suzaku (Tazaki et al. 2011) have shown that the coronae in Seyfert galaxies have a wide range of temperatures, with Ecut ranging from 50–500 keV. However, observations from those missions are limited to bright and nearby sources. Thus, it is very clear that it took a great deal of effort to measure Ecut in the X-ray spectra of several AGN. However, a major transformation in the study of the Comptonization spectrum of AGN – determining Ecut from an epoch of observation – occurred after the launch of the Nuclear Spectroscopic Telescope Array (NuSTAR; Harrison et al. 2013) in the year 2012, owing to its broad spectral coverage of 3–79 keV and its high sensitivity beyond 10 keV. Since the launch of NuSTAR, Ecut values have been obtained for many AGN (Fabian et al. 2017; Tortosa et al. 2018; Rani & Stalin 2018a,b; Rani et al. 2019; Lanzuisi et al. 2019; Baloković et al. 2020; Reeves et al. 2021; Kang et al. 2021). Importantly, in addition to the determination of Ecut values (and thereby the constraining of kTe), there are also reports of variation in the Ecut values that point to variations in kTe in a few sources.
For example, in seven sources, namely MCG-5-23-16 (Zoghbi et al. 2017), 3C 382 (Ballantyne et al. 2014), NGC 4593 (Ursini et al. 2016), NGC 5548 (Ursini et al. 2015), Mrk 335 (Keek & Ballantyne 2016), NGC 3227, and SWIFT J2127.4+5654 (Kang et al. 2021), variations in the Ecut values are available in the literature. Recently, from a reanalysis of the NuSTAR spectra of five sources using a model-independent approach, Zhang et al. (2018) confirmed the Ecut variation in three of the five sources, namely 3C 382, NGC 5548, and Mrk 335. Most of these inferences were based on variations in Ecut obtained from phenomenological model fits to the data. However, to determine changes in kTe, it is imperative to fit physical models to the data because, as has recently been learned, the relation Ecut = 2–3kTe does not always hold true (Middei et al. 2019). Therefore, it is imperative to fit physical model fits to the observed spectra to get kTe. Though Ecut is known to vary, we do not yet know the causes for its variation. Despite that, it is important to increase the number of sources that show variation in the temperature of the corona. This is now achievable owing to the multiple epochs of observation available for a large number of AGN in the NuSTAR archives1. The primary motivation here is, therefore, to increase the number of known AGN that show variation in kTe. We are in the process of a careful and systematic investigation of kTe variation in a large number of AGN. Here, we present the results from the multi-epoch spectral analysis of three AGN, namely NGC 3227, NGC 5548, and MR 2251−178. This paper also includes a few new observations that had not been published.
NGC 3227, at a redshift of z = 0.004 and powered by a black hole of mass 4.79 × 10⁶ M⊙ (Bentz & Katz 2015), has been extensively studied in the X-ray band. Signatures of warm absorbers are evident in this source from observations with ASCA (Netzer et al. 1994; George et al. 1998), ROSAT (Komossa & Fink 1997), and XMM-Newton (Markowitz et al. 2009). In the XMM-Newton observations, the FeKα line was evident (Markowitz et al. 2009). It has also recently been studied for flux variations by Lobban et al. (2020), who combined XMM-Newton and NuSTAR observations. It has complex absorption features, which are also variable (Turner et al. 2018). Recently, Mehdipour et al. (2021) reported the broadband spectral modelling of the source using multi-wavelength data from XMM-Newton, NuSTAR, and the Hubble Space Telescope. NGC 5548 is a galaxy located at z = 0.017 with a black hole of mass of 5.0 × 10⁷ M⊙ (Bentz & Katz 2015). It has been extensively studied in the X-ray band via data from various satellites and has also been found to be strongly absorbed in soft X-rays (Cappi et al. 2016; Ursini et al. 2015; Mehdipour et al. 2015; Kaastra et al. 2014). MR 2251−178, with a black hole mass of 2.0 × 10⁸ M⊙ (Wang et al. 2009), was first discovered thanks to its strong X-ray emission (Ricker et al. 1978) and has been found to be a low redshift AGN at z = 0.06 (Bergeron et al. 1983). From Very Large Array observations, Macchetto et al. (1990) found the source to show weak radio emission with an elongated morphology, resembling a FRI (Fanaroff-Riley Class I) source. Details of the observations and reduction of the data are presented in Sect. 2, analysis is presented in Sect. 3, and results and a discussion are presented in Sect. 4, followed by a summary in the final section.
2. Observations and data reduction
We reduced NuSTAR data in the 3–79 keV band using the standard NuSTAR data reduction software NuSTARDAS2, which is distributed by HEASARC within HEASoft v6.29. Considering the passage of the satellite through the South Atlantic Anomaly (SAA), we selected SAACALC ‘2’ and SAAMODE ‘optimized’ and excluded the tentacle region. The calibrated, cleaned, and screened event files were generated by running the nupipeline task using CALDB release 20210701. To extract the source counts, we chose a circular region of radius 60 arcsec centred on the source. Similarly, to extract the background counts, we selected a circular region of the same radius away from the source on the same chip to avoid contamination from source photons. We then used the nuproducts task to generate energy spectra, response matrix files, and auxiliary response files for both of the hard X-ray detectors housed inside the corresponding focal plane modules, FPMA and FPMB. For spectral analysis, using XSPEC version 12.12.0 (Arnaud 1996), we fitted the background subtracted spectra from FPMA and FPMB simultaneously (without combining them), allowing the cross-normalization factor to vary freely during spectral fits. The spectra were binned to have a S/N greater than 5 in each spectral channel using the NuSTAR-specific Python script snrgrppha3. To get an estimate of the model parameters that best describe the observed data, we used the chi-squared (χ2) statistics, and for calculating the errors in the model parameters we used the χ2 = 2.71 criterion (i.e. 90 per cent confidence range) in XSPEC.
3. Analysis of the data
For a few epochs of the sources studied in this work, we do have observations in the soft band from telescopes such as XMM-Newton for NGC 3227, XMM-Newton and Chandra for NGC 5548, and XMM-Newton for MR 2251−178. However, for this work we decided to use only NuSTAR data as (a) the good sensitivity of NuSTAR over the 3–79 keV energy band captures all the key reflection features of an AGN spectrum and, as the main goal of this work is to model the high energy rollover of the Comptonized spectra, we did not want the absorption in the soft band affecting our analysis in the determination of kTe, and (b) observations in the soft band are not available simultaneous to the NuSTAR observations for all the epochs and for all the sources. However, we note here that the inclusion of soft X-ray data in the fitting might have an effect on the photon index (Γ) obtained from using the NuSTAR data alone. The simplest approach to constraining kTe (which is the aim of this work) is the use of only NuSTAR data, but to better constrain the other physical characteristics of the sources, broadband spectral analysis that includes data from the UV band to the hard X-ray band is more appropriate. While analysing only NuSTAR data, we ignored the 3–4 keV band to limit the effect of absorption, if any, and did not consider data in the energy range beyond 60 keV due to a lack of source photons. Thus, we carried out spectral fits to the NuSTAR data in the 4−60 keV energy band for all the observation IDs (ObsIDs) except for epoch I of NGC 3227, epoch F of NGC 5548, and epoch E of MR 2251−178. Due to the unavailability of photons beyond 50 keV, we restricted the spectral fit in the 4–50 keV energy band to the epoch I and epoch E spectra of NGC 3227 and MR 2251−178, respectively. Similarly, for the epoch F spectrum of NGC 5548, we used the FPMA/FPMB data in the 4–55 keV range (see Fig. 1).
 |
Fig. 1. Unfolded spectra of the nine observations for NGC 3227 (left), six observations for NGC 5548 (middle), and five observations for MR 2251−178 (right) fitted with a simple power law. Bottom panels: ratio of the observed spectra to the model. For clarity, we used only FPMA data. The spectra are re-binned for visualization purposes only. |
3.1. Phenomenological spectral fits
For our spectral fits, to model the line of sight galactic absorption, the value of the neutral hydrogen column densities (NH) for all the sources were frozen to the values obtained from Willingale et al. (2013). These NH values are given in Table 1. Similarly, the redshifts of the sources were frozen to the corresponding values given in Table 1. Also, we used the solar abundances from Wilms et al. (2000) and the photoelectric cross-sections from Verner et al. (1996). For models that require an inclination angle (i), we used i = 50° for NGC 3227 (Schmitt et al. 1997; Alonso-Herrero et al. 2019; Middleton et al. 2016), i = 30° for NGC 5548 (Ursini et al. 2015), and i = 60° (i.e. the default value) for MR 2251−178.
Details of the sources analysed in this work.
3.1.1. Absorbed power law
Firstly, to understand the continuum emission in our sample of sources, we fitted the observed X-ray spectra with the baseline phenomenological absorbed power law model that has the following form in XSPEC:
 (1)
(1)
The first component of this model is the constant used to calibrate the two focal plane modules of NuSTAR. The second component, TBabs (Wilms et al. 2000), was used to model the line of sight galactic absorption. The parameters that were kept free are Γ and the normalization (i.e. photons in keV−1 cm−2 s−1). We found evidence of intrinsic absorption present in the lower energy end for all the epochs in NGC 5548, epochs G, H, and I in NGC 3227, and epoch E in MR 2251−178. We therefore included a zTBabs component with the absorbed power law model to fit their spectra, and the model appears as
 (2)
(2)
in XSPEC. For all epochs in NGC 5548, two epochs in NGC 3227, and one epoch of MR 2251−178, the non-inclusion of zTBabs returned a poor fit, with χ2/d.o.f. larger than 1.2. Inclusion of zTBabs with NH(zTBabs) kept free improved the fit, with χ2/d.o.f. close to unity.
From the residual spectra obtained from the simple absorbed power law model fit to the observations, we noticed the presence of the fluorescent FeKα line in NGC 3227, NGC 5548, and in epoch D spectra of MR 2251−178, but in the other observations of MR 2251−178 the residual spectra do not show a conspicuous FeKα line. The spectral fits are shown in Fig. 1 for NGC 3227, NGC 5548, and MR 2251−178. Though this line is common in most of the X-ray spectra of AGN (Mushotzky et al. 1993; Nandra et al. 2007; Della Ceca et al. 2010), there are exceptions (Bhayani & Nandra 2011). The apparent non-detection of a FeKα line in the spectra of MR 2251−178 could be due to a weaker reflection that is a result of a larger viewing angle (Bhayani & Nandra 2011), low signal-to-noise ratio spectra, a very high-ionized accretion disk (Ross & Fabian 1993; Zycki & Czerny 1994), or a combination of all three. However, the presence of a weak FeKα line in epoch D of MR 2251−178 could point to the physical characteristics of MR 2251−178 being different from those of the other two sources. A thorough analysis is needed to know the exact reasons for the absence or weakness of this line, but this issue is beyond the scope of this work; here we are mainly interested in the changes in the temperature of the corona. To model the FeKα line seen in the residual spectra in NGC 3227 and NGC 5548 and in one observation (epoch D) of MR 2251−178, we included a Gaussian component; with this inclusion, the model takes the form const*TBabs(zpo + zgauss), and the quality of the fit improved.
After the inclusion of a Gaussian component with the power law in the case of NGC 3227, in all nine epochs the χ2 value in the range between 60 and 242 was reduced, for a reduction of 2 d.o.f. In epochs C, D, G, and I, non-inclusion of the Gaussian component resulted in a reduced χ2 of more than 1.30. After the inclusion of the Gaussian component, the reduced χ2 ranged between 1.04−1.16 in these epochs. For the other epochs, the χ2/d.o.f. was > 1.1 before, and it became ∼1.0 after the line inclusion. For MR2251−178, a Gaussian component was used to fit the FeKα line only in epoch D. Inclusion of the line component led to a change in χ2 of 5 for a reduction of 2 d.o.f. This negligible change in χ2 over 2 d.o.f. did not improve the fit quality significantly in this case. For NGC 5548, upon the inclusion of a Gaussian line component in all the epochs, the value of the χ2 reduced in the range 23–105, for a reduction of 2 d.o.f. Just an absorbed power law fit to the data produced a reduced χ2 of greater than 1.2 for epochs C, D, E, and F. Adding the Gaussian with the power law led to a reduced χ2 of ∼1.1 for epochs C and D and ∼1.0 for epochs E and F. Similarly, for epochs A and B, the χ2/d.o.f. changed from 1.10 to 1.06 and 1.02 to 0.97, respectively. The width of the FeKα line was frozen to the value of 0.1 keV during the fitting, and leaving it free to vary did not improve the fit significantly. The best-fit parameters for the sources are given in Tables 2–4 for NGC 3227, MR 2251−178, and NGC 5548.
Results of the fit to the spectra of NGC 3227.
3.1.2. Pexrav
In the residuals of the simple power law fit to all the spectra of the sources (see Fig. 1), we found the signature of a high energy turnover and a reflection hump beyond 15 keV. To appropriately model both the high energy cutoff and the reflection feature present in the spectra, we replaced the zpo component in our earlier model with pexrav; the new model has the form
 (3)
(3)
While modelling the reflection component of NGC 5548, the epoch G, H, and I spectra of NGC 3227, and the epoch E spectrum of MR 2251−178, an intrinsic absorption component, zTBabs, was added with the above model. The intrinsic hydrogen column density, NH(zTBabs), was kept free during the fit.
This model implements both photoelectric absorption and Compton scattering; however, it does not include fluorescence. Therefore, to model the FeKα line seen in the residual spectra in NGC 3227, NGC 5548, and epoch D in MR 2251−178, we included a Gaussian component. So, the model takes the form
 (4)
(4)
in XSPEC. The model pexrav improved the fitting compared to zpo, as evidenced by the reduced χ2 in Tables 2–4. This model includes primary emission that has a power law form with an exponential cutoff and a reflection component. The reflector is considered to be an optically thick medium in an infinite plane geometry that covers a larger fraction of the X-ray source. A parameter that comes as an output in the model fit is the reflection parameter, R. This parameter gives a measure of the reflection component present in the observed spectra of the sources. For an isotropic source, this parameter is related to the solid angle (Ω) as R ∼ Ω/2π, and it is dependent on the angle of inclination (i) between the perpendicular to the accretion disk and the line of sight to the observer. The width of the FeKα line was fixed at 0.1 keV, and leaving the parameter free did not improve the fit. For all the sources, the parameters that were left free in the model fits are Ecut, Γ, R, and normalization.
Using (pexrav+zgauss) in all nine epochs of NGC 3227, the χ2 was reduced in the range between 4 and 161 for a reduction of 2 d.o.f. compared to the (zpo+zgauss) fit. In MR 2251−178, the reduction in χ2 is in the range between 0 and 22, with a reduction of 2 d.o.f. For all six epochs in NGC 5548, the (pexrav+zgauss) fit produced a reduction in the χ2 values between 9−60, with a reduction of 2 d.o.f. compared to (zpo+zgauss). The best-fit parameters are given in Tables 2–4.
3.2. Physical model fits
Accretion disk reflection features in the form of a narrow FeKα line was conspicuously present in the residuals of NGC 3227, NGC 5548, and epoch D spectra of MR 2251−178, and the line was modelled using a Gaussian component in pexrav model fits. For MR 2251−178 we have seen signatures of reflection (though weak) in a few epochs. This is evident from the best-fit values of the reflection fraction obtained using pexrav (see Table 3) and in the residuals of the zpo model fits (see Fig. 2, top panel). We therefore modelled the spectra of the sources with the self-consistent ionized reflection model xillver (García & Kallman 2010; García et al. 2013). The emergent reflected spectrum from the surface of the X-ray illuminated accretion disk is calculated in the model by solving the equations of radiative transfer, energy balance, and ionization equilibrium in a Compton thick plane parallel medium (García et al. 2013). The model fit to the spectra has the following form in XSPEC,
 (5)
(5)
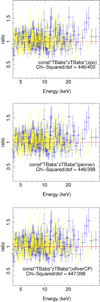 |
Fig. 2. Ratio of data to model for the model fits const*TBabs*zTBabs*(zpo), const*TBabs*zTBabs*(pexrav), and const*TBabs*zTBabs(xillverCP) to the FPMA (blue dot) and FPMB (yellow dot) spectra of ObsID 90601637002 of MR 2251−178. We re-binned the spectra for visualization purposes only. |
Results of the model fits to the spectra of MR 2251−178.
Here also, to account for the effect of intrinsic absorption, zTBabs was used for all epochs of NGC 5548, three epochs (G, H, and I) of NGC 3227, and epoch E of MR 2251−178. The intrinsic hydrogen column densities, NH(zTBabs), were kept as free parameters. In this model fit, the parameters describing the properties of the corona, such as Γ, Ecut, and R, were made to vary, while the inclination angle was frozen to the value of 50° for NGC 3227, 30° for NGC 5548, and 60° for MR 2251−178. The other parameter that was kept free was the normalization. To account for a fair comparison between the Ecut values obtained from pexrav and xillver, the reflector was assumed to be neutral (i.e. log ζ = 0 erg cm s−1). Also treating the ionization as a free parameter returned results consistent with the ones obtained using log ζ = 0 erg cm s−1. The value of the Fe abundance was fixed to the solar value. The results of the model fits are given in Tables 2–4. Fitting the spectra using xillver yielded values of Ecut similar to those obtained using pexrav, although the errors in the Ecut measurements using xillver are relatively small.
Results of the model fits to the spectra of NGC 5548.
As we are interested in the determination of kTe and its variation, we decided to use the thermal Comptonization model xillverCP (García et al. 2014). This model, which takes the emission lines into account by assuming they originate from disk reflection, includes the Comptonization model nthcomp (Zdziarski et al. 1996; Życki et al. 1999) plus the ionized reflection model xillver (García & Kallman 2010; García et al. 2013). The model fit to the spectra has the following form in XSPEC:
 (6)
(6)
We used xillverCP to model the primary continuum and the reflection spectrum simultaneously. Also, to address the intrinsic absorption present in the spectra of all epochs of NGC 5548, epochs G, H, and I of NGC 3227, and epoch E of MR 2251−178, the zTBabs component was added with the described model. The results of the model fits are given in Tables 2–4.
4. Results and discussion
We aimed to find changes of kTe in NGC 3227, NGC 5548, and MR 2251−178. We discuss below the results obtained for each.
4.1. NGC 3227
NuSTAR observed this source nine times between November 2016 and December 2019. Of these, results for seven epochs were reported by Kang et al. (2021), who were able to constrain Ecut in three epochs using phenomenological fits and kTe in two epochs using physical model fits. Here, we report results for two additional epochs and for all nine epochs; we used both phenomenological and physical model fits to model the spectra.
Ratios of the model const*TBabs(zpo + zgauss), const*TBabs(pexrav + zgauss), and const*TBabs(xillverCP) fits to the observed FPMA and FPMB spectra carried out on ObsID 60202002002, the one with the longest exposure time, are shown in Fig. 3. A weak FeKα line is present in all the ObsIDs, and therefore in the const*TBabs(zpo) and const*TBabs(pexrav) model fits we included a zgauss component to account for the line. All the above models could fit the spectra of all epochs of NGC 3227 reasonably well except for epochs G, H, and I, where the χ2/d.o.f. was greater than 1.2 and there is evidence for the presence of significant absorption at the low energy end (see Fig. 4). The addition of an extra absorption component – zTBabs, which takes the effects of host galaxy absorption into account – to all the models improved the fit significantly (see the left, middle, and right panel of Fig. 5). The const*TBabs(pexrav + zgauss) model fit to the FPMA/FPMB spectra showed evidence for variation in Ecut. To analyse the variation in Ecut with time as well as to find the relation between Ecut and kTe, we used the Ecut values obtained from xillver model fits. The lowest value of Ecut of 92 keV was obtained in epoch B, the highest value of Ecut was observed in epoch E (378
 keV), and intermediate values of Ecut were obtained during other epochs. These observed variations in Ecut indicate that the coronal temperature of NGC 3227 must be changing with time. This is also evident in Fig. 6 (upper panel), where the values of Ecut are plotted against epochs. To quantify the significance of the variation in Ecut, we fitted a constant (the mean of all the Ecut measurements) to the variation in Ecut with epoch and calculated the χ2 and the null hypothesis probability (p) that Ecut does not change with time (shown as a dashed line in the top panel of Fig. 6). We found χ2/d.o.f. ≫ 10 and a p value of 0.0 that the Ecut does not change with time. The values of Ecut obtained during the first two epochs (A and B) are similar to the value of Ecut = 90 ± 20 keV reported by Markowitz et al. (2009). Vasudevan et al. (2013a), from an analysis of XMM and BAT spectra, estimated Ecut to lie outside the BAT range at > 636 keV. Recently, Kang et al. (2021) too reported Ecut values for epochs A, B, and G and lower limits for epochs C, D, E, and F from pexrav model fits. The values of Ecut obtained here using xillver for epochs A, B, and G are in agreement with those of Kang et al. (2021) from the pexrav model. Also, our model fits were able to constrain Ecut during epochs E and F using xillver.
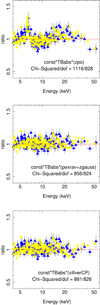 |
Fig. 3. Ratio of data to the model for the model fits const*TBabs(zpo + zgauss), const*TBabs(pexrav + zgauss), and const*TBabs(xillverCP) to the FPMA (blue triangle) and FPMB (yellow triangle) spectra of ObsID 60202002002 of NGC 3227. The spectra are re-binned for visualization purposes. |
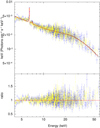 |
Fig. 4. Unfolded spectra with the data-to-model ratio for the model fits const*TBabs(xillverCP) to the FPMA (blue) and FPMB (yellow) spectra of ObsID 60202002014 (epoch G) of NGC 3227. |
Comptonization model fits using xillverCP provided values of kTe that were also found to vary between epochs. We could constrain kTe for epochs A, B, C, and G and obtain lower limits for epochs D, E, F, H, and I. Kang et al. (2021), using the same model used here, was only able to constrain kTe for epochs A and B. Our results for epochs A and B are in agreement with those of Kang et al. (2021). The variation in kTe is shown in the lower panel of Fig. 6. The trend seen in the variation in kTe with epochs is similar to the variation in Ecut. From Comptonization model fits we found the lowest value of kTe = 28 keV during epoch B, while the highest value of kTe = 56
 keV was obtained for epoch E. We obtained lower limits of kTe of 80, 45, 47, 85, and 36 keV during epochs D, E, F, H, and I, respectively. Spectral fits using xillverCP along with the data-to-model ratio for all the epochs are shown in Figs. 5 and 7. The results of the model fits are given in Table 2. To quantify the significance of the variation in kTe, we fitted a constant (the mean of all the kTe measurements) to the variation in kTe with epoch and calculated the χ2 and the null hypothesis probability (p) that kTe does not change with time (shown as a dashed line in Fig. 6). We found a χ2/d.o.f. of 12.86 and a p value of 0.005 that kTe does not change with time. The contour plots between Γ against kTe and R against kTe for NGC 3227 for all the epochs are shown in Figs. 8 and 9 (left panels). From the contour plots it is evident that the coronal temperature variation is prominent in NGC 3227. We therefore conclude that we found variation in the temperature of the corona in NGC 3227. According to Petrucci et al. (2001), for an optically thick corona (τ > 1), Ecut = 3kTe. However, the relation between Ecut and kTe can be complicated in the case of a non-static corona, such as the one with outflows (Liu et al. 2014). Also, according to Middei et al. (2019), the relation of Ecut = 2–3kTe is valid only for low values of τ and kTe. For NGC 3227, using all five epochs in which we could constrain both Ecut and kTe, we found Ecut = 3.94 ± 0.62 kTe, which is similar to that of Petrucci et al. (2001) and Middei et al. (2019).
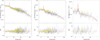 |
Fig. 5. Unfolded spectra and model fits along with the data-to-model ratio for const*TBabs(xillverCP) fits to epoch G (left), epoch H (middle), and epoch I (right) of NGC 3227. For epochs G, H, and I, zTBabs was added to the model. Blue and yellow data points refer to FPMA and FPMB, respectively. |
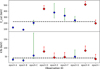 |
Fig. 6. Variation in Ecut and kTe with the observation epochs as obtained from the xillver and xillverCP model fits, respectively, to the spectra of NGC 3227. The plotted errors were calculated using the χ2 = 2.71 criterion, i.e. 90% confidence range. The dashed black lines in each panel are fits of constant (mean of Ecut and kTe) to the data points. For the fitting, epochs in which we were unable to constrain Ecut and kTe were dropped (indicated with red diamonds). |
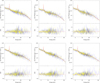 |
Fig. 7. Unfolded spectra along with const*TBabs(xillverCP) model fits and the data-to-model ratio for epoch A (top-left panel), epoch B (top-middle panel), epoch C (top-right panel), epoch D (bottom-left panel), epoch E (bottom-middle panel), and epoch F (bottom-right panel) for the source NGC 3227. Blue and yellow data points refer to FPMA and FPMB, respectively. |
4.2. MR 2251−178
This source has five epochs of observations that are public and have exposures > 20 ks. In this work we analysed all of them. Simple power law fits to the FPMA spectra of all the epochs are shown in the right panel of Fig. 1. From this figure, no noticeable change in the spectra could be ascertained. The ratio of the model fits const*TBabs(zpo), const*TBabs(pexrav), and const*TBabs(xillverCP) to the observed FPMA and FPMB spectra on ObsID 90601637002, the one with the longest exposure time, are shown in Fig. 2. From two sets of observations from Einstein separated by about a year, Halpern (1984) found evidence of variable X-ray absorption in MR 2251−178, with the column density changing from < 5 × 1021 cm−2 to 2 × 1022 cm−2; this was suggested to be due to the presence of a warm absorber. EXOSAT and Ginga observations revealed a strong correspondence between the absorbing column density and the flux of the source, with the low energy absorption decreasing with the increasing flux of the source. These observations were explained by variable absorption in photo-ionized gas along the line of sight (Mineo & Stewart 1993; Pan et al. 1990). However, Walter & Courvoisier (1992), from an analysis of the EXOSAT data, argued that the variability seen in the source can be explained without invoking the presence of a warm absorber. From the ratio of the observed data to the model fit, we did not find any signature of absorption that could affect the source spectra in all observations except epoch E, and to address this we added the zTBabs component to all four models in epoch E (see Figs. 10 and 11). Model fits to the four sets of observations that span about five years using const*TBabs(zpo) do not reveal the presence of a FeKα line in the spectra, and the reflection bump was found to be either negligible or weak (see top panel of Fig. 2), likely due to poor S/N. However, the ratio plot for the model const*TBabs(zpo) to the epoch D spectra revealed the presence of the FeKα line at around 6.4 keV. We therefore added a zgauss component with the model and found the energy of the line at 6.49 keV with a fixed width of 0.1 keV; leaving the parameter free did not significantly improve the fit. For this source the FeKα line has previously been reported to be present in the Ginga observations with an equivalent width of 125
 eV (Mineo & Stewart 1993). Relatively strong FeKα was also reported to be present in the BeppoSAX observation (Orr et al. 2001), and a narrow FeKα line was present in the Chandra observations (Gibson et al. 2005). From BeppoSAX observations in the 0.1–200 keV band, Orr et al. (2001) found a Ecut value of around 100 keV, which is similar to that obtained here. To find evidence for the change in kTe, if any, we carried out a fitting of the observations with the physical model, const*TBabs(xillverCP). An examination of the results of the fit (Table 3) shows that the kTe obtained during all the epochs agree within errors. Though we could not find any signature of kTe variation with epochs from the xillverCP fit, the Ecut values obtained from the xillver model fit during epochs A, C, and D agree within errors except that of epoch B. This could be due to the quality of the data in epoch B, as the values of Ecut and kTe obtained during that epoch also have large error bars. To test for the kTe variation, if any, we plotted the 90 per cent contours between kTe and Γ. The 90 per cent contours of kTe against Γ overlap (see Fig. 8), and we conclude that in MR 2251−178 we did not find any variation in kTe with time. The 90 per cent contours of R against kTe are also shown in the bottom panel of Fig. 9. Considering all four epochs where Ecut and kTe could be constrained, we found Ecut = 4.84 ± 0.11kTe. This deviates from the generally adopted Ecut = 2–3kTe (Petrucci et al. 2001). It is likely that the relation between Ecut and kTe is complex and may depend on other physical properties of the sources. Homogeneous analyses of a large number of sources are needed to establish the relation between Ecut and kTe as well as its dependence on other physical properties. Spectral fits using xillverCP along with the residuals for all the epochs are shown in Figs. 10 and 11.
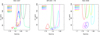 |
Fig. 8. 90 per cent confidence level contours between kTe and Γ for the xillverCP model fit to the FPMA/FPMB spectra of NGC 3227 (left), MR 2251−178 (middle), and NGC 5548 (right). The colours indicate different ObsIDs. Here for MR 2251−178 the limits of kTe do not have a correspondence with the values given in Table 3. This is because the contours were generated by freezing the R parameter so as to put all five ObsIDs together. |
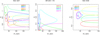 |
Fig. 9. 90 per cent confidence level contours between R and kTe for the xillverCP model fit to the FPMA/FPMB spectra of NGC 3227 (left), MR 2251−178 (middle), and NGC 5548 (right). |
 |
Fig. 10. Unfolded spectra along with the data-to-model ratio for const*TBabs(xillverCp) fits to epoch A (left panel) and epoch B (right panel) observations of MR 2251−178. Here blue points are for FPMA and yellow points are for FPMB. |
 |
Fig. 11. Unfolded spectra along with the data-to-model ratio for const*TBabs(xillverCp) fits to epoch C (left panel), epoch D (middle panel), and epoch E (right panel) observations of MR 2251−178. Here blue points are for FPMA and yellow points are for FPMB. In epoch E, the zTBabs component was added to the model. |
4.3. NGC 5548
NGC 5548 was observed by NuSTAR six times between July 2013 and January 2021. Of these, Zhang et al. (2018) have reported results for five epochs. In this work we carried out both phenomenological and physical model fits for all six epochs. We fitted the spectra using const*TBabs(zpo + zgauss) and const*TBabs(pexrav + zgauss) to model the primary power law emission and the reflection component along with the FeKα line, with the width of the line frozen to the value of 0.1 keV. From the ratio of the observed data to the model fit using TBabs, we found the presence of an absorption component in the spectra. So, unlike for the other sources, for NGC 5548 we added an extra component, zTBabs, in each model to account for the absorption by the host galaxy. Moreover, as xillver self-consistently models the reflected spectrum and its associated FeKα line, we also fitted the spectra using xillver, and Ecut values obtained using the xillver model were used to find variation in Ecut. The Ecut obtained from xillver model fits are > 487 keV, > 480 keV, 129 keV, 179
 keV, 133
 , and > 394 keV for epochs A, B, C, D, E, and F, respectively. The residuals of the fit to the spectra for epoch D, which has the maximum exposure time, for various models are given in Fig. 12, and the results of the fit are given in Table 4. From xillver model fits, we could only constrain Ecut for epochs C, D, and E, while Zhang et al. (2018) could constrain Ecut in the four epochs (A, C, D, and E). For epochs C and D, our values of Ecut are in agreement with those of Zhang et al. (2018), but the results do not match for epoch E. Though Zhang et al. (2018) claims to have detected Ecut variation in NGC 5548, our analysis could not confirm changes in Ecut. This could be due to differences in the choice of binning and the energy ranges used in each work. Ursini et al. (2015), via the joint fitting of XMM-Newton, Chandra, NuSTAR, and INTEGRAL data, obtained lower limits for Ecut in all the epochs except for epoch D. Using the simultaneous XMM-Newton and NuSTAR data from the 2013 campaign, Cappi et al. (2016) also fitted the 4–79 keV epoch A and B together, epoch D, and epoch E spectra using a cutoff power law and pexmon. Their values of Ecut are in agreement with the Ecut values obtained in this work.
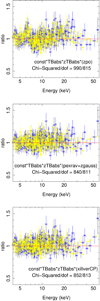 |
Fig. 12. Ratio plots for the model fits const*TBabs*zTBabs*(zpo +zgauss), const*TBabs*zTBabs*(pexrav + zgauss), and const*TBabs*zTBabs(xillverCP) to the FPMA (blue star) and FPMB (yellow star) spectra of ObsID 60002044006 of NGC 5548. The spectra are re-binned for visualization purposes only. |
Fitting the physical Comptonization model xillverCP to ascertain the change in coronal temperature, we got the highest kTe value of 65 keV during epoch D, for epochs A, B, and F we obtained lower limits of 53, 54, and 71 keV, and for the remaining two epochs, C and E, we obtained similar values of 39
 keV and 38
 keV, respectively. The values of kTe between epochs agree with one another within error bars. The model fits to the data along with the data-to-model ratio for all the epochs of observation are shown in Figs. 13 and 14. The Ecut values obtained here point to variability. However, the derived kTe values are consistent with one another within error bars. The contour plots between kTe against Γ as well as R against kTe are shown in the rightmost panels of Figs. 8 and 9. From these plots, the change in kTe is not evident. We thus conclude that we have not found evidence for variation in kTe in NGC 5548. Considering all the epochs in which we could constrain both Ecut and kTe, we found Ecut = 3.19 ± 0.32kTe, which is in agreement with the empirical relation of Petrucci et al. (2001).
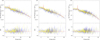 |
Fig. 13. Unfolded spectra with the data-to-model ratio and the const*TBabs*zTBabs(xillverCP) model fits to the spectra of NGC 5548. Here epoch A is shown in the left panel, epoch B is shown in the middle panel, and epoch C is shown in the right panel. Data from FPMA and FPMB are shown in blue and yellow, respectively. |
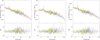 |
Fig. 14. Unfolded spectra with the data-to-model ratio and the const*TBabs*zTBabs(xillverCP) model fits to the spectra of NGC 5548. Here the left, middle, and right panels show the results for epochs D, E, and F, respectively. Data from FPMA and FPMB are shown in blue and yellow, respectively. |
4.4. Correlation between different parameters
We discuss below the correlation between various parameters. This is restricted to the source NGC 3227 as the temperature of its corona is found to vary in this work. Since the errors in the measured Ecut and kTe values are not symmetric and there is no conventional way to address such errors during a correlation study, we adopted two procedures to find the correlation between various parameters.
In the first case, we neglected the corresponding errors, considered only the best-fit values of the parameters, and performed the ordinary linear least square (OLS) fit between them. The Pearson’s correlation coefficient (r) and the null hypothesis probability (p) for no correlation were also estimated using the best-fit values.
In the second case, to take the non-symmetric errors into account, we simulated 105 points from each rectangular box around the best-fit values (x, y) with x and y boundaries of (xlow, xhigh) and (ylow, yhigh), respectively. Here xlow, ylow and xhigh, yhigh refer to the lower and upper errors in x and y values. A linear least squares fit was done 105 times, yielding the distribution of the slope (m), the intercept (c), the Pearson’s rank correlation coefficient, and the probability of no correlation. The median values of the distributions were taken to represent the best-fit values of the correlation. All the values and the errors for the unweighted correlation as well as for the simulated correlation are given in Table 5.
Results of the correlation analysis between different parameters for NGC 3227.
4.4.1. Γ versus flux
In Seyfert galaxies, the X-ray spectra are generally found to be softer with increasing X-ray flux (Markowitz et al. 2003). We show in Fig. 15 the correlation between Γ and the brightness of NGC 3227. For the source, each point in the figure corresponds to the Γ and flux obtained by xillverCP model fits to each epoch of spectra. Shown are (a) the OLS fit to the data, (b) the linear least square fit employing the median values of the simulated points, using the lower and upper errors in Γ and flux values, and (c) the area bounded by the errors in the least square fit parameters. For NGC 3227, we found an anti-correlation between Γ and flux (see Fig. 15 and Table 5) between epochs of observation significant at the greater than 90 per cent level.
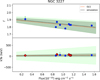 |
Fig. 15. Correlation of Γ and kTe with the X-ray brightness of NGC 3227. The dashed orange line is the OLS fit to the data points. The dashed black line is the linear line drawn using the median values of the simulated parameters. The grey shaded region indicates the upper and lower errors in the fit parameters for OLS, and the green region indicates the errors in the fit parameter obtained from the simulation. In the least square analysis, epochs in which we were unable to constrain kTe were dropped (indicated with red diamonds). |
4.4.2. kTe versus flux
Correlations between the changes in the temperature of the corona with other physical parameters of the sources, such as its apparent brightness and spectral shape, can provide important constraints and enhance our understanding of AGN corona. The correlation between kTe and flux is shown in Fig. 15. Also shown in the figure are the ordinary and simulated linear least squares fits to the data. No correlation is found between kTe and flux in NGC 3227.
4.4.3. Γ versus kTe
In Fig. 16 the correlation between Γ and kTe is shown, including the ordinary and simulated least square fits to the data. The correlation between Γ and kTe is found to be not significant.
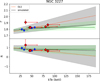 |
Fig. 16. Correlation between Γ and R with the kTe of NGC 3227. The dashed lines and shaded regions have the same meaning as in Fig. 15. Epochs in which kTe could not be constrained (shown as red diamonds) were not included in the linear least square analysis. |
4.4.4. R versus kTe
The correlation between the distant reflection fraction (R) and kTe is presented in the bottom panel of Fig. 16. We did not find any correlation between these two parameters.
4.5. Nature of the corona in AGN
The primary X-ray emission from thermal Comptonization depends on the optical depth (τ) and kTe as (Zdziarski et al. 1996; Życki et al. 1999)
![Mathematical equation: $$ \begin{aligned} \tau = \sqrt{\frac{9}{4} + \frac{3}{\theta \Big [\Big (\Gamma + \frac{1}{2}\Big )^2 - \frac{9}{4}\Big ]}} - \frac{3}{2}, \\ \end{aligned} $$](/articles/aa/full_html/2022/06/aa42386-21/aa42386-21-eq459.gif) (7)
(7)
where θ = kTe/mec2. We show in Fig. 17 the variation in the reflection fraction, the optical depth, and the Compton ‘y’ parameter with flux. The Compton y parameter is defined as (Petrucci et al. 2001)
![Mathematical equation: $$ \begin{aligned} { y} \simeq 4\Bigg (\frac{4kT_{\rm e}}{mc^2}\Bigg )\Bigg [1+\Bigg (\frac{4kT_{\rm e}}{mc^2}\Bigg )\Bigg ] \tau (1+\tau ) .\end{aligned} $$](/articles/aa/full_html/2022/06/aa42386-21/aa42386-21-eq460.gif) (8)
(8)
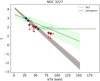 |
Fig. 17. Correlation between the τ and kTe of NGC 3227. The dashed lines and the shaded regions have the same meaning as in Fig. 15. The red diamonds shown were not considered for the linear least squares fit. |
According to Stern et al. (1995), a Comptonized corona must have a constant y in equilibrium. We too found no correlation of y with the flux of the source. The parameter τ is found not to show any statistically significant variation with flux, and R is not found to be correlated with flux either (see Fig. 17).
The few multiple epochs of observation of AGN available today point to Ecut increasing with the flux of the sources. For example, from an analysis of NuSTAR and XMM-Newton observations of NGC 5548, Zhang et al. (2018) found Ecut to be positively correlated with the flux of the source. Similarly, in Mrk 335, Keek & Ballantyne (2016), through a joint fitting of Suzaku and NuSTAR, found Ecut to be positively correlated with flux. Recently, from flux resolved spectroscopy of Ark 564, Barua et al. (2020) found the temperature of the corona to decrease with increasing flux. Also, for the source ESO 103−035 Barua et al. (2021) found a positive correlation between kTe and flux. Scenarios that could cause the change in the temperature of the corona or Ecut in AGN are (a) Compton cooling and (b) an expanding corona. In the Compton cooling scenario, as the source brightens there will be an increase in seed UV photons from the disk for Comptonization, leading to a cooling of the corona. This leads to a ‘cooler when brighter behaviour’. In the expanding corona scenario, the increase in kTe during high flux states of the AGN could be due to changes in the geometry of the corona. This has been invoked to explain the Ecut changes in Mrk 335 (Keek & Ballantyne 2016) and NGC 5548 (Zhang et al. 2018). According to the expanding corona model, at low flux state the corona is warm, optically thick, compact, and close to the black hole. This causes more illumination of the disk, leading to a larger reflection fraction. As the source increases in brightness, the corona expands, the optical depth drops, and the temperature rises. A reduced reflection fraction during this period implies that the corona expands vertically from the disk. In NGC 3227 too, the corona temperature is found to vary with time. We found a negative correlation between the optical depth (τ) and kTe, with τ decreasing towards higher temperatures (see Fig. 18). We calculated τ using Eq. (7) and, according to Zdziarski et al. (1996), τ is geometry dependent and equals the radial optical depth in a uniform sphere. The negative correlation between τ and kTe implies a change in the geometry of the corona (Ballantyne et al. 2014). Tortosa et al. (2018) too, from the analysis of a sample of AGN, found a negative correlation between τ and kTe. According to the authors, this negative correlation could not be explained with a fixed disk-corona configuration in radiative balance. The possible explanation for this kind of behaviour could be (a) due to the change in the geometry and position of the corona and/or (b) variation in the fraction of the intrinsic disk emission to the total disk emission. We note that broadband spectral energy distribution fits to simultaneous UV to hard X-ray data alone will be able to provide a strong constraint on τ. This in turn can put constrains on the role of accretion disk emission in kTe changes. In NGC 3227 we found no statistically significant correlations between kTe and flux, between R and flux, between Γ and flux, or between Γ and kTe.
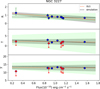 |
Fig. 18. Distant reflection fraction (R), the optical depth (τ), and Compton-y parameter as a function of flux for the source NGC 3227. The dashed lines and the shaded regions have the same meaning as in Fig. 15. The red diamonds were not included in the linear least squares fit. |
5. Summary
In this work, we carried out spectral analyses of the NuSTAR data for three Seyfert-type AGN, namely NGC 3227, NGC 5548, and MR 2251−178, including a few ObsIDs that had not been analysed in previous works. We summarize our results below:
-
All the sources were found to show moderate variations in their average brightness during the epochs analysed in this work.
-
In NGC 3227, we found unambiguous evidence for the change in the temperature of the corona. This change in kTe is also reflected in the variation in Ecut. For NGC 5548 and MR 2251−178 we found no evidence for variation in the temperature of the corona.
The variation in the temperature of the corona is known for fewer than half a dozen sources. Details on such a coronal temperature variation in more AGN are needed to pinpoint the reasons for the corona temperature variation and its effect on the other physical properties of the sources.
Acknowledgments
We thank the anonymous referee for her/his useful comments and suggestions which improved the quality and the clarity of the paper. We thank the NuSTAR Operations, Software and Calibration teams for support with the execution and analysis of these observations. This research has made use of the NuSTAR Data Analysis Software (NuSTARDAS) jointly developed by the ASI Science Data Center (ASDC, Italy) and the California Institute of Technology (USA). This research has made use of data and/or software provided by the High Energy Astrophysics Science Archive Research Center (HEASARC), which is a service of the Astrophysics Science Division at NASA/GSFC.
References
- Alonso-Herrero, A., García-Burillo, S., Pereira-Santaella, M., et al. 2019, A&A, 628, A65 [NASA ADS] [CrossRef] [EDP Sciences] [Google Scholar]
- Arnaud, K. A. 1996, in XSPEC: The First Ten Years, eds. G. H. Jacoby, & J. Barnes, ASP Conf. Ser., 101, 17 [Google Scholar]
- Ballantyne, D. R. 2020, MNRAS, 491, 3553 [NASA ADS] [CrossRef] [Google Scholar]
- Ballantyne, D. R., & Xiang, X. 2020, MNRAS, 496, 4255 [NASA ADS] [CrossRef] [Google Scholar]
- Ballantyne, D. R., Bollenbacher, J. M., Brenneman, L. W., et al. 2014, ApJ, 794, 62 [NASA ADS] [CrossRef] [Google Scholar]
- Baloković, M., Harrison, F. A., Madejski, G., et al. 2020, ApJ, 905, 41 [Google Scholar]
- Barua, S., Jithesh, V., Misra, R., et al. 2020, MNRAS, 492, 3041 [NASA ADS] [CrossRef] [Google Scholar]
- Barua, S., Jithesh, V., Misra, R., et al. 2021, ApJ, 921, 46 [NASA ADS] [CrossRef] [Google Scholar]
- Bentz, M. C., & Katz, S. 2015, PASP, 127, 67 [Google Scholar]
- Bergeron, J., Boksenberg, A., Dennefeld, M., & Tarenghi, M. 1983, MNRAS, 202, 125 [NASA ADS] [CrossRef] [Google Scholar]
- Bhayani, S., & Nandra, K. 2011, MNRAS, 416, 629 [NASA ADS] [Google Scholar]
- Bianchi, S., Guainazzi, M., Matt, G., Fonseca Bonilla, N., & Ponti, G. 2009, A&A, 495, 421 [NASA ADS] [CrossRef] [EDP Sciences] [Google Scholar]
- Cappi, M., De Marco, B., Ponti, G., et al. 2016, A&A, 592, A27 [NASA ADS] [CrossRef] [EDP Sciences] [Google Scholar]
- Chartas, G., Kochanek, C. S., Dai, X., Poindexter, S., & Garmire, G. 2009, ApJ, 693, 174 [Google Scholar]
- Crummy, J., Fabian, A. C., Gallo, L., & Ross, R. R. 2006, MNRAS, 365, 1067 [Google Scholar]
- Dadina, M. 2007, A&A, 461, 1209 [NASA ADS] [CrossRef] [EDP Sciences] [Google Scholar]
- Della Ceca, R., Tagliaferri, G., Ghisellini, G., et al. 2010, AAS/High Energy Astrophysics Division, 11, 7.08 [NASA ADS] [Google Scholar]
- Dewangan, G. C., Mathur, S., Griffiths, R. E., & Rao, A. R. 2008, ApJ, 689, 762 [NASA ADS] [CrossRef] [Google Scholar]
- Done, C., Davis, S. W., Jin, C., Blaes, O., & Ward, M. 2012, MNRAS, 420, 1848 [Google Scholar]
- Fabian, A. C. 1999, Proc. Nat. Acad. Sci., 96, 4749 [NASA ADS] [CrossRef] [Google Scholar]
- Fabian, A. C., Ballantyne, D. R., Merloni, A., et al. 2002, MNRAS, 331, L35 [Google Scholar]
- Fabian, A. C., Zoghbi, A., Ross, R. R., et al. 2009, Nature, 459, 540 [Google Scholar]
- Fabian, A. C., Lohfink, A., Belmont, R., Malzac, J., & Coppi, P. 2017, MNRAS, 467, 2566 [Google Scholar]
- García, J., & Kallman, T. R. 2010, ApJ, 718, 695 [CrossRef] [Google Scholar]
- García, J., Dauser, T., Reynolds, C. S., et al. 2013, ApJ, 768, 146 [Google Scholar]
- García, J., Dauser, T., Lohfink, A., et al. 2014, ApJ, 782, 76 [Google Scholar]
- García, J., Kara, E., Walton, D., et al. 2019, ApJ, 871, 88 [CrossRef] [Google Scholar]
- George, I. M., & Fabian, A. C. 1991, MNRAS, 249, 352 [Google Scholar]
- George, I. M., Mushotzky, R., Turner, T. J., et al. 1998, ApJ, 509, 146 [NASA ADS] [CrossRef] [Google Scholar]
- Gibson, R. R., Marshall, H. L., Canizares, C. R., & Lee, J. C. 2005, ApJ, 627, 83 [NASA ADS] [CrossRef] [Google Scholar]
- Gliozzi, M., & Williams, J. K. 2020, MNRAS, 491, 532 [Google Scholar]
- Haardt, F., & Maraschi, L. 1991, ApJ, 380, L51 [Google Scholar]
- Haardt, F., Maraschi, L., & Ghisellini, G. 1994, ApJ, 432, L95 [NASA ADS] [CrossRef] [Google Scholar]
- Halpern, J. P. 1984, ApJ, 281, 90 [NASA ADS] [CrossRef] [Google Scholar]
- Harrison, F. A., Craig, W. W., Christensen, F. E., et al. 2013, ApJ, 770, 103 [Google Scholar]
- Jin, C., Ward, M., Done, C., & Gelbord, J. 2012, MNRAS, 420, 1825 [Google Scholar]
- Johnson, W. N., McNaron-Brown, K., Kurfess, J. D., et al. 1997, ApJ, 482, 173 [NASA ADS] [CrossRef] [Google Scholar]
- Kaastra, J. S., Kriss, G. A., Cappi, M., et al. 2014, Science, 345, 64 [Google Scholar]
- Kang, J.-L., Wang, J.-X., & Kang, W.-Y. 2021, MNRAS, 502, 80 [NASA ADS] [CrossRef] [Google Scholar]
- Keek, L., & Ballantyne, D. R. 2016, MNRAS, 456, 2722 [CrossRef] [Google Scholar]
- Komossa, S., & Fink, H. 1997, A&A, 327, 483 [NASA ADS] [Google Scholar]
- Lanzuisi, G., Gilli, R., Cappi, M., et al. 2019, ApJ, 875, L20 [Google Scholar]
- Liu, T., Wang, J.-X., Yang, H., Zhu, F.-F., & Zhou, Y.-Y. 2014, ApJ, 783, 106 [Google Scholar]
- Lobban, A. P., Turner, T. J., Reeves, J. N., Braito, V., & Miller, L. 2020, MNRAS, 494, 5056 [NASA ADS] [CrossRef] [Google Scholar]
- Lubiński, P., Zdziarski, A. A., Walter, R., et al. 2010, MNRAS, 408, 1851 [CrossRef] [Google Scholar]
- Lubiński, P., Beckmann, V., Gibaud, L., et al. 2016, MNRAS, 458, 2454 [Google Scholar]
- Macchetto, F., Colina, L., Golombek, D., Perryman, M. A. C., & di Serego Alighieri, S. 1990, ApJ, 356, 389 [NASA ADS] [CrossRef] [Google Scholar]
- Magdziarz, P., Blaes, O. M., Zdziarski, A. A., Johnson, W. N., & Smith, D. A. 1998, MNRAS, 301, 179 [NASA ADS] [CrossRef] [Google Scholar]
- Malizia, A., Molina, M., Bassani, L., et al. 2014, ApJ, 782, L25 [NASA ADS] [CrossRef] [Google Scholar]
- Markowitz, A., Edelson, R., Vaughan, S., et al. 2003, ApJ, 593, 96 [NASA ADS] [CrossRef] [Google Scholar]
- Markowitz, A., Reeves, J. N., George, I. M., et al. 2009, ApJ, 691, 922 [NASA ADS] [CrossRef] [Google Scholar]
- Matt, G., Fabian, A. C., & Ross, R. R. 1993, MNRAS, 262, 179 [NASA ADS] [CrossRef] [Google Scholar]
- Matzeu, G. A., Nardini, E., Parker, M. L., et al. 2020, MNRAS, 497, 2352 [CrossRef] [Google Scholar]
- McHardy, I. M., Gunn, K. F., Uttley, P., & Goad, M. R. 2005, MNRAS, 359, 1469 [NASA ADS] [CrossRef] [Google Scholar]
- Mehdipour, M., Kaastra, J. S., Kriss, G. A., et al. 2015, A&A, 575, A22 [NASA ADS] [CrossRef] [EDP Sciences] [Google Scholar]
- Mehdipour, M., Kriss, G. A., Kaastra, J. S., et al. 2021, A&A, 652, A150 [NASA ADS] [CrossRef] [EDP Sciences] [Google Scholar]
- Middei, R., Bianchi, S., Marinucci, A., et al. 2019, A&A, 630, A131 [NASA ADS] [CrossRef] [EDP Sciences] [Google Scholar]
- Middei, R., Petrucci, P. O., Bianchi, S., et al. 2020, A&A, 640, A99 [NASA ADS] [CrossRef] [EDP Sciences] [Google Scholar]
- Middleton, M. J., Parker, M. L., Reynolds, C. S., Fabian, A. C., & Lohfink, A. M. 2016, MNRAS, 457, 1568 [NASA ADS] [CrossRef] [Google Scholar]
- Mineo, T., & Stewart, G. C. 1993, MNRAS, 262, 817 [NASA ADS] [CrossRef] [Google Scholar]
- Mushotzky, R. F., Done, C., & Pounds, K. A. 1993, ARA&A, 31, 717 [NASA ADS] [CrossRef] [Google Scholar]
- Nandra, K., O’Neill, P. M., George, I. M., & Reeves, J. N. 2007, MNRAS, 382, 194 [NASA ADS] [CrossRef] [Google Scholar]
- Netzer, H., Turner, T. J., & George, I. M. 1994, ApJ, 435, 106 [NASA ADS] [CrossRef] [Google Scholar]
- Nicastro, F., Piro, L., De Rosa, A., et al. 2000, ApJ, 536, 718 [NASA ADS] [CrossRef] [Google Scholar]
- Orr, A., Barr, P., Guainazzi, M., Parmar, A. N., & Young, A. J. 2001, A&A, 376, 413 [NASA ADS] [CrossRef] [EDP Sciences] [Google Scholar]
- Pan, H. C., Stewart, G. C., & Pounds, K. A. 1990, MNRAS, 242, 177 [NASA ADS] [CrossRef] [Google Scholar]
- Petrucci, P. O., Haardt, F., Maraschi, L., et al. 2000, ApJ, 540, 131 [Google Scholar]
- Petrucci, P. O., Haardt, F., Maraschi, L., et al. 2001, ApJ, 556, 716 [Google Scholar]
- Petrucci, P. O., Paltani, S., Malzac, J., et al. 2013, A&A, 549, A73 [NASA ADS] [CrossRef] [EDP Sciences] [Google Scholar]
- Petrucci, P. O., Ursini, F., De Rosa, A., et al. 2018, A&A, 611, A59 [NASA ADS] [CrossRef] [EDP Sciences] [Google Scholar]
- Petrucci, P. O., Gronkiewicz, D., Rozanska, A., et al. 2020, A&A, 634, A85 [NASA ADS] [CrossRef] [EDP Sciences] [Google Scholar]
- Porquet, D., Reeves, J. N., Matt, G., et al. 2018, A&A, 609, A42 [NASA ADS] [CrossRef] [EDP Sciences] [Google Scholar]
- Rani, P., & Stalin, C. S. 2018a, ApJ, 856, 120 [NASA ADS] [CrossRef] [Google Scholar]
- Rani, P., & Stalin, C. S. 2018b, J. Astrophys. Astron., 39, 15 [NASA ADS] [CrossRef] [Google Scholar]
- Rani, P., Stalin, C. S., & Goswami, K. D. 2019, MNRAS, 484, 5113 [NASA ADS] [CrossRef] [Google Scholar]
- Rees, M. J. 1984, ARA&A, 22, 471 [Google Scholar]
- Reeves, J. N., Braito, V., Porquet, D., et al. 2021, MNRAS, 500, 1974 [Google Scholar]
- Ricci, C., Walter, R., Courvoisier, T. J. L., & Paltani, S. 2011, A&A, 532, A102 [NASA ADS] [CrossRef] [EDP Sciences] [Google Scholar]
- Ricci, C., Trakhtenbrot, B., Koss, M. J., et al. 2017, ApJS, 233, 17 [Google Scholar]
- Ricker, G. R., Clarke, G. W., Doxsey, R. E., et al. 1978, Nature, 271, 35 [NASA ADS] [CrossRef] [Google Scholar]
- Risaliti, G., Elvis, M., Fabbiano, G., Baldi, A., & Zezas, A. 2005, ApJ, 623, L93 [Google Scholar]
- Risaliti, G., Nardini, E., Salvati, M., et al. 2011, MNRAS, 410, 1027 [Google Scholar]
- Ross, R. R., & Fabian, A. C. 1993, MNRAS, 261, 74 [NASA ADS] [CrossRef] [Google Scholar]
- Różańska, A., Malzac, J., Belmont, R., Czerny, B., & Petrucci, P. O. 2015, A&A, 580, A77 [NASA ADS] [CrossRef] [EDP Sciences] [Google Scholar]
- Schmitt, H. R., Kinney, A. L., Storchi-Bergmann, T., & Antonucci, R. R. J. 1997, ApJ, 477, 623 [NASA ADS] [CrossRef] [Google Scholar]
- Shakura, N. I., & Sunyaev, R. A. 1973, A&A, 500, 33 [NASA ADS] [Google Scholar]
- Stern, B. E., Poutanen, J., Svensson, R., Sikora, M., & Begelman, M. C. 1995, ApJ, 449, L13 [NASA ADS] [Google Scholar]
- Tazaki, F., Ueda, Y., Terashima, Y., & Mushotzky, R. F. 2011, ApJ, 738, 70 [NASA ADS] [CrossRef] [Google Scholar]
- Tortosa, A., Bianchi, S., Marinucci, A., Matt, G., & Petrucci, P. O. 2018, A&A, 614, A37 [NASA ADS] [CrossRef] [EDP Sciences] [Google Scholar]
- Turner, T. J., Reeves, J. N., Braito, V., et al. 2018, MNRAS, 481, 2470 [NASA ADS] [CrossRef] [Google Scholar]
- Ursini, F., Boissay, R., Petrucci, P. O., et al. 2015, A&A, 577, A38 [NASA ADS] [CrossRef] [EDP Sciences] [Google Scholar]
- Ursini, F., Petrucci, P. O., Matt, G., et al. 2016, MNRAS, 463, 382 [NASA ADS] [CrossRef] [Google Scholar]
- Vasudevan, R. V., Mushotzky, R. F., & Gandhi, P. 2013a, ApJ, 770, L37 [NASA ADS] [CrossRef] [Google Scholar]
- Vasudevan, R. V., Brandt, W. N., Mushotzky, R. F., et al. 2013b, ApJ, 763, 111 [NASA ADS] [CrossRef] [Google Scholar]
- Verner, D. A., Ferland, G. J., Korista, K. T., & Yakovlev, D. G. 1996, ApJ, 465, 487 [Google Scholar]
- Véron-Cetty, M. P., & Véron, P. 2010, A&A, 518, A10 [Google Scholar]
- Walter, R., & Courvoisier, T. J. L. 1992, A&A, 266, 57 [NASA ADS] [Google Scholar]
- Wang, J., Mao, Y. F., & Wei, J. Y. 2009, AJ, 137, 3388 [NASA ADS] [CrossRef] [Google Scholar]
- Willingale, R., Starling, R. L. C., Beardmore, A. P., Tanvir, N. R., & O’Brien, P. T. 2013, MNRAS, 431, 394 [Google Scholar]
- Wilms, J., Allen, A., & McCray, R. 2000, ApJ, 542, 914 [Google Scholar]
- Xu, Y., García, J. A., Walton, D. J., et al. 2021, ApJ, 913, 13 [NASA ADS] [CrossRef] [Google Scholar]
- Zdziarski, A. A., Johnson, W. N., & Magdziarz, P. 1996, MNRAS, 283, 193 [NASA ADS] [CrossRef] [Google Scholar]
- Zdziarski, A. A., Poutanen, J., & Johnson, W. N. 2000, ApJ, 542, 703 [NASA ADS] [CrossRef] [Google Scholar]
- Zhang, J.-X., Wang, J.-X., & Zhu, F.-F. 2018, ApJ, 863, 71 [CrossRef] [Google Scholar]
- Zoghbi, A., Fabian, A. C., Reynolds, C. S., & Cackett, E. M. 2012, MNRAS, 422, 129 [NASA ADS] [CrossRef] [Google Scholar]
- Zoghbi, A., Matt, G., Miller, J. M., et al. 2017, ApJ, 836, 2 [NASA ADS] [CrossRef] [Google Scholar]
- Zycki, P. T., & Czerny, B. 1994, MNRAS, 266, 653 [NASA ADS] [CrossRef] [Google Scholar]
- Życki, P. T., Done, C., & Smith, D. A. 1999, MNRAS, 309, 561 [Google Scholar]
All Tables
All Figures
|
Fig. 1. Unfolded spectra of the nine observations for NGC 3227 (left), six observations for NGC 5548 (middle), and five observations for MR 2251−178 (right) fitted with a simple power law. Bottom panels: ratio of the observed spectra to the model. For clarity, we used only FPMA data. The spectra are re-binned for visualization purposes only. |
| In the text | |
|
Fig. 2. Ratio of data to model for the model fits const*TBabs*zTBabs*(zpo), const*TBabs*zTBabs*(pexrav), and const*TBabs*zTBabs(xillverCP) to the FPMA (blue dot) and FPMB (yellow dot) spectra of ObsID 90601637002 of MR 2251−178. We re-binned the spectra for visualization purposes only. |
| In the text | |
|
Fig. 3. Ratio of data to the model for the model fits const*TBabs(zpo + zgauss), const*TBabs(pexrav + zgauss), and const*TBabs(xillverCP) to the FPMA (blue triangle) and FPMB (yellow triangle) spectra of ObsID 60202002002 of NGC 3227. The spectra are re-binned for visualization purposes. |
| In the text | |
|
Fig. 4. Unfolded spectra with the data-to-model ratio for the model fits const*TBabs(xillverCP) to the FPMA (blue) and FPMB (yellow) spectra of ObsID 60202002014 (epoch G) of NGC 3227. |
| In the text | |
|
Fig. 5. Unfolded spectra and model fits along with the data-to-model ratio for const*TBabs(xillverCP) fits to epoch G (left), epoch H (middle), and epoch I (right) of NGC 3227. For epochs G, H, and I, zTBabs was added to the model. Blue and yellow data points refer to FPMA and FPMB, respectively. |
| In the text | |
|
Fig. 6. Variation in Ecut and kTe with the observation epochs as obtained from the xillver and xillverCP model fits, respectively, to the spectra of NGC 3227. The plotted errors were calculated using the χ2 = 2.71 criterion, i.e. 90% confidence range. The dashed black lines in each panel are fits of constant (mean of Ecut and kTe) to the data points. For the fitting, epochs in which we were unable to constrain Ecut and kTe were dropped (indicated with red diamonds). |
| In the text | |
|
Fig. 7. Unfolded spectra along with const*TBabs(xillverCP) model fits and the data-to-model ratio for epoch A (top-left panel), epoch B (top-middle panel), epoch C (top-right panel), epoch D (bottom-left panel), epoch E (bottom-middle panel), and epoch F (bottom-right panel) for the source NGC 3227. Blue and yellow data points refer to FPMA and FPMB, respectively. |
| In the text | |
|
Fig. 8. 90 per cent confidence level contours between kTe and Γ for the xillverCP model fit to the FPMA/FPMB spectra of NGC 3227 (left), MR 2251−178 (middle), and NGC 5548 (right). The colours indicate different ObsIDs. Here for MR 2251−178 the limits of kTe do not have a correspondence with the values given in Table 3. This is because the contours were generated by freezing the R parameter so as to put all five ObsIDs together. |
| In the text | |
|
Fig. 9. 90 per cent confidence level contours between R and kTe for the xillverCP model fit to the FPMA/FPMB spectra of NGC 3227 (left), MR 2251−178 (middle), and NGC 5548 (right). |
| In the text | |
|
Fig. 10. Unfolded spectra along with the data-to-model ratio for const*TBabs(xillverCp) fits to epoch A (left panel) and epoch B (right panel) observations of MR 2251−178. Here blue points are for FPMA and yellow points are for FPMB. |
| In the text | |
|
Fig. 11. Unfolded spectra along with the data-to-model ratio for const*TBabs(xillverCp) fits to epoch C (left panel), epoch D (middle panel), and epoch E (right panel) observations of MR 2251−178. Here blue points are for FPMA and yellow points are for FPMB. In epoch E, the zTBabs component was added to the model. |
| In the text | |
|
Fig. 12. Ratio plots for the model fits const*TBabs*zTBabs*(zpo +zgauss), const*TBabs*zTBabs*(pexrav + zgauss), and const*TBabs*zTBabs(xillverCP) to the FPMA (blue star) and FPMB (yellow star) spectra of ObsID 60002044006 of NGC 5548. The spectra are re-binned for visualization purposes only. |
| In the text | |
|
Fig. 13. Unfolded spectra with the data-to-model ratio and the const*TBabs*zTBabs(xillverCP) model fits to the spectra of NGC 5548. Here epoch A is shown in the left panel, epoch B is shown in the middle panel, and epoch C is shown in the right panel. Data from FPMA and FPMB are shown in blue and yellow, respectively. |
| In the text | |
|
Fig. 14. Unfolded spectra with the data-to-model ratio and the const*TBabs*zTBabs(xillverCP) model fits to the spectra of NGC 5548. Here the left, middle, and right panels show the results for epochs D, E, and F, respectively. Data from FPMA and FPMB are shown in blue and yellow, respectively. |
| In the text | |
|
Fig. 15. Correlation of Γ and kTe with the X-ray brightness of NGC 3227. The dashed orange line is the OLS fit to the data points. The dashed black line is the linear line drawn using the median values of the simulated parameters. The grey shaded region indicates the upper and lower errors in the fit parameters for OLS, and the green region indicates the errors in the fit parameter obtained from the simulation. In the least square analysis, epochs in which we were unable to constrain kTe were dropped (indicated with red diamonds). |
| In the text | |
|
Fig. 16. Correlation between Γ and R with the kTe of NGC 3227. The dashed lines and shaded regions have the same meaning as in Fig. 15. Epochs in which kTe could not be constrained (shown as red diamonds) were not included in the linear least square analysis. |
| In the text | |
|
Fig. 17. Correlation between the τ and kTe of NGC 3227. The dashed lines and the shaded regions have the same meaning as in Fig. 15. The red diamonds shown were not considered for the linear least squares fit. |
| In the text | |
|
Fig. 18. Distant reflection fraction (R), the optical depth (τ), and Compton-y parameter as a function of flux for the source NGC 3227. The dashed lines and the shaded regions have the same meaning as in Fig. 15. The red diamonds were not included in the linear least squares fit. |
| In the text | |
Current usage metrics show cumulative count of Article Views (full-text article views including HTML views, PDF and ePub downloads, according to the available data) and Abstracts Views on Vision4Press platform.
Data correspond to usage on the plateform after 2015. The current usage metrics is available 48-96 hours after online publication and is updated daily on week days.
Initial download of the metrics may take a while.