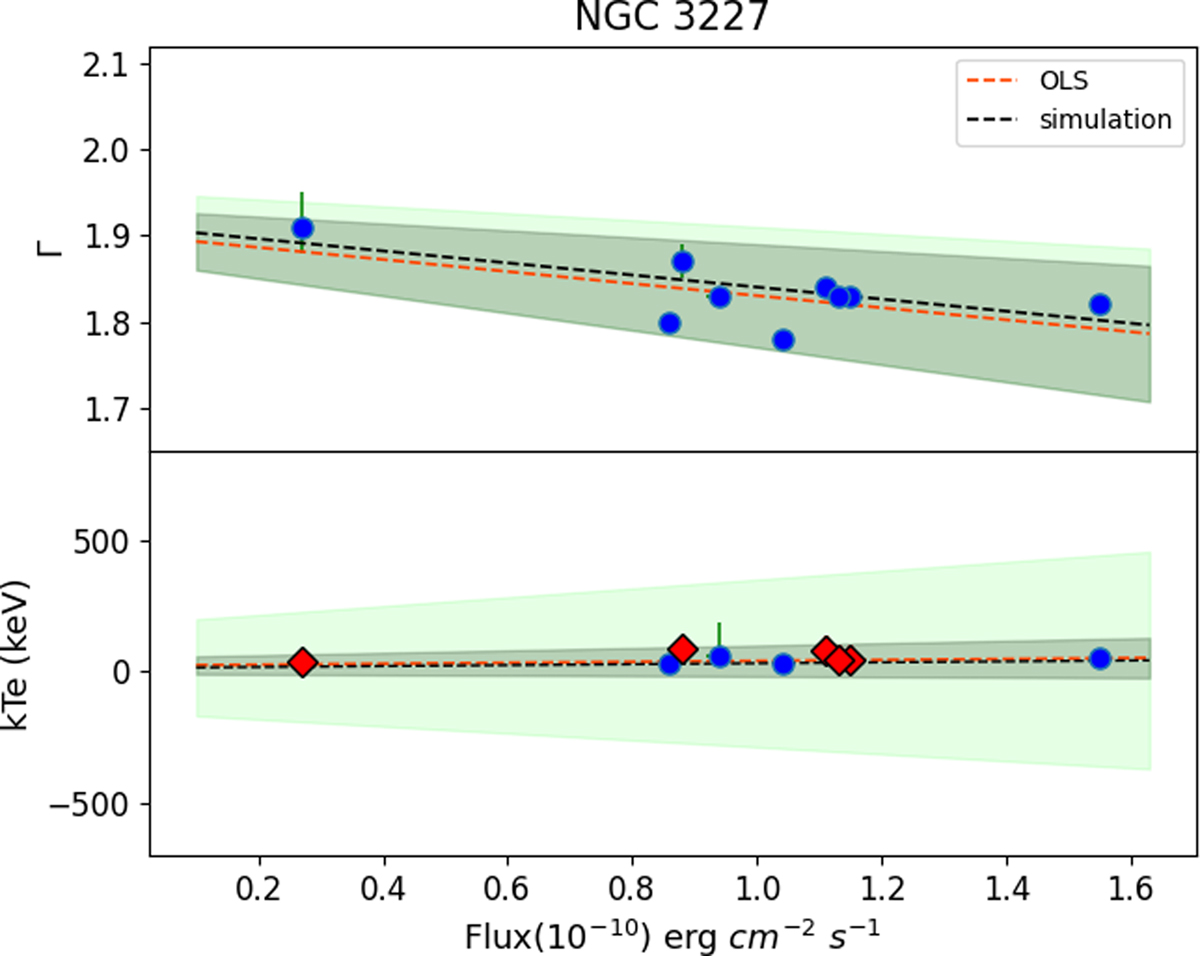
Fig. 15.
Download original image
Correlation of Γ and kTe with the X-ray brightness of NGC 3227. The dashed orange line is the OLS fit to the data points. The dashed black line is the linear line drawn using the median values of the simulated parameters. The grey shaded region indicates the upper and lower errors in the fit parameters for OLS, and the green region indicates the errors in the fit parameter obtained from the simulation. In the least square analysis, epochs in which we were unable to constrain kTe were dropped (indicated with red diamonds).
Current usage metrics show cumulative count of Article Views (full-text article views including HTML views, PDF and ePub downloads, according to the available data) and Abstracts Views on Vision4Press platform.
Data correspond to usage on the plateform after 2015. The current usage metrics is available 48-96 hours after online publication and is updated daily on week days.
Initial download of the metrics may take a while.