Free Access
Fig. 16.
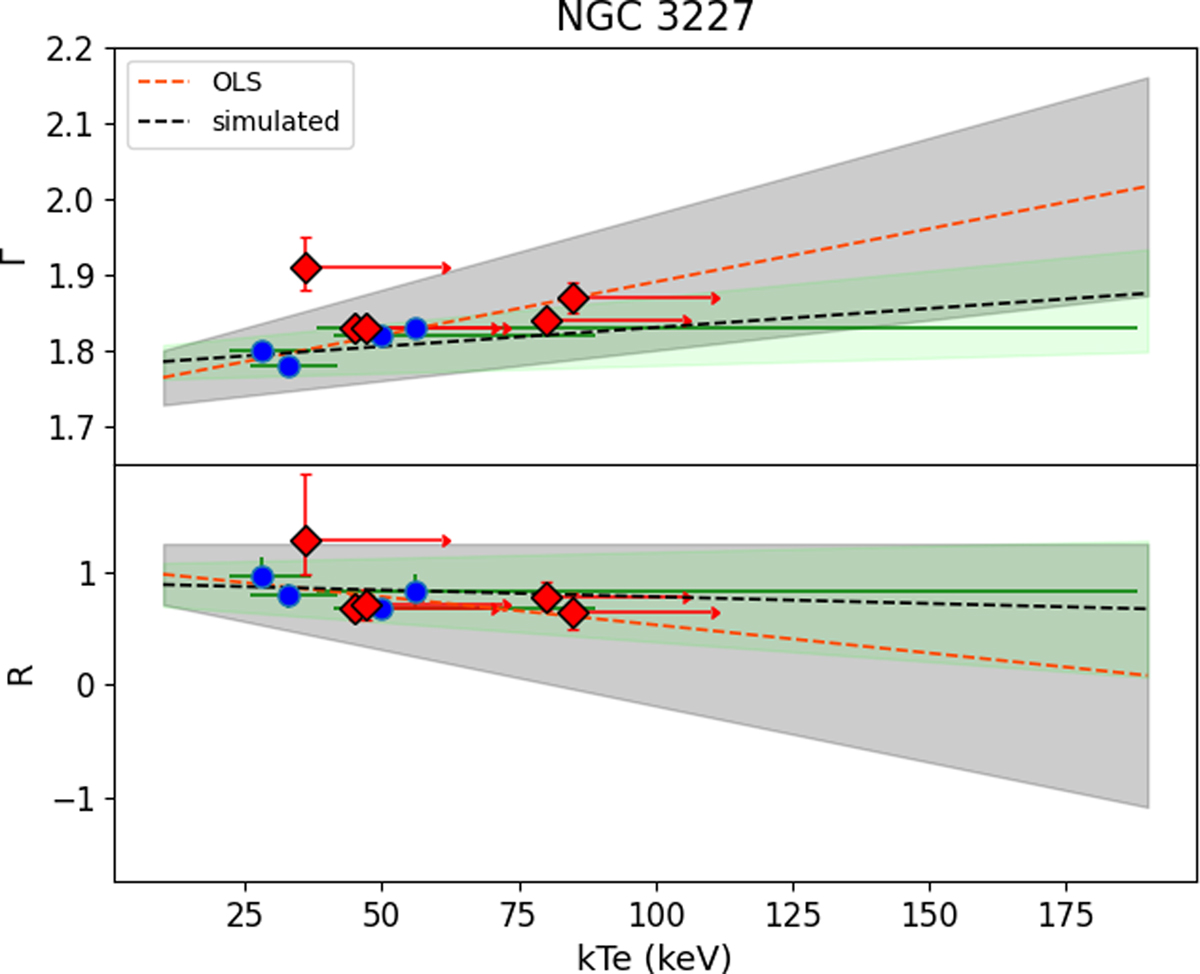
Download original image
Correlation between Γ and R with the kTe of NGC 3227. The dashed lines and shaded regions have the same meaning as in Fig. 15. Epochs in which kTe could not be constrained (shown as red diamonds) were not included in the linear least square analysis.
Current usage metrics show cumulative count of Article Views (full-text article views including HTML views, PDF and ePub downloads, according to the available data) and Abstracts Views on Vision4Press platform.
Data correspond to usage on the plateform after 2015. The current usage metrics is available 48-96 hours after online publication and is updated daily on week days.
Initial download of the metrics may take a while.