| Issue |
A&A
Volume 658, February 2022
|
|
|---|---|---|
| Article Number | L2 | |
| Number of page(s) | 4 | |
| Section | Letters to the Editor | |
| DOI | https://doi.org/10.1051/0004-6361/202141853 | |
| Published online | 01 February 2022 | |
Letter to the Editor
Feeding the spider with carbon
[CII] emission from the circumgalactic medium and active galactic nucleus⋆
1
European Southern Observatory, Karl Schwarzschild Straße 2, 85748 Garching, Germany
e-mail: cdebreuc@eso.org
2
National Radio Astronomy Observatory, 520 Edgemont Road, Charlottesville, VA 22903, USA
3
Inter-University Institute for Data Intensive Astronomy, Department of Astronomy, University of Cape Town, Rondebosch 7701, South Africa
4
Physics Department, University of Johannesburg, 5 Kingsway Ave, Rossmore, Johannesburg 2092, South Africa
5
Instituto de Astrofísica de Canarias (IAC), 38205 La Laguna, Tenerife, Spain
6
Universidad de La Laguna, Dpto. Astrofísica, 38206 La Laguna, Tenerife, Spain
7
Université Lyon1, ENS-Lyon, CNRS, Centre de Recherche Astrophysique de Lyon UMR5574, 69230 Saint-Genis-Laval, France
Received:
23
July
2021
Accepted:
22
December
2021
We present the detection of [CII] 158 μm emission from the Spiderweb galaxy at z = 2.1612 using the Atacama Pathfinder EXperiment (APEX). The line profile splits into an active galactic nucleus (AGN) and circumgalactic medium (CGM) component previously identified in CO and [CI]. We find that these individual [CII] components are consistent in terms of CO and far-IR luminosity ratios with the populations of other z ≳ 1 AGN and dusty star-forming galaxies. The CGM component dominates the [CII] emission in the 10″ APEX beam. Although we do not have spatially resolved data, the close correspondence of the velocity profile with the CO(1−0) detected only on scales of tens of kiloparsecs in CO(1−0) suggests that the [CII] emission is similarly extended, reminiscent of [CII] halos recently found around z > 5 galaxies. Comparing the first four ionization states of carbon, we find that the atomic [CI] emission is dominant, which increases its reliability as a molecular mass tracer. Our [CII] detection at 601.8 GHz also demonstrates the feasibility to extend the frequency range of ALMA Band 9 beyond the original specifications.
Key words: galaxies: high-redshift / galaxies: ISM / submillimeter: ISM
1D spectrum is also available at the CDS via anonymous ftp to cdsarc.u-strasbg.fr (130.79.128.5) or via http://cdsarc.u-strasbg.fr/viz-bin/cat/J/A+A/658/L2
© ESO 2022
1. Introduction
The important role of the circumgalactic medium (CGM) as a reservoir feeding star forming gas to galaxies is now well established (e.g. Dekel et al. 2009). However, especially at high redshift, our knowledge of the CGM is still mostly limited to the brightest emission lines (e.g. Lyman-α), which mainly trace the warm gas and have the disadvantage of being poor tracers of the intrinsic velocity of the gas due to resonant scattering effects, and being ionized by a range of physical processes involving an active galactic nucleus (AGN), star formation, and shocks from inflows or outflows (Tumlinson et al. 2017; Daddi et al. 2021).
A more direct way to study the link between the CGM and star formation is to observe cold gas containing molecular hydrogen, which is the fuel for forming stars. This cold gas can be detected in the (sub)millimetre using bright CO (e.g. Cicone et al. 2014; Emonts et al. 2016; Ginolfi et al. 2017; Li et al. 2021) or fine structure lines (e.g. Cicone et al. 2015; Fujimoto et al. 2020; Herrera-Camus et al. 2021). Most of these results, especially those using the [CII] 158 μm line (hereinafter [CII]), appear to be tracing AGN or star formation driven outflows rather than an extended gas reservoir feeding the central galaxy. Most importantly, by its large spatial scale nature, any interferometer over-resolves a significant part of the extended CGM emission, in particular at the high observing frequencies of [CII] (Carniani et al. 2020; Novak et al. 2020; Decarli et al. 2021). This is where sensitive single-dish submillimetre (submm) telescopes can play an important role. Due to their limited collecting area, we can currently only target the brightest emission lines such as [CII].
In this Letter, we present Atacama Pathfinder EXperiment (APEX) [CII] observations of the Spiderweb galaxy at z = 2.1612, one of the best studied high redshift radio galaxies (HzRG), located at the centre of a protocluster (e.g. Pentericci et al. 2000; Miley et al. 2006). Emonts et al. (2013) first detected CO(1−0) in the Spiderweb galaxy using the Australia Telescope Compact Array (ATCA). Deeper observations showed that this emission splits into two components dominated by the AGN and the CGM, which is over-resolved in longer baseline observations with the Karl J. Jansky Very Large Array (VLA; Emonts et al. 2016). The extended CGM emission follows the diffuse UV light from young stars found with the Hubble Space Telescope (Hatch et al. 2008). While the CO(1−0) line traces the cold molecular gas, it is unfortunately rather faint. This is where the bright [CII] line presents a good alternative. However, at z = 2.1612, the [CII] line falls at 601.8 GHz, just below the edge of the ALMA Band 9 receivers, designed to cover 602 to 720 GHz (Baryshev et al. 2015). The upgraded version of this receiver installed in the Swedish ESO PI Instrument for APEX (SEPIA; Belitsky et al. 2018) has extended the frequency range to 578−738 GHz, which now allows one to observe the [CII] line in the Spiderweb galaxy.
Throughout this Letter, we assume a ΛCDM cosmology with H0 = 67.8 km s−1 Mpc−1, Ωm = 0.308, and ΩΛ = 0.692 (Planck Collaboration XIII 2016). At z = 2.1612, this corresponds to a luminosity distance DL = 17.5 Gpc and a scale of 8.5 kpc/″.
2. Observations and data reduction
We observed the [CII] 158 μm (νrest = 1900.539 GHz) using the SEPIA (Belitsky et al. 2018) on the APEX telescope (Güsten et al. 2006). The data were obtained under ESO project E-0106.A-1003A-2020 during five nights in December 2020. The total on-source integration time centred on RA =  Dec =
Dec =  was 4.3 h and the telescope time including all overheads and calibrations was 17.1 h. The precipitable water vapour (PWV) was in the range 0.3−0.6 mm, corresponding to a transmission 0.21 to 0.45 at the science frequency. While the CO redshift of 2.1612 used by Emonts et al. (2018) places the [CII] line at 601.204 GHz, we preferred to tune the receiver to 602.26 GHz in the lower sideband to centre the line in the middle of one of the two 4 GHz wide backend units, so as to avoid any edge effects affecting the line profile in the small overlap region between the two backends. We used the wobbler in symmetrical mode with an amplitude of 20″ and frequency of 1.5 Hz. Pointing and calibration was checked regularly against V Hya and IRC+10216 using the CO(J = 6 − 5) emission line. We estimated the overall calibration uncertainty at 15% and that the pointing accuracy was typically within 2″. The data were reduced using the standard procedures in the Continuum and Line Analysis Single-dish Software (CLASS; Pety 2005). We aligned both backend units by a simple average in the overlap region and fitted a first order baseline to each scan before averaging them1. In order to avoid subtracting the broad wings of the emission line, we excluded a region ±500 km −1 from the expected line centre (see in Fig. 1).
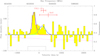 |
Fig. 1. APEX/SEPIA660 [CII] spectrum at a velocity resolution of 70 km s−1. The solid magenta line shows the average transmission during the observations (assuming elevation = 60°, PWV = 0.4 mm, and ambient temperature = 0° Celsius). We marked the redshifts and widths of the HeII line (Silva et al. 2018) and the AGN component in the CO(1−0) line (Emonts et al. 2016). The magenta- and cyan-dashed lines show the double Gaussian fit (sum in blue), where the redshift of the higher velocity component has been fixed to that of CO(1−0). The black line is the velocity exclusion region used for the baseline subtraction. |
Main beam characteristics have been determined from de-convolved continuum slews across Mars in September 2020. At 602 GHz, this yields a mean beam size of θmb =  , which we confirmed to be consistent with cross scans on the pointing sources. To determine the main beam efficiency, we used all Mars cross scans2 obtained between September and December 2020 to obtain a reliable fit of the Ruze formula (J.-P. Pérez-Beaupuits, priv. comm.). This yields a main beam efficiency ηmb = 0.58 ± 0.04 and an antenna gain of Jy/K = 48.5 ± 4. Figure 1 shows the [CII] spectrum binned to 70 km s−1 with the atmospheric transmission (Pardo et al. 2001) overlaid to illustrate the smooth gradient over the spectral range.
3. Results
We detect the [CII] line with a velocity integrated intensity of 48 ± 11 Jy km s−1 in the range −500 to 500 km s−1, where 0 km s−1 corresponds to the sky frequency of 601.204 GHz (corresponding to z = 2.1612; Emonts et al. 2018). The spectral profile clearly deviates from a single Gaussian, and it consists of two main velocity components listed in Table 1.
Observational parameters of the Spiderweb galaxy.
The [CII] spectral profile reflects the different velocity components covered by the 10″ APEX beam. The CO and [CI] detected galaxies of Emonts et al. (2018) with velocities within the observed [CII] line are located 9″ to 22″ from the APEX pointing, which is well outside of the APEX beam. Other companion galaxies are located within the APEX beam, but none of them have velocities within the [CII] profile (Pentericci et al. 2000; Kurk et al. 2004; Kuiper et al. 2011). One exception could be a very tentative (< 2σ) detection at 599.3 GHz, which is close to the expected z = 2.1701 ± 0.0016 of source #5 of Kuiper et al. (2011), located at the eastern edge of the host galaxy.
The AGN-dominated region3 has been detected in a range of emission lines. In the rest-frame UV, the narrow-line region has a velocity width of ∼2000 km s−1 (Silva et al. 2018), while the Hα line has a width of 15 000 km s−1, which can only originate from the AGN broad-line region (Nesvadba et al. 2006, 2011; Humphrey et al. 2008). The non-resonant HeII λ1640 Å recombination line is commonly used as the best tracer of the AGN systemic redshift zHeII = 2.1623 ± 0.0011 (Silva et al. 2018). This corresponds within the uncertainties with the zCO, VLA = 2.1617 ± 0.0003 of the AGN component in the CO(1−0) line identified by Emonts et al. (2016). As the HeII line has a 3× higher FWHM than the CO(1−0) (Fig. 1), the latter can provide a more accurate redshift constraint, despite the limited signal-to-noise of the CO(1−0) data. In addition, as the [CII] predominantly traces the photo-dissociation regions, it is expected to originate from the same gas as the CO(1−0), while the HeII is tracing the more extended photo-ionized gas. We thus assume the CO(1−0) AGN redshift and the nominal redshift of the AGN.
The molecular and atomic gas in the Spiderweb galaxy show an even more complex structure. Gullberg et al. (2016) found at least three spatially and spectrally separated components detected in the [CI] 370 μm (3P2−3P1) line. Two of these components with velocity widths of 270 and 1100 km s−1 appear to be associated with the AGN, with an additional 230 km s−1 wide component offset by +360 km s−1. Emonts et al. (2018) found a very similar total profile in the [CI] 609 μm (3P1−3P0) and CO(4−3) lines. On more extended CGM scales (17−70 kpc), Emonts et al. (2016, 2018) found that the CO(1−0) is blueshifted by a few hundred km s−1 with respect to the CO(1−0) in the AGN. Figure 2 compares these AGN and CGM components of CO(1−0) with our [CII] velocity profile, and it illustrates a striking correspondence. We therefore interpret the narrow [CII] component at −234 km s−1 to originate from the CGM predominantly.
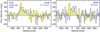 |
Fig. 2. Total [CII] spectrum (yellow histogram) with CO(1−0) from different regions overlaid in blue. In both panels, the CO(1−0) was scaled up in flux by a factor of 650 for easy comparison with [CII]. Left: CO(1−0) emission on scales of 17−70 kpc in the CGM around the Spiderweb galaxy. The CO(1−0) spectrum was made from low-resolution ATCA data with the central emission subtracted (see Emonts et al. 2018, for details). Right: CO(1−0) emission in the inner ∼6 kpc of the radio galaxy, from high-resolution VLA data (Emonts et al. 2016). The CO(1−0) emission on ∼6−17 kpc scales around the AGN is not captured reliably in this figure due to the difference in resolution between the ATCA and VLA data. |
4. Discussion
Our [CII] detection is not only the first one reported in a HzRG, but also one of the few reported in the CGM of a massive high-redshift galaxy (e.g. Cicone et al. 2015). This allows us to compare the Spiderweb galaxy with other high-z galaxies, and to provide new insight into the physical conditions in the CGM.
We first compared the total [CII] luminosity of the Spiderweb galaxy with other sources. A key property is the FIR luminosity, integrated over the source based on Herschel observations. Seymour et al. (2012) report an IR (8−1000 μm) LIR = 2 ± 0.3 × 10¹³ L⊙, splitting in 1.2 and 0.8 × 10¹³ L⊙ for the AGN and starburst (=CGM) components, respectively. To convert from IR to FIR (42−500 μm), we assumed LFIR = 0.5 × LIR; this implies a L[CII]/LFIR ≈ 9 × 10⁻⁴, which is close to the average for dusty star-forming galaxies (DSFG; Gullberg et al. 2015), but lower than for z ∼ 2 main sequence galaxies (Zanella et al. 2018). Separating both the dust and [CII] emission into AGN and CGM-dominated components, the ratios become 6 × 10⁻⁴ for the AGN and 1.3 × 10⁻³ for CGM component. These different L[CII]/LFIR values are consistent with those for other high-z AGN and star-forming galaxies reported by Gullberg et al. (2015). We also note that with a 0.09% contribution to the LFIR, the [CII] line unlikely affects the Herschel 500 μm photometry (Smail et al. 2011; Seymour et al. 2012). Interestingly, the star formation rate SFR = 1400 ± 150 M⊙ yr−1 (where the AGN component has been spectrally removed in the SED; Seymour et al. 2012) is exactly on the SFR–L[CII] relation for high-z galaxies of De Looze et al. (2014), while for low metallicity galaxies, brighter [CII] emission would be expected. Overall, this suggests that the AGN is unlikely to be the dominant source powering the [CII] in the Spiderweb galaxy.
Both our APEX [CII] spectrum and the ATCA+VLA CO(1−0) spectrum allowed us to isolate the AGN and CGM components (Fig. 2, Table 1). Using ICO(1 − 0),VLA = 0.08 ± 0.03 Jy km s−1 for the AGN (Emonts et al. 2016), we found LCO(1 − 0),VLA = (9 ± 3) × 105 L⊙ and L[CII]/LCO(1 − 0) ≈ 4200. This value is close to the 5200 ± 1800 found by Gullberg et al. (2015) for DSFGs. While this presents a consistent picture where the AGN has a negligible contribution to the cold dust as well as CO(1−0) and [CII] luminosities, it is important to consider the uncertainties in the separation of the AGN and CGM components in one or both of the lines. We trust the separation in CO(1−0) to be quite reliable as it is based on spatially resolved observations, which vary with distance from the AGN. Moreover, for the compact component near the AGN, Emonts et al. (2018) report a thermalized  , which is also consistent with AGN excitation. If the spatially isolated AGN component in CO(1−0) were off by a significant amount, this would also affect the CO(4−3) in a similar fashion, which is rather unlikely. We therefore conclude that the [CII] luminosity is dominated by the CGM at negative velocities with a possible contribution from the AGN mostly at positive velocities.
Our detection of [CII] in the CGM allows us to better characterize the CGM surrounding one of the most massive high-redshift sources known. Emonts et al. (2018) also separated the CGM component in [CI]1−0 and CO(4−3), but those lines likely have more AGN residuals from the central point spread function than for CO(1−0) because the CO emission is thermalized and both [CI] lines are comparatively bright at the central AGN (Gullberg et al. 2016; Emonts et al. 2018). Conversely, on scales of the CGM, the molecular gas is subthermally excited and has a lower [CI] abundance relative to CO(1−0) compared to the AGN region (Emonts et al. 2018), meaning that the fraction of the emission coming from the CGM is larger, and thus easier to separate, in CO(1−0) than in CO(4−3) or [CI]. Our APEX [CII] detection thus confirms the presence of the CGM component at predominantly negative velocities in CO(1−0), but we lack a signal-to-noise ratio (S/N) to reliably measure the profile at positive velocities. To derive the CGM component in CO(1−0), we assumed ICO(1 − 0),CGM = ICO(1 − 0),ATCA − ICO(1 − 0),VLA = 0.16 ± 0.09 Jy km s−1 (Emonts et al. 2016), yielding LCO(1 − 0),CGM = (1.9 ± 1.0) × 106 L⊙. This implies L[CII],CGM/LCO(1 − 0),CGM ≈ 2800, which for optically thick CO emission suggests low [CII] excitation temperatures, unless the [CII] is also optically thick (Gullberg et al. 2015). Normalizing by the FIR luminosity, the CGM component in the Spiderweb galaxy falls in the region of nearby galaxies with average radiation fields G0 ∼ 103 and densities n ∼ 105 cm−3, assuming the [CII] is mostly dominated by photo-dissociation regions (Stacey et al. 2010; Gullberg et al. 2015).
Although our APEX detection does not provide any spatial information, we predict that the [CII] in the Spiderweb galaxy is likely quite extended because it traces the more extended component in CO(1−0). Moreover, extended [CII] emission has now been regularly observed in several high-redshift objects (Cicone et al. 2015; Fujimoto et al. 2020; Carniani et al. 2020; Rybak et al. 2020; Herrera-Camus et al. 2021). Given that the spatial scales can be several tens of kiloparsecs or more, even short-baseline observations at these high frequencies may not be able to detect the full extent of the CGM in [CII] emission. On the other hand, the APEX beam size of 10″ corresponds to a physical scale of ∼70 kpc, which is the same as the total extent of the cold molecular gas reservoir in the CGM observed in CO(1−0).
Our [CII] detection also completes a census of the first four ionization states of carbon. As mentioned earlier, Gullberg et al. (2016) and Emonts et al. (2018) reported [CI] emission consisting of several spatially and spectrally resolved components, where the AGN component is significantly brighter than the CGM component. The CIII] 1909 Å and CIV 1549 Å lines were first reported in the discovery spectrum of Röttgering et al. (1997), with a line ratio of CIV 1549Å/CIII] 1909 Å = 0.6 ± 0.2. Since then, only the CIV 1549 Å line has been observed at a higher S/N and spectral resolution (Kurk 2003; Hatch et al. 2008), suggesting a broad component in the CIV 1549 Å line, but with a total line flux about half of the one reported by Röttgering et al. (1997). We interpret this difference as a combination of slit aperture effects and a low S/N. Only deeper observations with integral field spectrographs can provide more reliable line ratios, but we can nevertheless conclude that the ratio is unlikely to exceed unity. This places the Spiderweb galaxy slightly below average among HzRGs and suggests an AGN photoionization with an ionization parameter log(U) ≈ −2 (De Breuck et al. 2000). We note that Kurk (2003) also reported CII 1334.5 Å absorption at z = 2.1645 ± 0.0004 with an equivalent width of 2.4 ± 0.7. This offset of +400 km s−1 means that this absorbing gas is part of the CGM surrounding the Spiderweb galaxy, but not associated with the main component we detected in [CII] 158 μm. Overall, the integrated carbon budget with bright [CI] and more average [CII], CIII], and CIV argues for a relatively modest excitation with most of the carbon in the lowest ionization state, especially for the AGN component. Our results suggest that, at least in AGN-dominated regions, carbon excitation to higher levels by an external ionization field is not a major concern when using the [CI] lines as H2 tracers (e.g. Glover & Clark 2016).
5. Conclusions
By extending the tuning range compared to the ALMA Band 9 receivers, we have detected [CII] emission from the Spiderweb galaxy using SEPIA660 on APEX. Our conclusions are:
-
The [CII] line consists of two velocity components, which by comparing with the CO(1−0) and HeII 1640 Å spectra, we identify as being associated with the AGN and the CGM.
-
The individual components are consistent in terms of CO and FIR luminosity ratios with the AGN and DSFG populations. The CGM component dominates the [CII] flux.
-
Due to the close correspondence of the CO(1−0) spectrum to the CGM component, we predict that the [CII] flux is extended over several tens of kiloparsecs.
-
The [CII] line completes a census of the first four ionization states of carbon in the Spiderweb galaxy. The atomic [CI] line is most prominent, suggesting relatively low excitation, especially near the AGN.
Our detection also illustrates two technical results: first, despite a reduced atmospheric transmission, new science is enabled by extending the frequency range of a Band 9 receiver beyond the original specifications; second, single-dish observations remain essential to detect extended emission from the CGM (see also Frayer et al. 2018). However, spending 17 hours in very good weather conditions is at the limit of what a 12 m telescope such as APEX can do. Only a large single-dish telescope such as the Atacama Large Aperture Submm Telescope (AtLAST; Cicone et al. 2019; Klaassen et al. 2020) will be able to reveal the link between galaxies and their accreting CGM gas streams.
Acknowledgments
The results presented in this Letter would not have been possible without the dedication of the APEX engineers, operators, astronomers and logistics staff to bring the telescope back online during the covid-19 pandemic. We thank the anonymous referee for their advice that has improved this Letter. This publication is based on data acquired with the Atacama Pathfinder Experiment (APEX) under programme ID 0106.A-1003 (ESO). APEX is a collaboration between the Max-Planck-Institut für Radioastronomie, the European Southern Observatory, and the Onsala Space Observatory. This work has received funding from the European Union’s Horizon 2020 research and innovation programme under grant agreement No 951815. The National Radio Astronomy Observatory is a facility of the National Science Foundation operated under cooperative agreement by Associated Universities, Inc. H.D. acknowledges financial support from the Spanish Ministry of Science, Innovation and Universities (MICIU) under the 2014 Ramón y Cajal program RYC-2014-15686, from the Agencia Estatal de Investigación del Ministerio de Ciencia e Innovación (AEI-MCINN) under grant (La evolución de los cíumulos de galaxias desde el amanecer hasta el mediodía cósmico) with reference (PID2019-105776GB-I00/DOI:10.13039/501100011033) and acknowledges support from the ACIISI, Consejería de Economía, Conocimiento y Empleo del Gobierno de Canarias and the European Regional Development Fund (ERDF) under grant with reference PROID2020010107.
References
- Baryshev, A., Hesper, R., Mena, F., et al. 2015, A&A, 577, A129 [NASA ADS] [CrossRef] [EDP Sciences] [Google Scholar]
- Belitsky, V., Lapkin, I., Fredrixon, M., et al. 2018, A&A, 612, A23 [NASA ADS] [CrossRef] [EDP Sciences] [Google Scholar]
- Carniani, S., Ferrara, A., Maiolino, R., et al. 2020, MNRAS, 499, 5136 [NASA ADS] [CrossRef] [Google Scholar]
- Cicone, C., Maiolino, R., Sturm, E., et al. 2014, A&A, 562, A21 [NASA ADS] [CrossRef] [EDP Sciences] [Google Scholar]
- Cicone, C., Maiolino, R., Gallerani, S., et al. 2015, A&A, 574, A14 [NASA ADS] [CrossRef] [EDP Sciences] [Google Scholar]
- Cicone, C., De Breuck, C., Chen, C.-C., et al. 2019, BAAS, 51, 82 [NASA ADS] [Google Scholar]
- Daddi, E., Valentino, F., Rich, R., et al. 2021, A&A, 649, A78 [NASA ADS] [CrossRef] [EDP Sciences] [Google Scholar]
- De Breuck, C., Röttgering, H., Miley, G., et al. 2000, A&A, 362, 519 [Google Scholar]
- Decarli, R., Arrigoni-Battaia, F., Hennawi, J., et al. 2021, A&A, 645, L3 [NASA ADS] [CrossRef] [EDP Sciences] [Google Scholar]
- Dekel, A., Birnboim, Y., Engel, G., et al. 2009, Nature, 457, 451 [Google Scholar]
- De Looze, I., Cormier, D., Lebouteiller, V., et al. 2014, A&A, 568, A62 [NASA ADS] [CrossRef] [EDP Sciences] [Google Scholar]
- Emonts, B., Feain, I., Röttgering, H., et al. 2013, MNRAS, 430, 3465 [NASA ADS] [CrossRef] [Google Scholar]
- Emonts, B., Lehnert, M., Villar-Martín, M., et al. 2016, Science, 354, 1128 [NASA ADS] [CrossRef] [Google Scholar]
- Emonts, B., Lehnert, M., Dannerbauer, H., et al. 2018, MNRAS, 477, L60 [NASA ADS] [CrossRef] [Google Scholar]
- Frayer, D., Maddalena, R., Ivison, R., et al. 2018, ApJ, 860, 87 [NASA ADS] [CrossRef] [Google Scholar]
- Fujimoto, S., Silverman, J., Bethermin, M., et al. 2020, ApJ, 900, 1 [NASA ADS] [CrossRef] [Google Scholar]
- Ginolfi, M., Maiolino, R., Nagao, T., et al. 2017, MNRAS, 468, 3468 [CrossRef] [Google Scholar]
- Glover, S., & Clark, P. 2016, MNRAS, 456, 3596 [NASA ADS] [CrossRef] [Google Scholar]
- Gullberg, B., De Breuck, C., Vieira, J., et al. 2015, MNRAS, 449, 2883 [NASA ADS] [CrossRef] [Google Scholar]
- Gullberg, B., Lehnert, M., De Breuck, C., et al. 2016, A&A, 591, A73 [NASA ADS] [CrossRef] [EDP Sciences] [Google Scholar]
- Güsten, R., Nyman, L. Å., Schilke, P., et al. 2006, A&A, 454, L13 [NASA ADS] [CrossRef] [EDP Sciences] [Google Scholar]
- Hatch, N., Overzier, R., Röttgering, H., et al. 2008, MNRAS, 383, 931 [Google Scholar]
- Herrera-Camus, R., Förster Schreiber, N., Genzel, R., et al. 2021, A&A, 649, A31 [NASA ADS] [CrossRef] [EDP Sciences] [Google Scholar]
- Humphrey, A., Villar-Martín, M., Vernet, J., et al. 2008, MNRAS, 383, 11 [NASA ADS] [CrossRef] [Google Scholar]
- Klaassen, P., Mroczkowski, T., Cicone, C., et al. 2020, Proc. SPIE, 11445, 114452F [NASA ADS] [Google Scholar]
- Kuiper, E., Hatch, N., Miley, G., et al. 2011, MNRAS, 415, 2245 [NASA ADS] [CrossRef] [Google Scholar]
- Kurk, J. 2003, PhD Thesis, Leiden Observatory, The Netherlands [Google Scholar]
- Kurk, J., Pentericci, L., Overzier, R., et al. 2004, A&A, 428, 817 [NASA ADS] [CrossRef] [EDP Sciences] [Google Scholar]
- Li, J., Emonts, B., Cai, Z., et al. 2021, ApJ, 922, L29 [NASA ADS] [CrossRef] [Google Scholar]
- Miley, G., Overzier, R., Zirm, A., et al. 2006, ApJ, 650, L29 [CrossRef] [Google Scholar]
- Nesvadba, N., Lehnert, M., Eisenhauer, F., et al. 2006, ApJ, 650, 693 [NASA ADS] [CrossRef] [Google Scholar]
- Nesvadba, N., De Breuck, C., Lehnert, M., et al. 2011, A&A, 525, A43 [NASA ADS] [CrossRef] [EDP Sciences] [Google Scholar]
- Novak, M., Venemans, B., Walter, F., et al. 2020, ApJ, 904, 131 [NASA ADS] [CrossRef] [Google Scholar]
- Pardo, J. R., Cernicharo, J., & Serabyn, E. 2001, IEEE Trans. Antennas Propag., 49, 1683 [Google Scholar]
- Pentericci, L., Kurk, J., Röttgering, H., et al. 2000, A&A, 361, L25 [NASA ADS] [Google Scholar]
- Pety, J. 2005, SF2A-2005: Semaine de l’Astrophysique Francaise, 721 [Google Scholar]
- Planck Collaboration XIII. 2016, A&A, 594, A13 [NASA ADS] [CrossRef] [EDP Sciences] [Google Scholar]
- Röttgering, H., van Ojik, R., Miley, G., et al. 1997, A&A, 326, 505 [Google Scholar]
- Rybak, M., Hodge, J., Vegetti, S., et al. 2020, MNRAS, 494, 5542 [NASA ADS] [CrossRef] [Google Scholar]
- Seymour, N., Altieri, B., De Breuck, C., et al. 2012, ApJ, 755, 146 [NASA ADS] [CrossRef] [Google Scholar]
- Silva, M., Humphrey, A., Lagos, P., et al. 2018, MNRAS, 481, 1401 [NASA ADS] [CrossRef] [Google Scholar]
- Smail, I., Swinbank, A. M., Ivison, R., et al. 2011, MNRAS, 414, L95 [NASA ADS] [CrossRef] [Google Scholar]
- Stacey, G., Hailey-Dunsheath, S., Ferkinhoff, C., et al. 2010, ApJ, 724, 957 [NASA ADS] [CrossRef] [Google Scholar]
- Tumlinson, J., Peeples, M., & Werk, J. 2017, ARA&A, 55, 389 [NASA ADS] [CrossRef] [Google Scholar]
- Zanella, A., Daddi, E., Magdis, G., et al. 2018, MNRAS, 481, 1976 [Google Scholar]
All Tables
All Figures
|
Fig. 1. APEX/SEPIA660 [CII] spectrum at a velocity resolution of 70 km s−1. The solid magenta line shows the average transmission during the observations (assuming elevation = 60°, PWV = 0.4 mm, and ambient temperature = 0° Celsius). We marked the redshifts and widths of the HeII line (Silva et al. 2018) and the AGN component in the CO(1−0) line (Emonts et al. 2016). The magenta- and cyan-dashed lines show the double Gaussian fit (sum in blue), where the redshift of the higher velocity component has been fixed to that of CO(1−0). The black line is the velocity exclusion region used for the baseline subtraction. |
| In the text | |
|
Fig. 2. Total [CII] spectrum (yellow histogram) with CO(1−0) from different regions overlaid in blue. In both panels, the CO(1−0) was scaled up in flux by a factor of 650 for easy comparison with [CII]. Left: CO(1−0) emission on scales of 17−70 kpc in the CGM around the Spiderweb galaxy. The CO(1−0) spectrum was made from low-resolution ATCA data with the central emission subtracted (see Emonts et al. 2018, for details). Right: CO(1−0) emission in the inner ∼6 kpc of the radio galaxy, from high-resolution VLA data (Emonts et al. 2016). The CO(1−0) emission on ∼6−17 kpc scales around the AGN is not captured reliably in this figure due to the difference in resolution between the ATCA and VLA data. |
| In the text | |
Current usage metrics show cumulative count of Article Views (full-text article views including HTML views, PDF and ePub downloads, according to the available data) and Abstracts Views on Vision4Press platform.
Data correspond to usage on the plateform after 2015. The current usage metrics is available 48-96 hours after online publication and is updated daily on week days.
Initial download of the metrics may take a while.