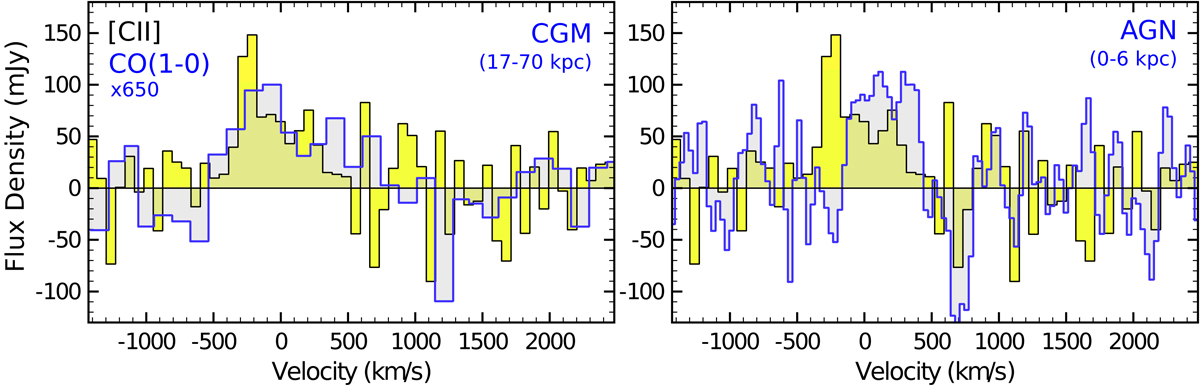
Fig. 2.
Download original image
Total [CII] spectrum (yellow histogram) with CO(1−0) from different regions overlaid in blue. In both panels, the CO(1−0) was scaled up in flux by a factor of 650 for easy comparison with [CII]. Left: CO(1−0) emission on scales of 17−70 kpc in the CGM around the Spiderweb galaxy. The CO(1−0) spectrum was made from low-resolution ATCA data with the central emission subtracted (see Emonts et al. 2018, for details). Right: CO(1−0) emission in the inner ∼6 kpc of the radio galaxy, from high-resolution VLA data (Emonts et al. 2016). The CO(1−0) emission on ∼6−17 kpc scales around the AGN is not captured reliably in this figure due to the difference in resolution between the ATCA and VLA data.
Current usage metrics show cumulative count of Article Views (full-text article views including HTML views, PDF and ePub downloads, according to the available data) and Abstracts Views on Vision4Press platform.
Data correspond to usage on the plateform after 2015. The current usage metrics is available 48-96 hours after online publication and is updated daily on week days.
Initial download of the metrics may take a while.