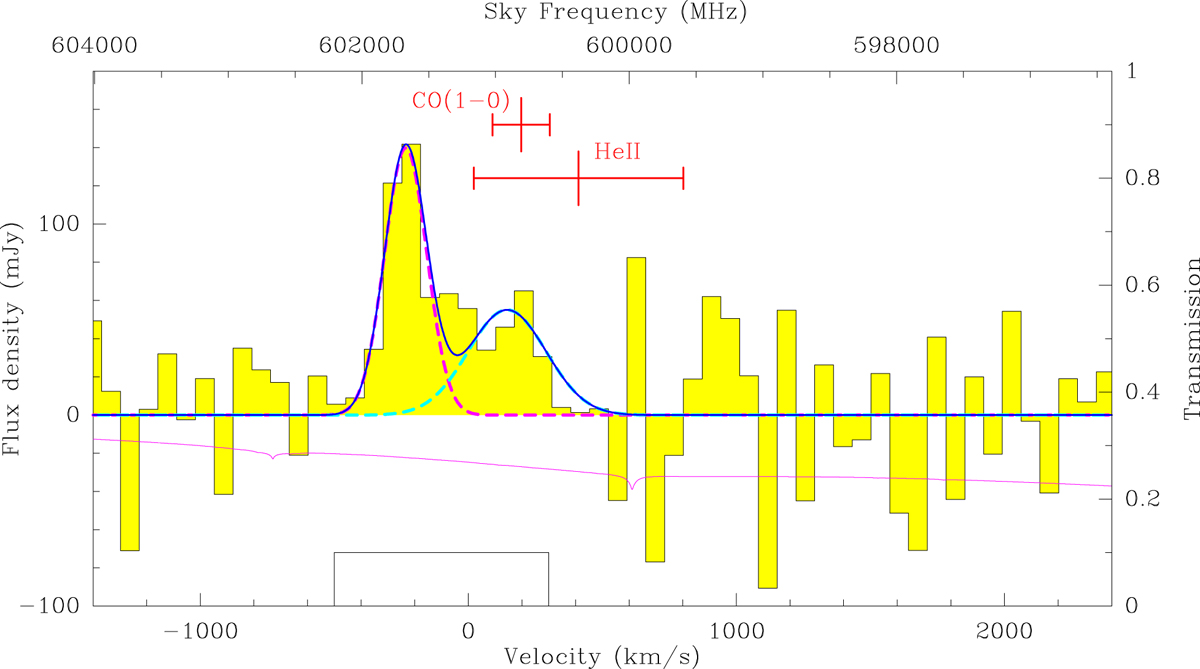
Fig. 1.

Download original image
APEX/SEPIA660 [CII] spectrum at a velocity resolution of 70 km s−1. The solid magenta line shows the average transmission during the observations (assuming elevation = 60°, PWV = 0.4 mm, and ambient temperature = 0° Celsius). We marked the redshifts and widths of the HeII line (Silva et al. 2018) and the AGN component in the CO(1−0) line (Emonts et al. 2016). The magenta- and cyan-dashed lines show the double Gaussian fit (sum in blue), where the redshift of the higher velocity component has been fixed to that of CO(1−0). The black line is the velocity exclusion region used for the baseline subtraction.
Current usage metrics show cumulative count of Article Views (full-text article views including HTML views, PDF and ePub downloads, according to the available data) and Abstracts Views on Vision4Press platform.
Data correspond to usage on the plateform after 2015. The current usage metrics is available 48-96 hours after online publication and is updated daily on week days.
Initial download of the metrics may take a while.


